St. Croix Realtors Joe & Julie San Martin
April 2026
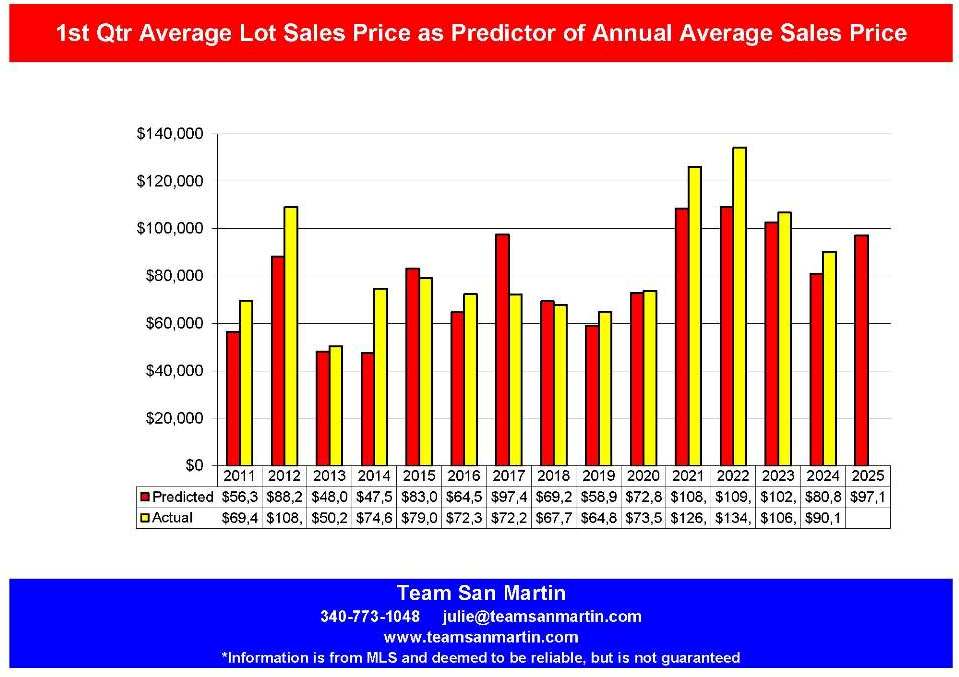
1st Quarter Sales as Predictor for the full year
The St Croix real estate market made a strong recovery through 2022, is now showing signs of contraction.
The question is – what do the 1st quarter statistics predict about market prospects for the rest of the year?
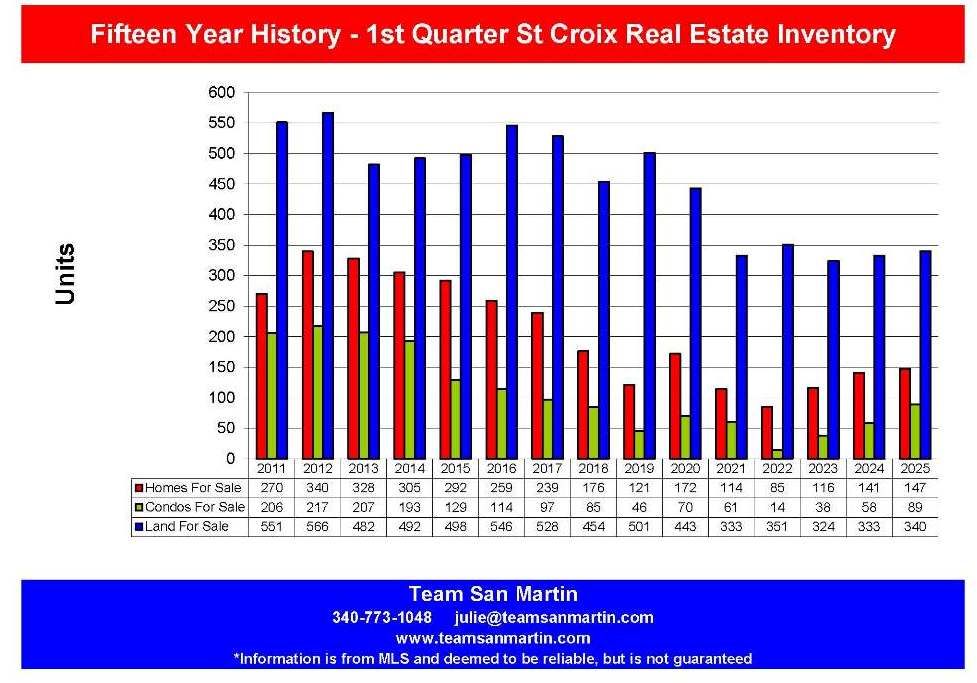
First, a look at inventory trends over the
15 year period:
· Residential inventory peaked in 2012, with 340 homes for sale, then steadily declined each year to the low point of only 85 homes for sale in 2022. Residential inventory is again increasing.
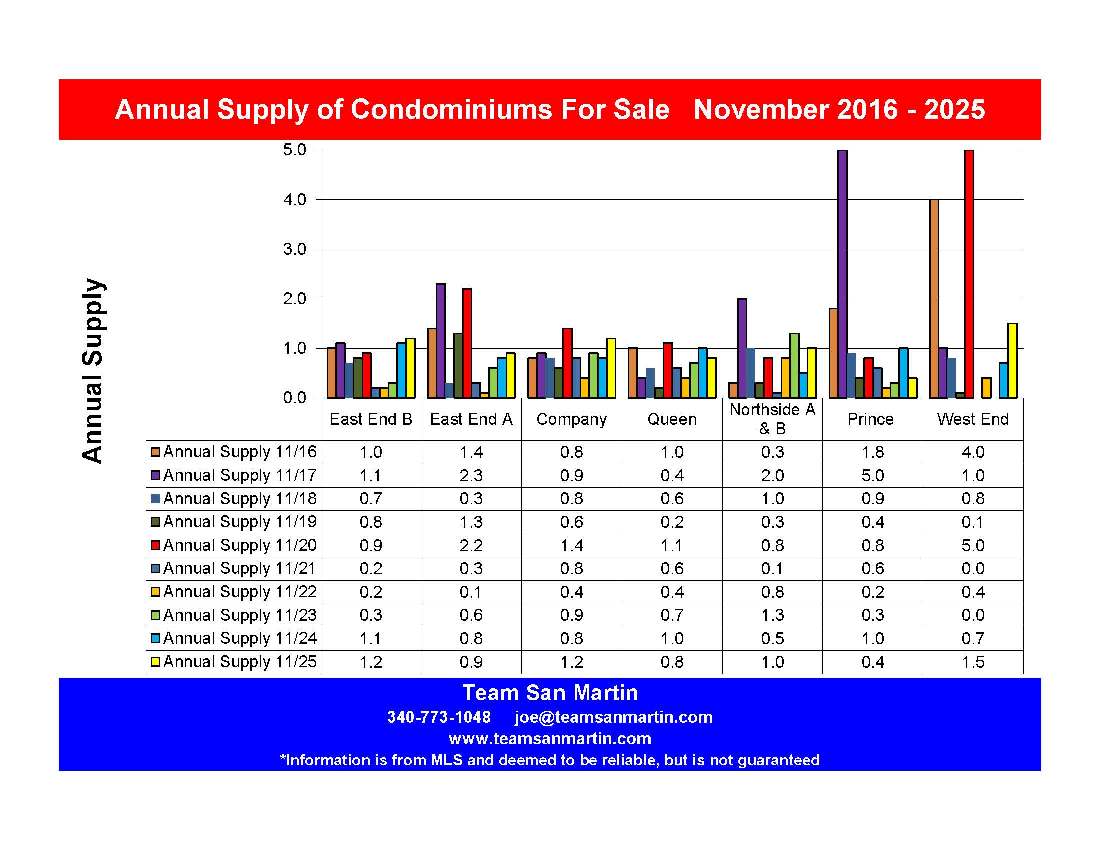
· Condominium inventory also peaked in 2012, with 217 condominiums for sale, then steadily declined each year to the low point of only 14 condos on the market in 2022. Inventory has rebounded to a more normal level of 122 condominiums for sale.
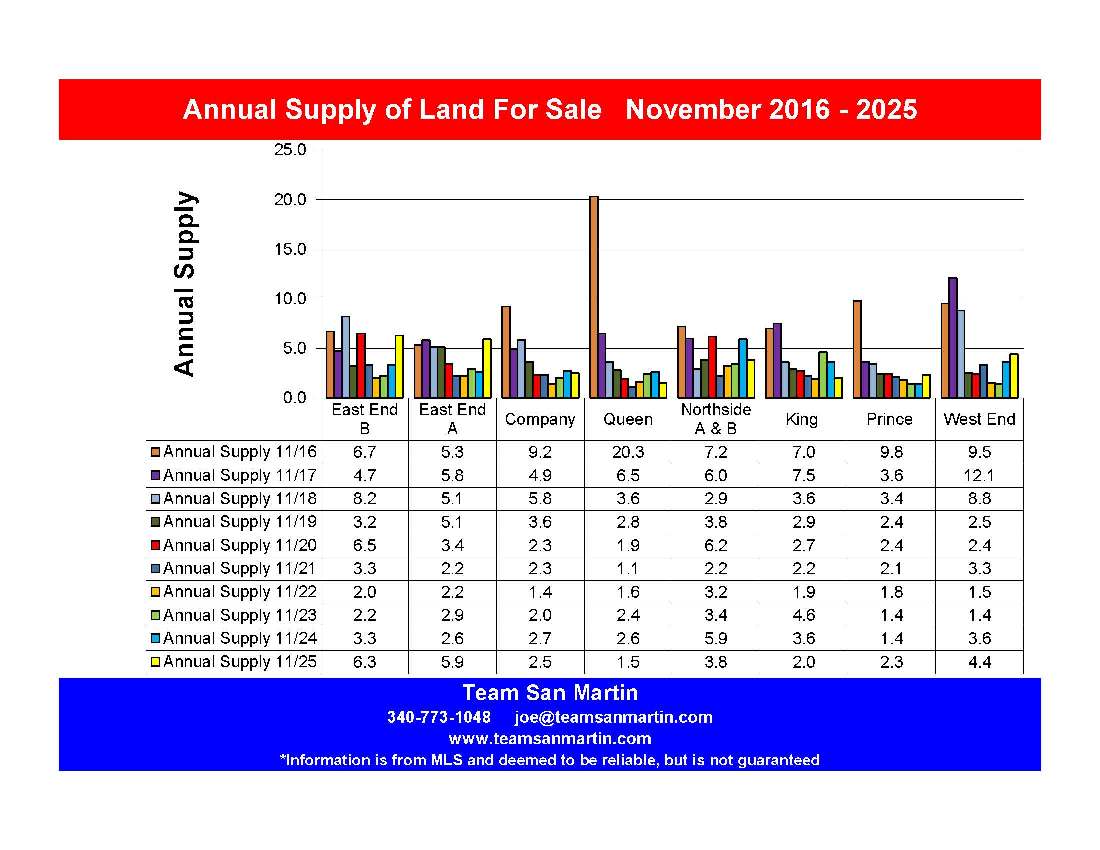
· Land inventory also peaked in 2012, at 566 lots for sale. Until 2020, land inventory was between 566 and 443 lots for sale. For the past six years, 1st quarter land inventory has been in the low to mid-300 lot range.
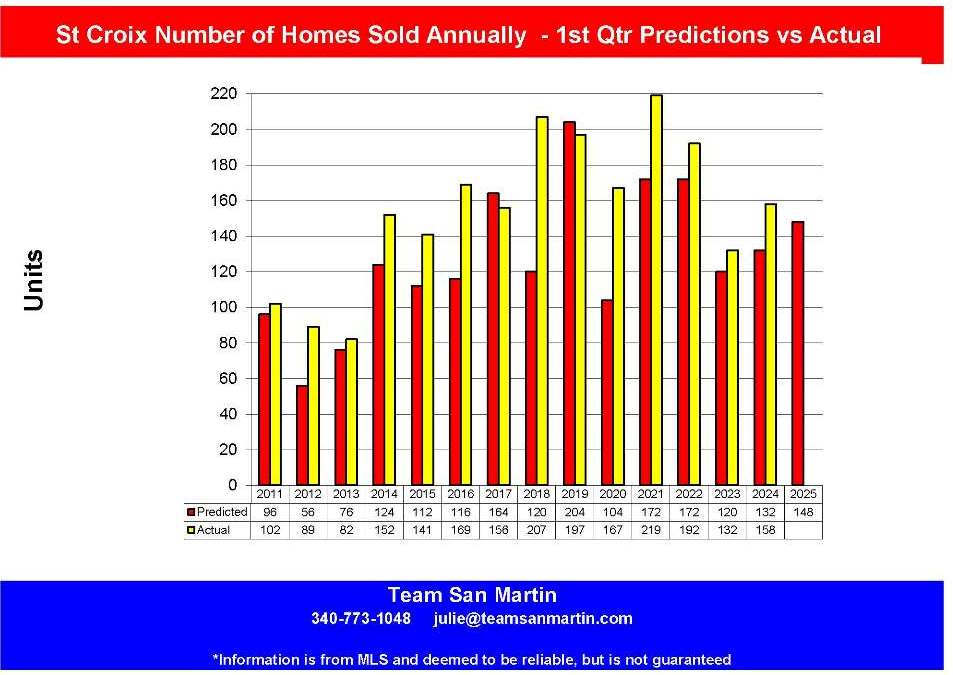
Residential Sales & 2026 Predictions
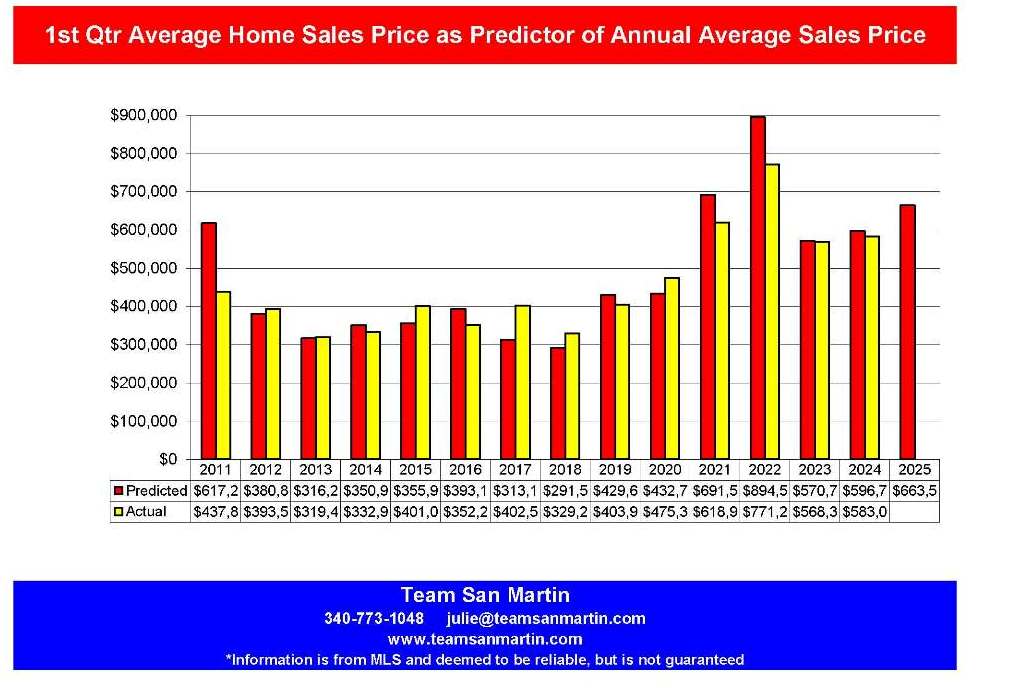
Over the past 15 years, the number of homes sold during the first quarter has under predicted the annual sales number, with two outliers (2017 and 2019) which slightly overpredicted the annual number of homes sold.
The 1st quarter average sales price is a fairly accurate predictor of the annual home sales price. Again, there were a few outlier years – 2021, 2022, and 2025 when 1st quarter sales price overpredicted the annual average sales price.
2026 annual prediction:
· Total number of homes sold will be as predicted, around 175 homes.
· Average sales price will most likely be in mid $400,000 range, a decrease of about $150,000, compared to 2025.
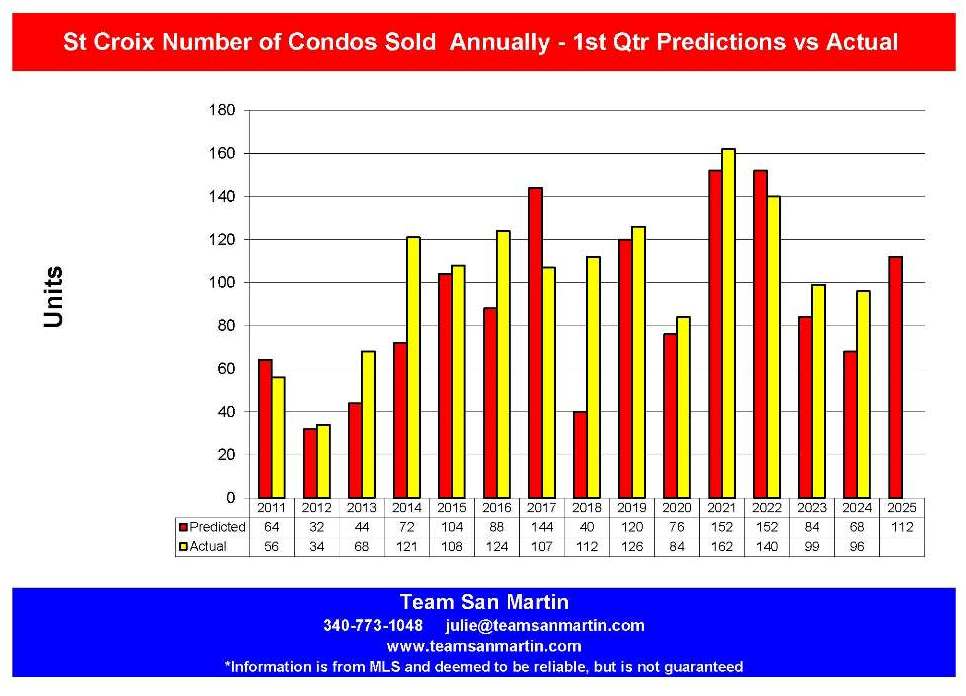
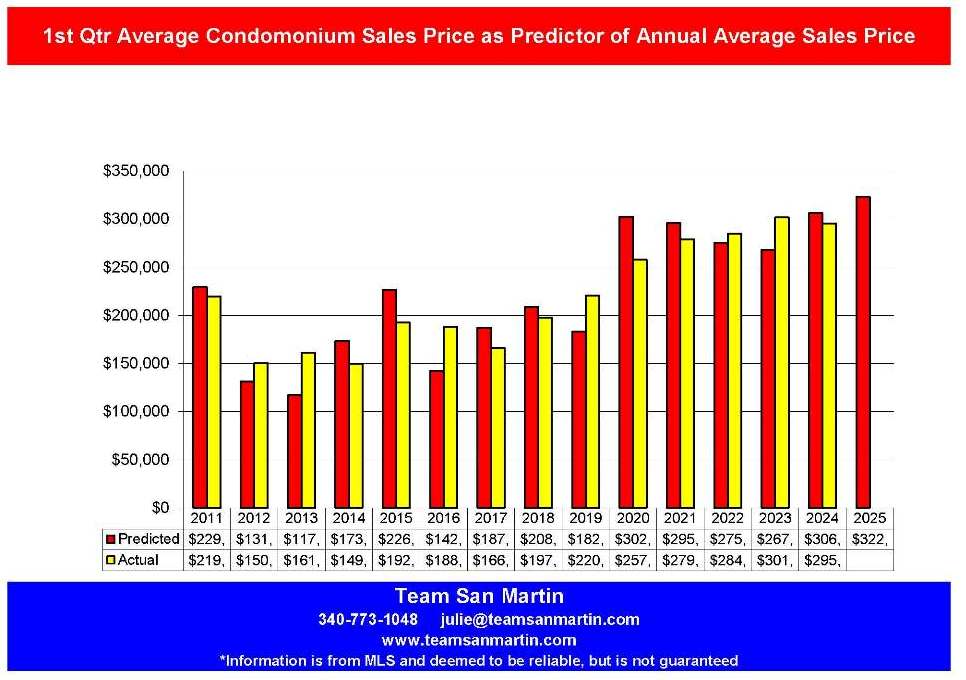
Condominium Sales & 2026 Predictions
Condominiums are a much smaller market, with just a few units built since the 1980s. It is more difficult to identify trends because the sample is significantly smaller.
Since 2015, the number of condominium sales on St Croix has been in the 100-to-150-unit annual range.
1st quarter average sale price has, in most cases, been a fairly close predictor for the year.
2026 annual prediction:
· Total number of condominiums sold will be in the 100 unit range.
· Average sales price will most likely be in the low $300,000 range.
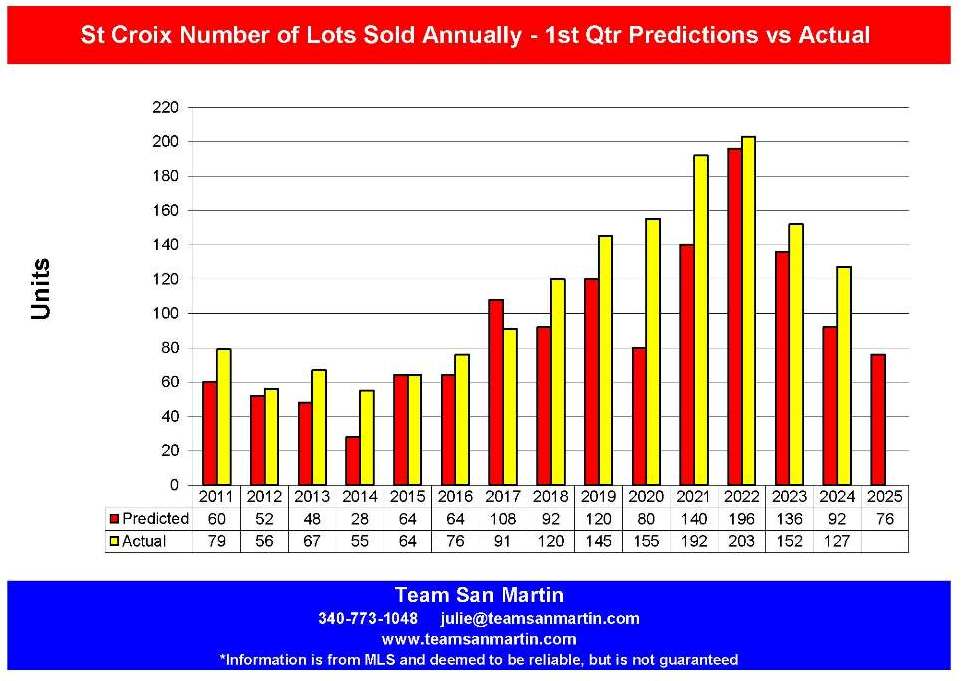
Land Sales & 2026 Predictions
Both predicted and actual number of lots sold were trending up until 2023. The number of lots sold declined 37% from 2022 to 2024. The 2026 1st quarter figure predicts only 100 lot sales during 2026; based on the two previous years, this number should be significantly higher.
For the period of 2021 through 2023, the average lot sales price was in the $100,000 range. The 2025 “average” sales price is skewed by the $17 Million sale to the VI Government. Based on 1st quarter sales, the predicted average price is a return to an average sales price in the $90,000 range.
2026 annual prediction:
· Total number of lots sold will be 150 to 175.
· The 2026 average lot sales price will be in the $90,000 range.
Information is from MLS and deemed to be reliable, but is not guaranteed.
Prepared by:
Julie San Martin
Team Manager
March2026
St Thomas vs St Croix
A 20 Year Look
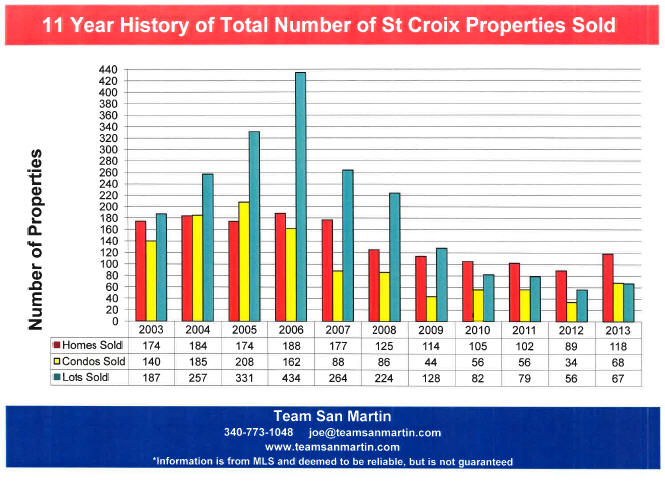
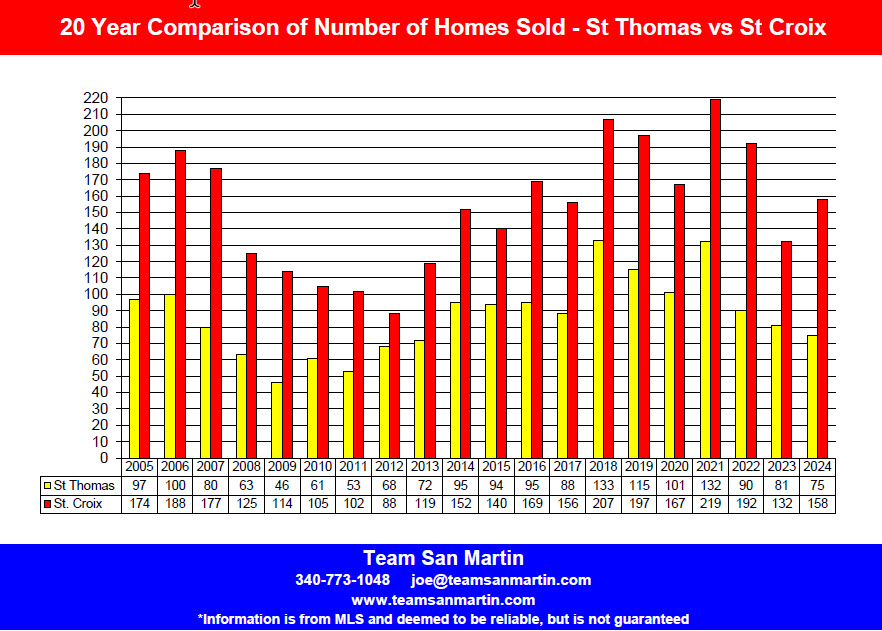
Total Number of Properties Sold
Over the 20-year period, more homes sold every year on St Croix than on St Thomas.
Over the 20-year period, the highest number of homes sold was in 2021 for St Croix with 219 home sales and 2018 for St Thomas with 133 home sales; 2021 was nearly the same, with 132 home sales on St Thomas.
During 2025, 50 more homes were sold on St Croix than on St Thomas.
Over the 20-year period, the fewest number of homes sold on St Croix (88) was during 2012, the fewest number of homes sold on St Thomas (46) was during 2009.
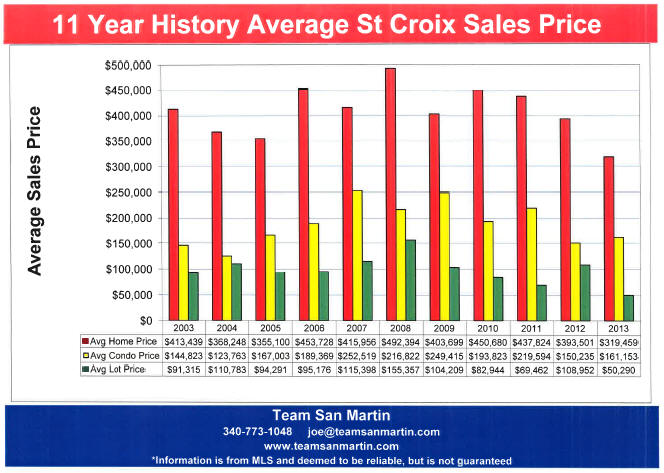
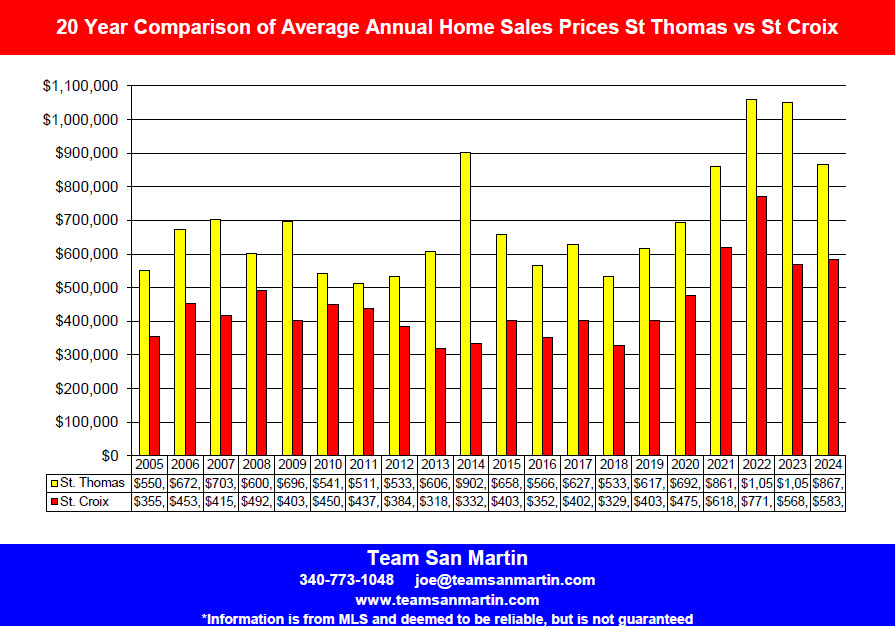
Average Sales Price
For the past 20 years, the annual average home sale price on St Thomas has exceeded that of St Croix.
For 2025, the average St Thomas homesale price was 52% higher, at $974,931, than the 2025 average St Croix sales price ($643,330).
The average annual home sale price on St Croix for 2025 was42% higher, at $
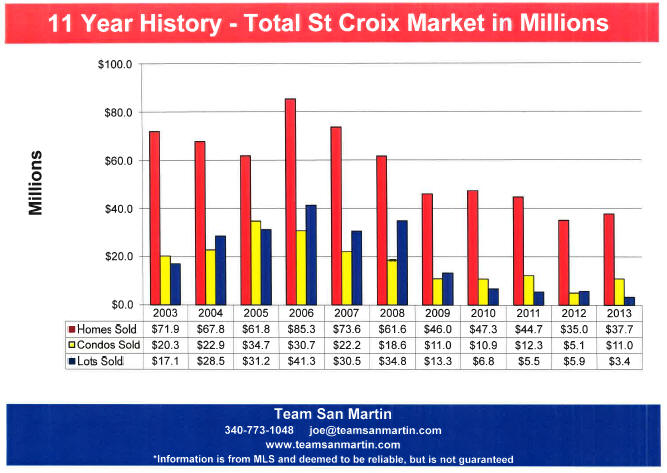
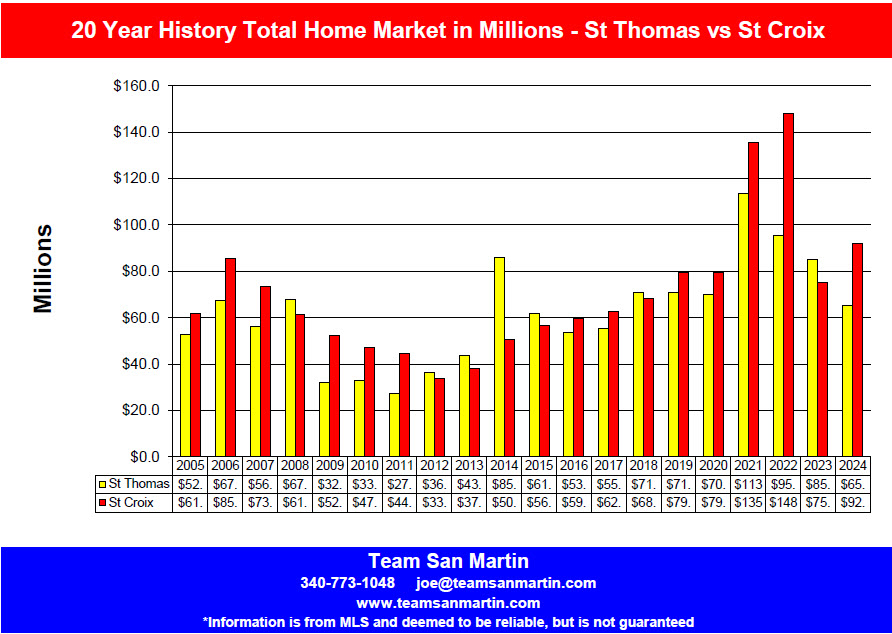
Total Market in Millions of Dollars
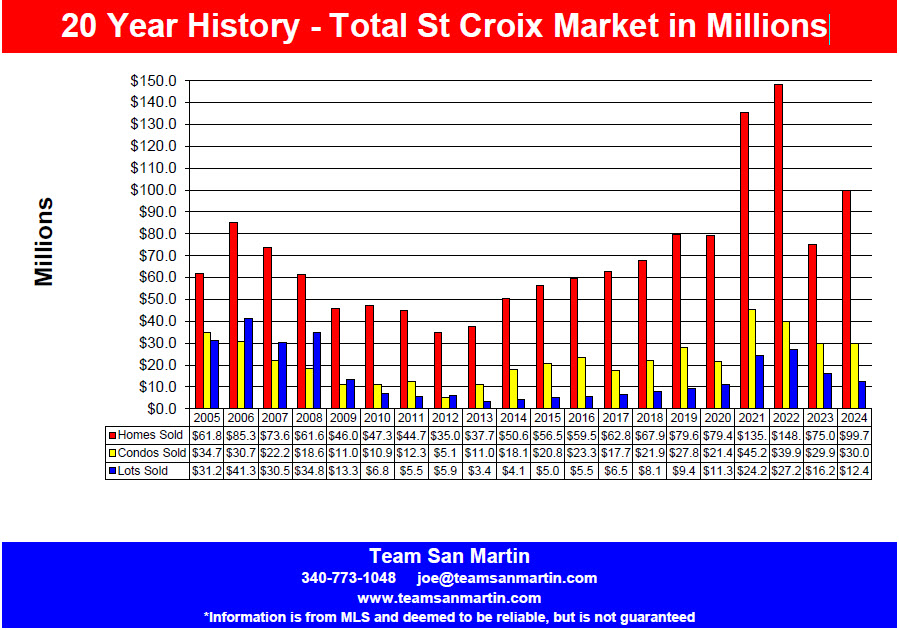
This measurement is a combination of total homes sold multiplied by average sales price; it gives the best overview of annual market performance.
During this 20-year period, the total St Thomasresidential market exceeded the total St Croix market during eight years: 2008, 2012, 2013, 2014, 2015, 2018, 2023, and 2025.
During 2025, the total St Thomasresidential market ($102.4 Million) exceeded the total St Croix residential market ($99.7 Million) by $2.7 Million.

Information is from MLS and deemed to be reliable but is not guaranteed.
Prepared by:
Julie San Martin Team Manager
The St Croix Real Estate Cycle
A 20 Year Look
2025St Croix real estate sales were mixed.
Total Number of Properties Sold
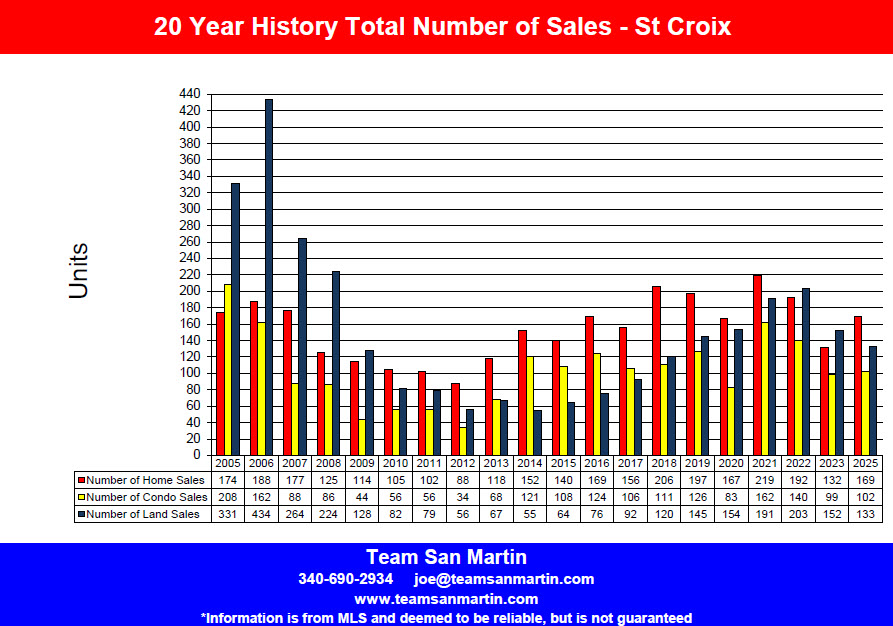
The number of homes sold on St Croix during 2025 (155) is 14 fewer homes sold than the previous year (169) and 33fewer than 20 years ago (188).
There were 117 condominium sales on St Croix during 2025, 15 more than the previous year (102) and 45 fewer than twenty years ago (162).
There were 119lot sales in 2025. This is 14 fewer than the previous year (133) and 315 fewer than 20 years ago (434).
Average Sales Price
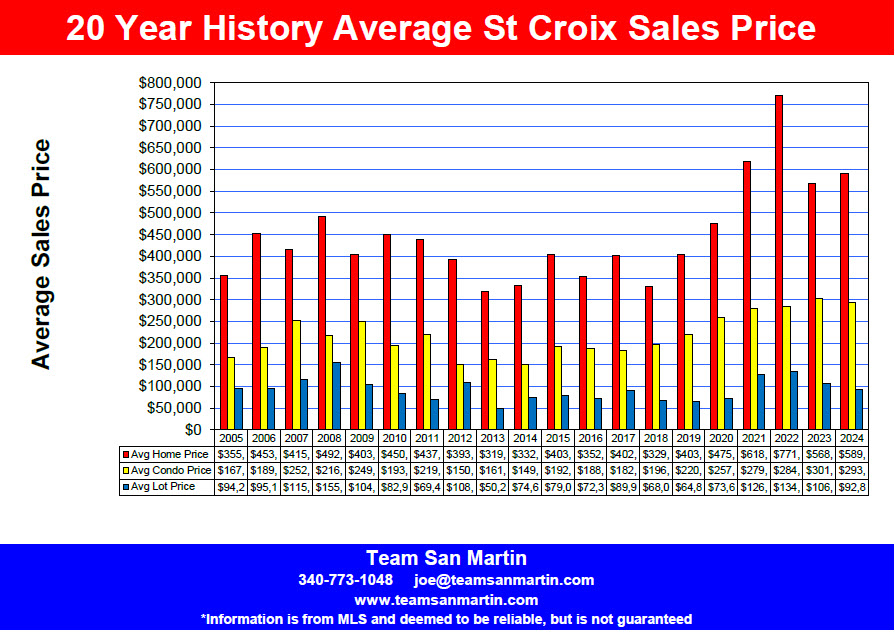
At $643,330, the average 2025 home sales price was exceeded only by the 2022 average home sales price ($771,242).
The 2025average condominium salesprice ($296,505) is exceeded only by the 2023 average sales price ($301,649), also the highest average sales price of the entire 20-year period. The average 2025 sales price is $107,136 higher than 20 years ago ($189,369).
The average 2025 lot sales price ($242,069) is $159,211 higher than the previous year’s average lot sale price ($92,858); the large discrepancy is due to the VI Government $17 Million purchase of land in northwest St Croix. The average 2025 lot sales price is $146,893 higher than 20 years ago ($95,176).
Total Market in Millions of Dollars
The 2025total residential market ($99.7 million) is 67% of the 2022 record setting market of $148.1 million. Only 2 years during this 20-year period exceeded the 2025figure: 2021 ($135.5 million) and 2022.
The 2025 total condominium market ($34.7 million)exceeded 2024 by $4.7 Million. Only 2 years during this 20-year period exceed 2024: 2021 ($45.2 million), and 2022 ($39.9 million).
The 2025total land market ($28.8million) is $16.4 million higher than the previous year ($12.4 million) and $12.5 million lower than 20 years ago ($41.3 million).
Information is from MLS and deemed to be reliable but is not guaranteed.
Prepared by:
Julie San Martin
Team Manager
January2026
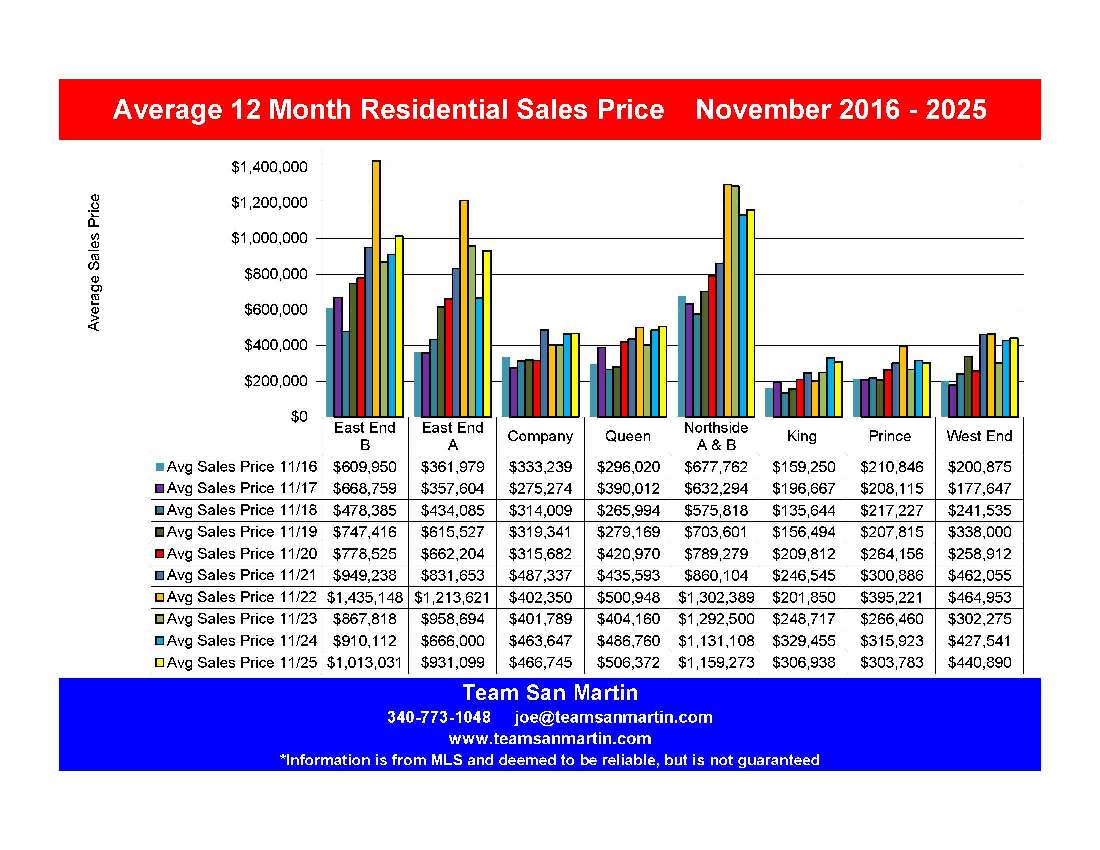
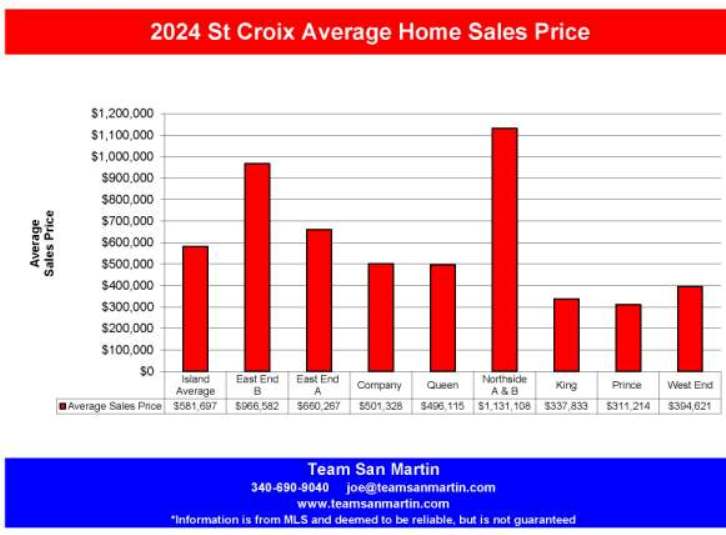
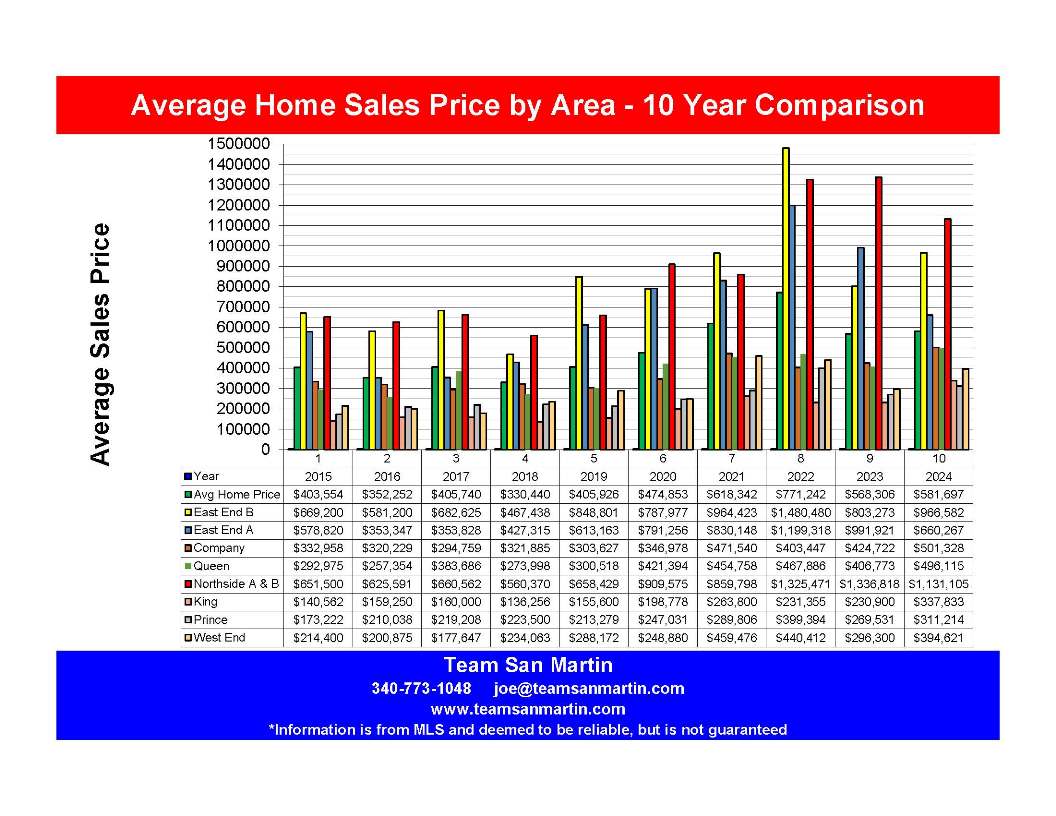
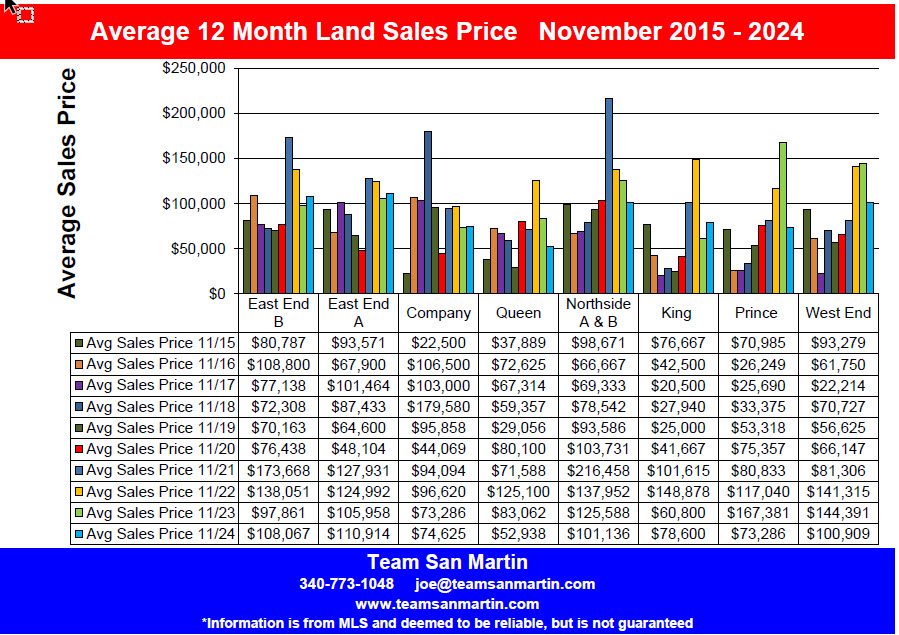
10 Year St Croix Home Sales Price Trends
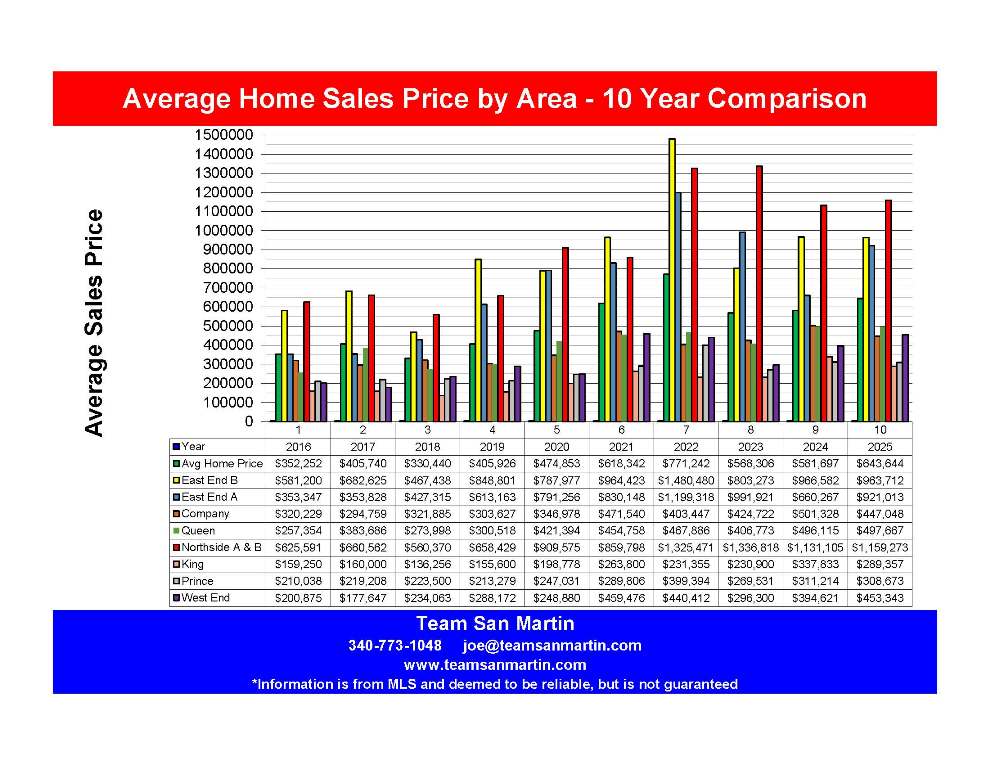
The average sales price of a home on St Croix increased $291,392 over the
10-year period; this is a 83% increase.
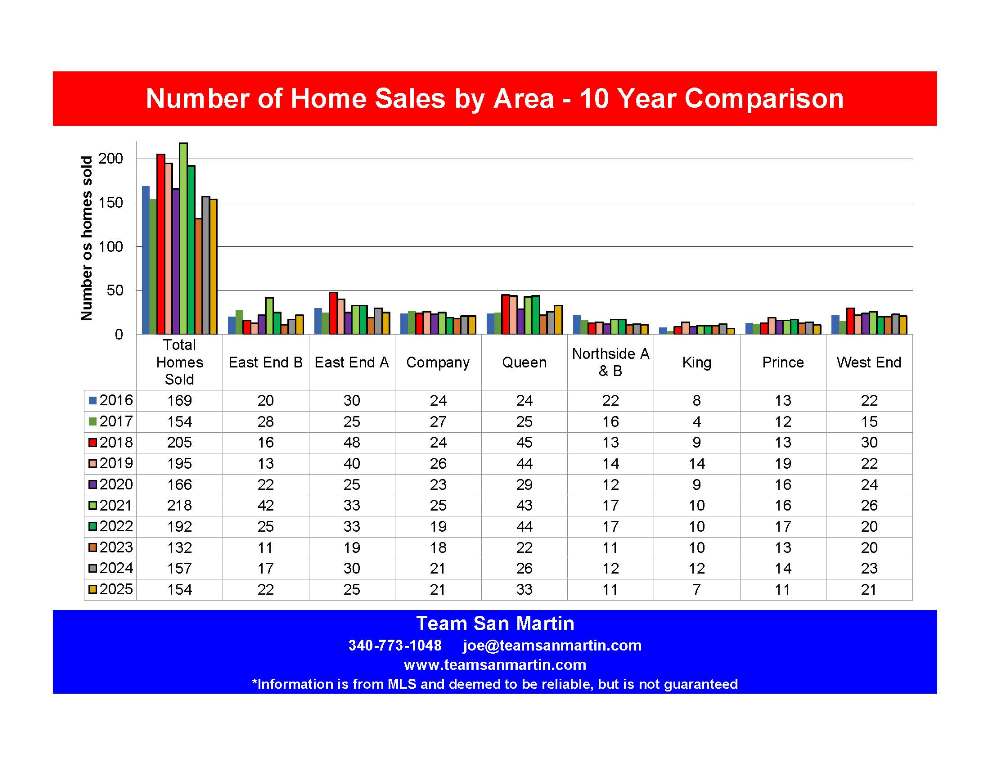
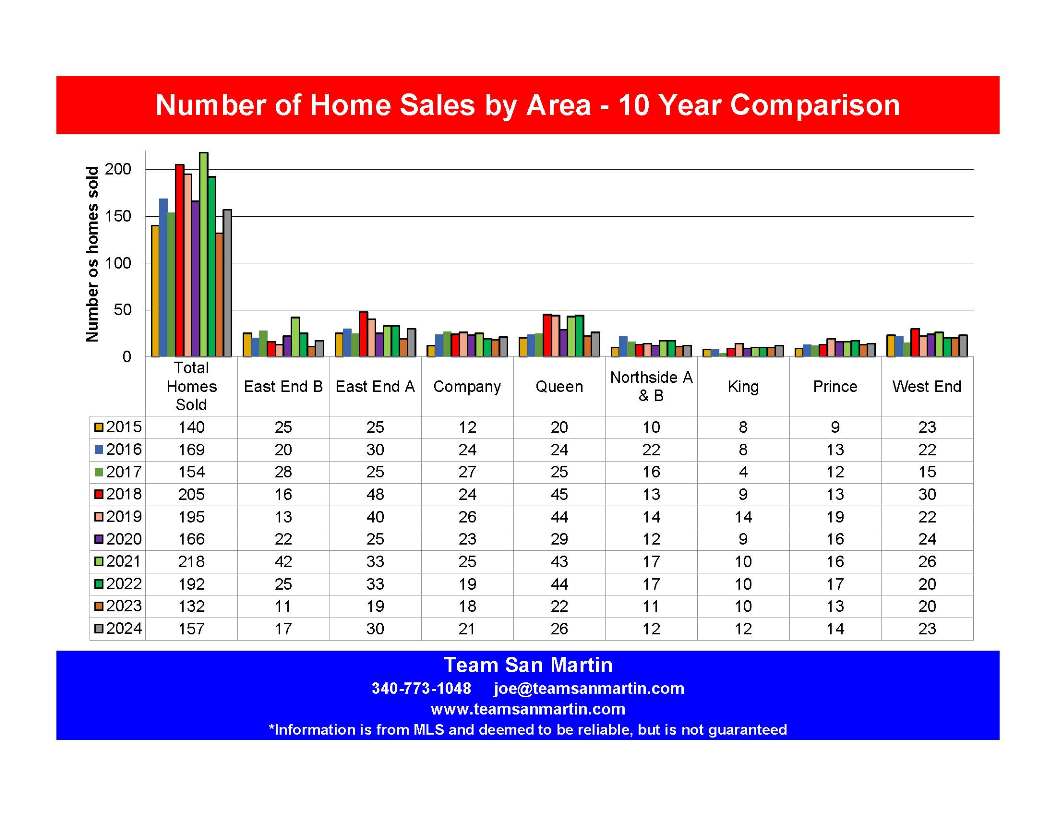
Total number of homes sold annually decreased 9% (15 homes) since 2016.
All areas of the island did not perform the same.
East End B
Far East End
Compared to 9 years ago, the average sales price of a home increased 66% ($382,512 increase).
The number of homes sold in a year increased by 2 homes, compared to 9 years ago.
20homes sold in 2016, 22homes sold in 2025.
East End A
Christiansted East to Coakley Bay
Compared to 9 years ago, the average sales price of a home increased 161%
($567,666increase).
The number of homes sold in a year decreased by 5 homes, compared to 9 years ago;
30 homes sold in 2016, 25 homes sold in 2025
Company
Christiansted West to the East Side of Judiths Fancy
Compared to 9 years ago, the average sales price of a home increased 40% ($126,819 increase).
The number of homes sold in a year decreased by 3 homes
, compared to 9 years ago,from 24home sales in 2016 to 21 home sales in 2025.
Queen
Constitution Hill West to La Reine, includes southwest
Judiths Fancy
Compared to 9 years ago, the average sales price of a home increased 93%
($240,313 increase).
The number of homes sold in a year increased by 9 homes, compared to 9 years ago, from 24homes sold in 2016 to 33 home sales in 2025.
Northside A & B
North Shore from North Judiths Fancy to Hamms Bluff
Compared to 9 years ago, the average sales price of a home increased 85% ($533,682increase).
The number of homes sold in a year decreased by 11 homes (50%), compared to 9 years ago.
22homesalesclosed in 2016, 11 home sales closed in 2025.
King
South Shore from La Reine West to UVI
Compared to 9 years ago, the average sales price of a home increased 82%
($130,107 increase).
The number of homes sold in a year decreased by 1 home, compared to 9 years ago, from 8 homes sold in 2016 to 7 home sales in 2025.
Prince
South Shore from UVI West to Williams Delight
Compared to 9 years ago, the average sales price of a home increased 47%
($98,635increase).
The number of homes sold in a year decreased by 2 homes,compared to 9 years ago, from 13 homes sold in 2016 to 11 home sales in 2025.
West End
South Shore, South from Mahogany Road,
East to Williams Delight
Compared to 9 years ago, the average sales price of a home increased 126%
($252,468increase).
The number of homes sold in a year decreased by 1 home, compared to 9 years ago, with 22 homes sales in 2016and 21 homes sales in 2025.
Observations
Average home sales prices in three areas of the island consistently exceed the
island wide "average" home sales price:
Average home sales prices are consistently much lower than the island wide "average" home sales price:
Fewer homes sold in all quarters during 2025, when compared to 2016 except for:
Compared to 2024, the island wide average home sale price increased 11%.
All quarters experienced increased average sales prices except for:
Information is from MLS and deemed to be reliable but is not guaranteed.
Prepared by:
Julie San Martin
Team Manager
December2025
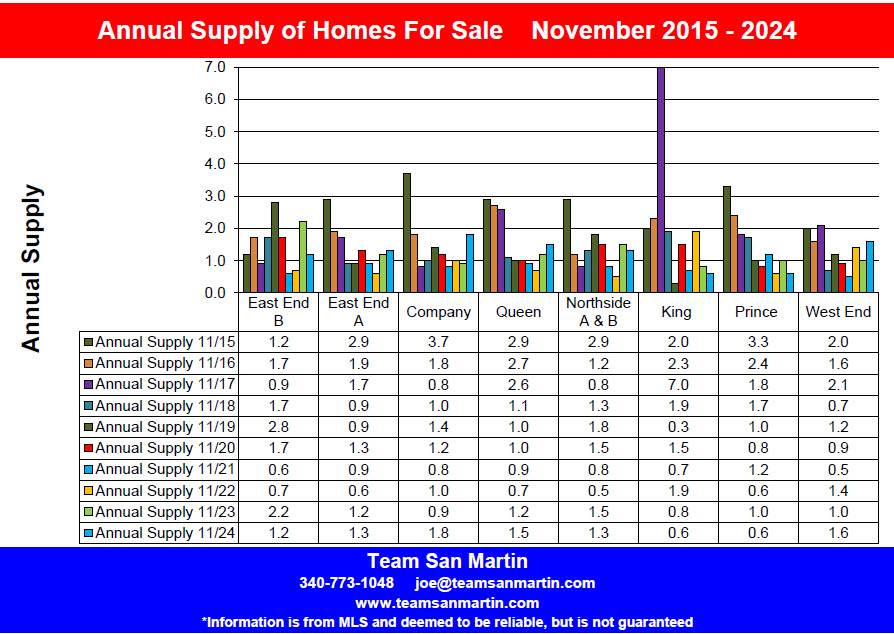
Ten Year Inventory Level Trends
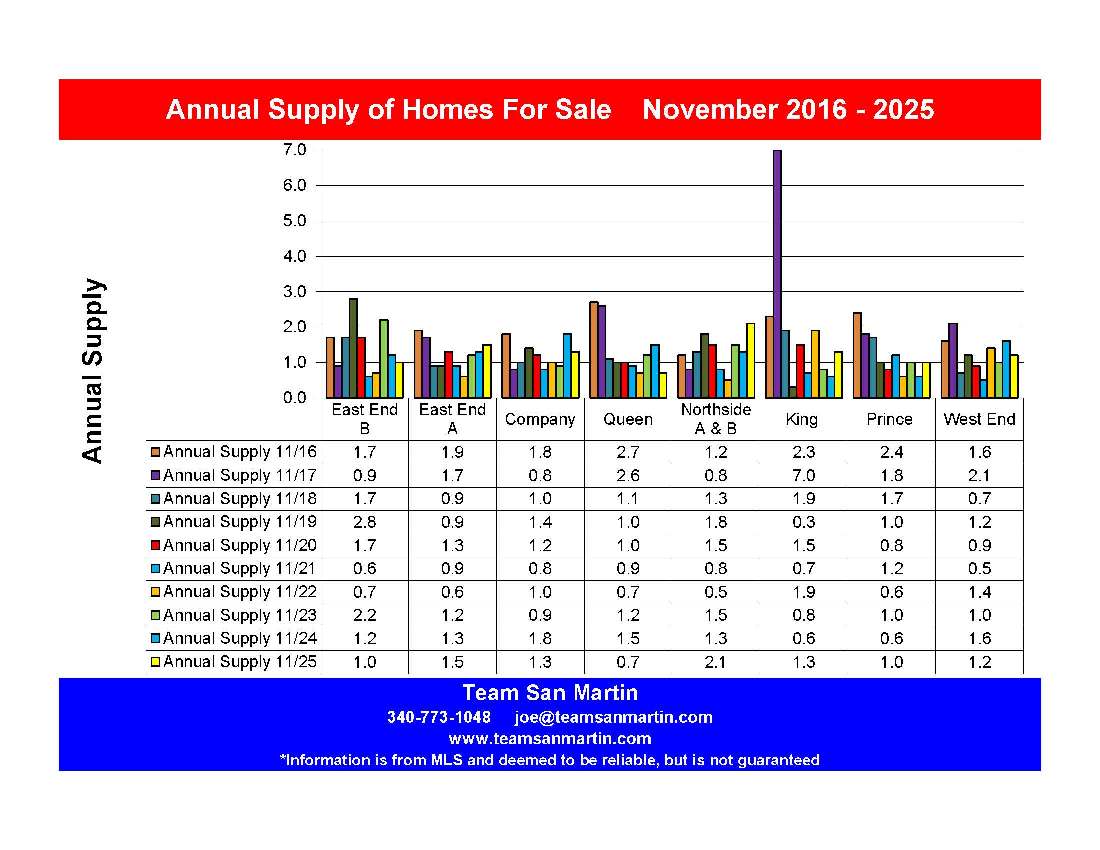
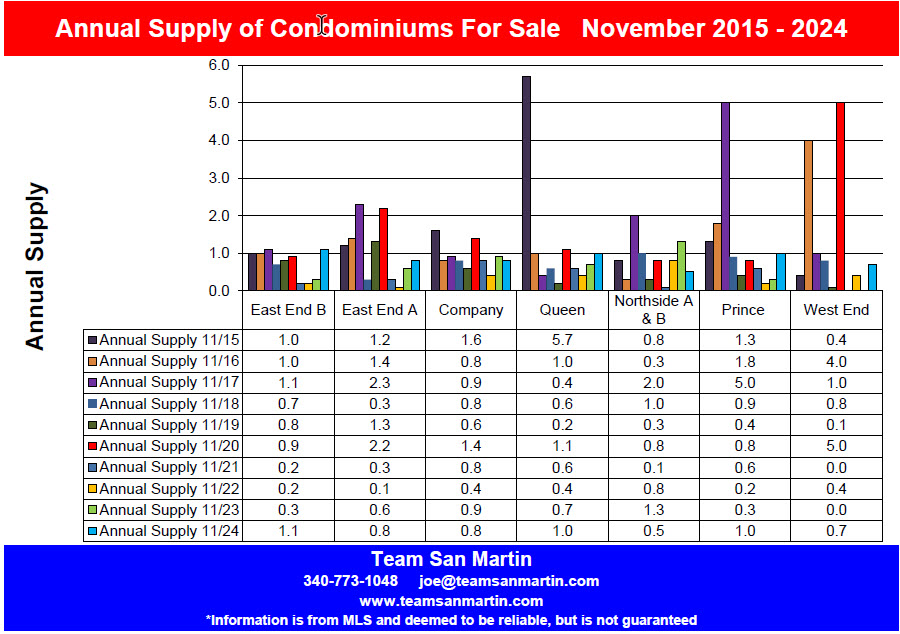
Current Annual supply represents the number of years it will take at the current rate of sales to sell all the properties listed in a specific area (Quarter) of St Croix.
[Active Listings + Pending Listings] /
Number of Listings Sold During the Previous 12 Months
For example:
In November 2025, there were 21 active and 2 pending home sales in East End B, with 22 home sales in the previous 12 months, for a 1.0-year supply of homes for sale
[21 + 2] / 22 = 1.0 Years
East End B
Far East End
Residential
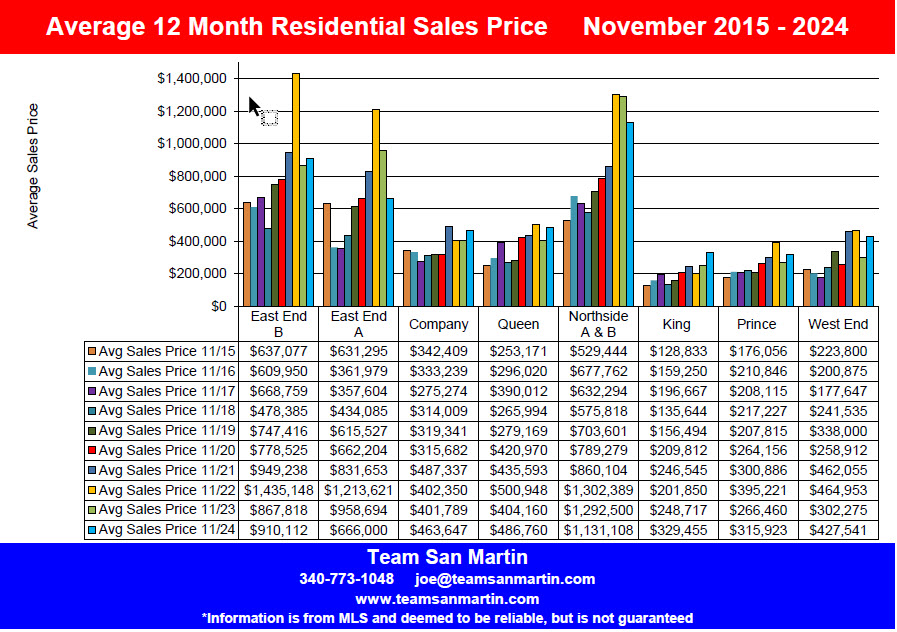
Compared to 9 years ago, home inventory has decreased by 8 months;average sales price increased 66%; from $609,950to $
1,013,031.Compared to last year, average time on the market decreased by 2 months.
average sales price increased 11% (from $910,112 to $1,013,031)
Condominium
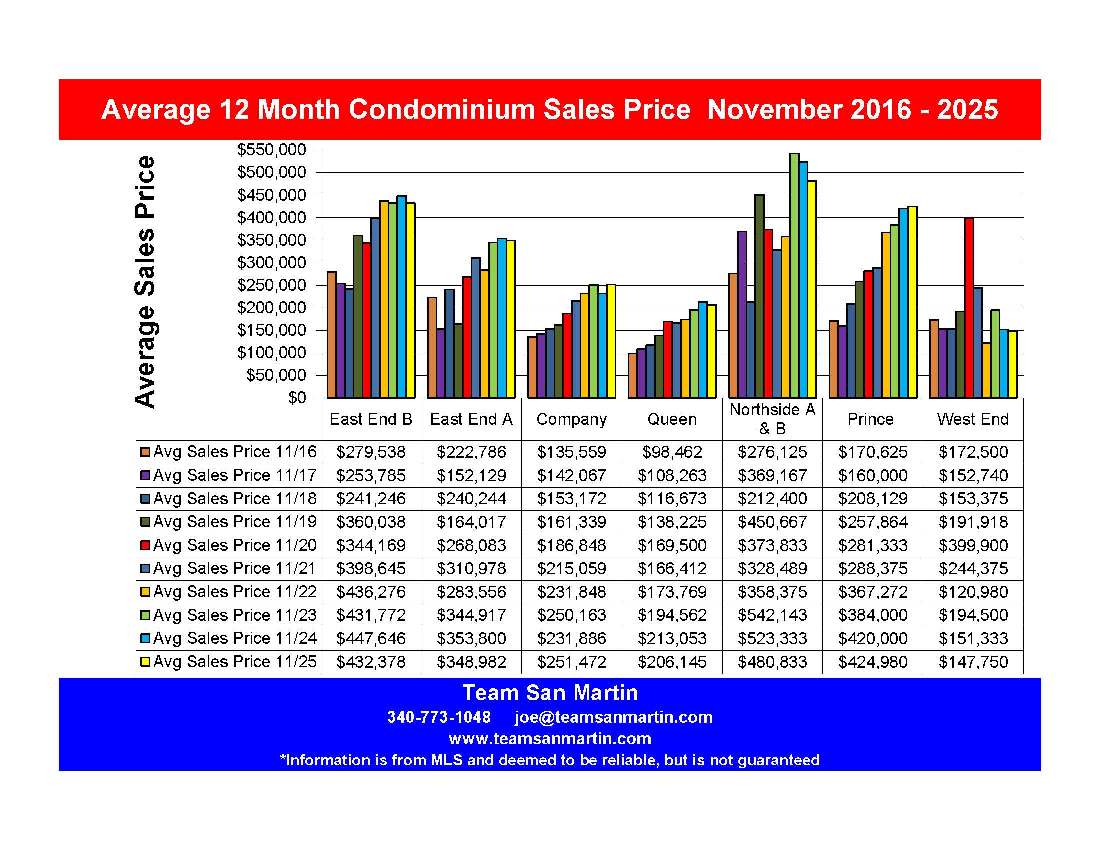
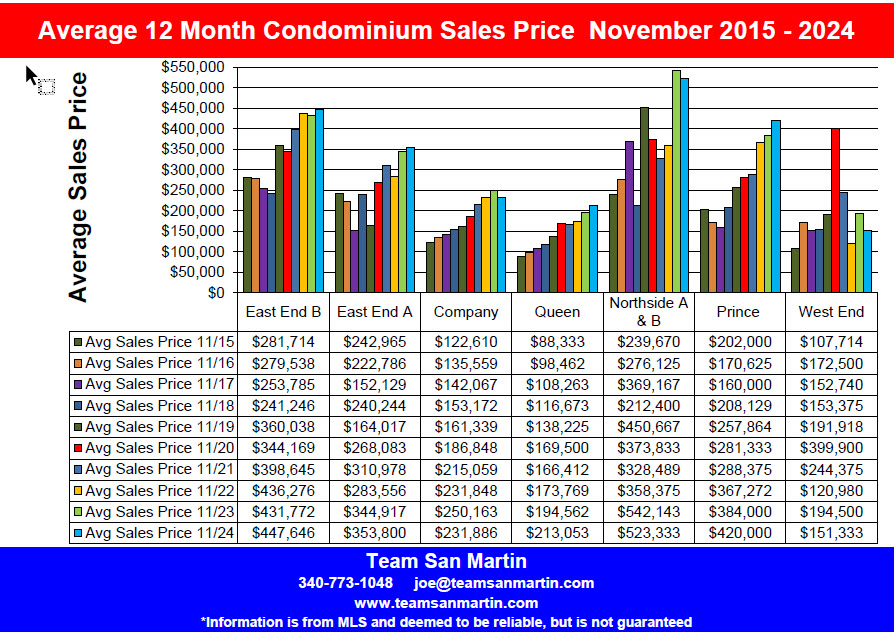
Compared to 9 years ago, condominium inventory increased by 2 months; average sales price increased 55%, from $279,538to $432,378.
Compared to last year,average time on the market increased by 1 month.
average sales price decreased 3%(from $447,646 to $432,378)
Vacant Land
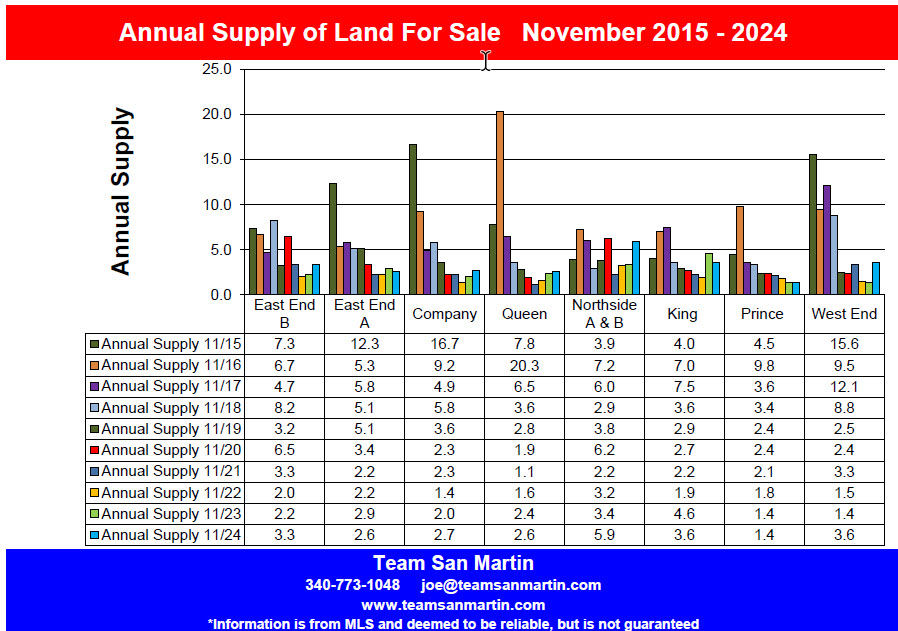
Compared to 9 years ago, land inventory decreased by 5 months.
average sales price increased 16%(from $108,800to $126,075)
Compared to last year, land inventory increased by 3 years, from 3.3 to 6.3 years.
average sales price increased 170% (from $108,067 to $126,075)
East End A
Christiansted East to Coakley Bay
Residential
Compared to 9 years ago, home inventory decreased by 5 months.
average home sale price increased 157%,from $361,979to $931,099.
Compared to last year, residential inventory increased by about 2months.
average sales price increased 40%(from $666,000 to $931,099)
Condominium
Compared to 9 years ago, condominium inventorydecreased by 6months.
average condominium sales price increased57%(from $222,786to $348,982)
Compared to last year, condominium inventory increased by 1month.
average sales price decreased 3%(from $353,800 to $348,982)
Vacant Land
Compared to 9 years ago, land inventory increased by 7months.
average lot sales price increased 39%, from $67,900to $94,423)
Compared to last year, land inventory increased by 3.3 years, from 2.6 to 5.9 years;
average lot sales price decreased 15% (from $110,914 to $94,423)
Company
Christiansted West to the East Side of Judiths Fancy
Residential
Compared to 9 years ago, residential inventory decreasedby 6 months.
average home sales priceincreased 40% (from $333,239 to $466,745)
Compared to last year, residential inventory decreased by 6months.
average home sales price increased 1% (from$463,647 to $466,745)
Condominium
Compared to 9 years ago, condominium inventory increased by 5months.
average sales price increased 86% (from $135,559to $251,472)
Compared to last year, condominium inventory increased by 5months.
average condo sales price increased8% (from $231,886 to $251,472)
Vacant Land
Compared to 9 years ago, lot inventory decreased by 6.7 years, from 9.2 to 2.5years.
average lot sales price decreased 34%, from $106,500 to $69,886.
Compared to last year, land inventory decreased by 13 months.
average sales pricedecreased 3%,from $74,625 to $69,886.
Queen
Constitution Hill West to La Reine, includes southwest
Judiths Fancy
Residential
Compared to 9 years ago, residential inventory decreased by 2years.
average sales priced increased 71% (from $296,020to $506,372)
Compared to last year, residential inventory decreased by 10months.
average sales price increased 4% (from $486,760 to $506,372)
Condominium
Compared to 9 years ago, condominium inventory decreased by 2 months.
average condominium sales price increased109% (from $98,462to $206,145)
Compared to last year, condominium inventory decreased by 2months.
average sales price decreased 3% (from $213,053 to $206,145)
Vacant Land
Compared to 9 years ago, land inventory decreased by 18.8 years,
from 20.3 years to1.5 years);
average lot sales price increased 8%, from $72,625to $78,477.
Compared to last year, land inventory decreased by 13months.
average lot sales price increased 48%,from $52,938 to $78,477.
Northside A & B
North Shore from North Judiths Fancy to Hamms Bluff
Residential
Compared to 9 years ago, residential inventory increased by 11 months.
average home sales price increased71%(from $677,762to $1,159,273)
Compared to last year, residential inventory increased by 10months.
average home sales price increased 2%(from $1,131,108 to $1,159,273)
Condominium
Compared to 9 years ago, condominium inventory increased by 8months.
average sales price increased 74% (from $276,125to $480,833)
Compared to last year, condominium inventory increased by 6months.
average condo sales price decreased 8%,from $523,333 to $480,833.
Vacant Land
Compared to 9 years ago, land inventory decreased by 3.4 years,
from 7.2 years to3.8years.
average lot sales price increased 1388%,from $66,667to $991,900*
* $17.5 Million sale to VI Government has skewed statistics.
Compared to last year, land inventory decreased by 2.1years.
average lot sales price increased 881%,from $101,136 to $991,900.*
King
South Shore from La Reine West to UVI
Residential
Compared to 9 years ago, residential inventory decreased by 1year.
average home sales price increased93% (from $159,250to $306,938)
Compared to last year, residential inventory increased by 8months.
average residential sales price decreased 7% (from $329,455 to $306,938)
Condominium
There are no condominium complexes in King Quarter
Vacant Land
Compared to 9 years ago, land inventory decreased by 5 years,
from 7 years to 2years.
average lot sales price increased 436%, from $42,500 to $227,800)
Compared to last year, land inventory decreased by 1.6years.
average lot sales price increased 190%,from $78,600 to $227,800.
Prince
South Shore from UVI West to Williams Delight
Residential
Compared to 9 years ago, residential inventory decreased by 1.7years.
average residential sales price increased 44% (from $210,846to $303,783)
Compared to last year, residential inventory increased by 5months.
average residential sales price decreased 4% (from $315,923 to $303,783)
Condominium
Compared to 9 years ago, condominium inventory decreased by 1.4 years.
Average condominium sales price increased 149% (from $170,625 to $424,980).
Compared to last year, condominium inventory decreased by 7 months.
average condominium sale price increased 19% (from $420,000 to $424,980)
Vacant Land
Compared to 9 years ago, land inventory decreased by
7.5 years, from 9.8 years to2.3years.
average lot sales price increased 210%, from $26,249to $81,467)
Compared to last year, land inventory increased by 11 months.
average lot sales price increased 11%,from $73,286 to $81,467.
West End
South Shore, South from Mahogany Road,
East to Williams Delight
Residential
Compared to 9 years ago, residential inventory decreased by 5 months.
average home sale price increased 119%, from $200,875to $440,890.
Compared to last year, residential inventory decreased by 5months.
average home sale price increased 3% (from $427,541 to $440,890)
Condominium
Compared to 9 years ago, condominium inventory decreased by 2.5 years.
average condominium sales price decreased 14% (from $172,500 to $147,750)
Compared to last year, condominium inventory increased by 10 months.
average condominium sales price decreased 2%, from $151,333 to $147,750.
Vacant Land
Compared to 9 years ago, land inventory decreased by 5.1 years,
from 9.5 years to4.4years.
average lot sales price increased 53%, from $61,750to $94,750.
Compared to last year, land inventory increased by10 months.
average lot sales price decreased 6%, from $100,909 to $94,750.

Information is from MLS and deemed to be reliable but is not guaranteed.
Prepared by:
Julie San Martin
Team Manager
November 2025
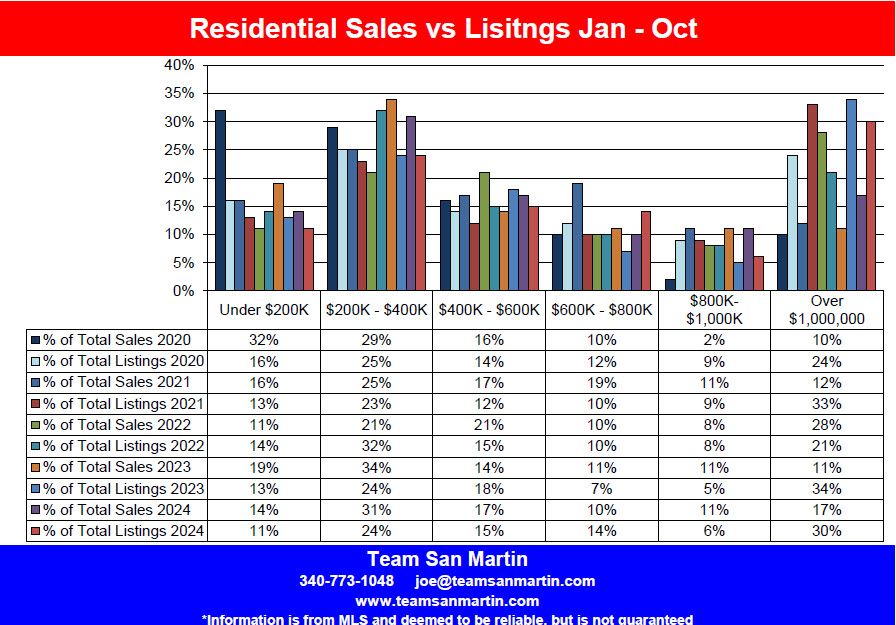
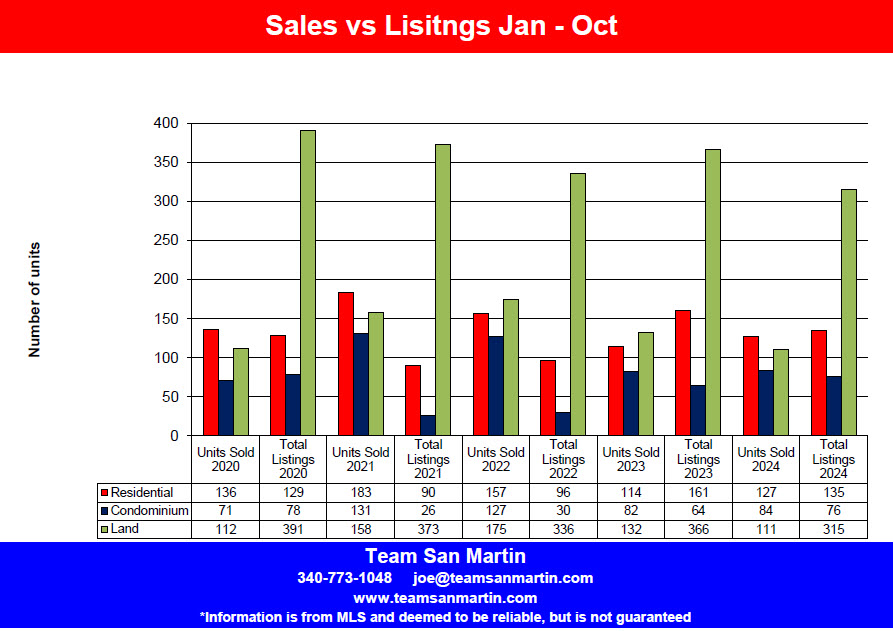
Which St Croix Price Ranges are Selling?
First 10 months of 2021 through 2025
Residential
2021
183 home sales closed January through October; there were 90 homes for sale
2.03 buyers for every seller
2022
157 home sales closed January through October; there were 96 homes for sale
1.64 buyers for every seller
114 home sales closed January through October; there were 123 homes for sale
0.93 buyers for every seller
2024
127 home sales closed January through October; there were 135 homes for sale
0.94 buyers for every seller
2025
132 home sales closed January through October; there were 154 homes for sale
0.86 buyers for every seller
Condominium
2021
131 condominium sales closed January - October; there were 26 condos for sale
5.04 buyers for every seller
2022
127 condominium sales closed January - October; there were 30 condos for sale
4.23 buyers for every seller
2023
82 condominium sales closed January - October; there were 49 condos for sale
1.67 buyers for every seller
2024
84 condominium sales closed January - October; there were 76 condos for sale
1.11 buyers for every seller
2025
95 condominium sales closed January - October; there were 99 condos for sale
0.96 buyers for every seller
Vacant Land
2021
158 land sales closed January through October; there were 373 lots for sale
0.42 buyers for every seller
2022
175 land sales closed January through October; there were 336 lots for sale
0.52 buyers for every seller
132 land sales closed January through October; there were 332 lots for sale
0.40 buyers for every seller
2024
111 land sales closed January through October; there were 315 lots for sale
0.35 buyers for every seller
2024
103 land sales closed January through October; there were 366 lots for sale
0.28 buyers for every seller
SALES BY PRICE RANGE
Residential
|
2025 % of Sales |
2025 Sales |
2024 % of Sales |
2024 Sales |
2023 % of Sales |
2023 Sales |
2022 % of Sales |
2022 Sales |
2021 % of Sales |
2021 Sales |
Sales Price |
|
%17 |
22 |
%14 |
18 |
%19 |
22 |
%11 |
18 |
%16 |
30 |
Under $200K |
|
%30 |
40 |
%31 |
39 |
%34 |
39 |
%25 |
33 |
%25 |
45 |
$200K - $400K |
|
%13 |
17 |
%17 |
21 |
%14 |
16 |
%21 |
33 |
%17 |
31 |
$400K - $600K |
|
%12
|
16 |
%10 |
13 |
%11 |
13 |
%10 |
16 |
%19 |
34 |
$600K - $800K |
|
%11 |
14 |
%11 |
14 |
%11 |
12 |
%8 |
13 |
%11 |
21 |
$800K - $1 Million |
|
%17 |
23 |
%17 |
22 |
%11 |
12 |
%28 |
44 |
%12 |
22 |
Over $1 Million |
Condominium
|
2025 % of Sales |
2025 Sales |
2024 % of Sales |
2024 Sales |
2023 % of Sales |
2023 Sales |
2022 % of Sales |
2022 Sales |
2021 % of Sales |
2021 Sales |
Sales Price |
|
%5 |
5 |
%10 |
8 |
%2 |
2 |
%6 |
8 |
%2 |
2 |
Under $100K |
|
%25 |
24 |
%15 |
13 |
%28 |
23 |
%23 |
29 |
%27 |
36 |
$100K - $200K |
|
%20 |
19 |
%27 |
23 |
%29 |
24 |
%31 |
40 |
%33 |
43 |
$200K - $300K |
|
%37 |
35 |
%38 |
32 |
%32 |
26 |
%35 |
45 |
%31 |
41 |
$300K - $500K |
|
%13 |
12 |
%10 |
8 |
%9 |
7 |
%4 |
5 |
%7 |
9 |
Over $500K |
Vacant Land
|
2025 % of Sales |
2025 Sales |
2024 % of Sales |
2024 Sales |
2023 % of Sales |
2023 Sales |
2022 % of Sales |
2022 Sales |
2021 % of Sales |
2021 Sales |
Sales Price |
|
%44 |
45 |
%35 |
39 |
%43 |
57 |
%39 |
68 |
%41 |
65 |
Under $50K |
|
%33 |
34 |
%36 |
40 |
%31 |
41 |
%30 |
53 |
%32 |
50 |
$50K - $100K |
|
%18 |
19 |
%23 |
25 |
%22 |
29 |
%23 |
41 |
%23 |
36 |
$100K - $300K |
|
%5 |
5 |
%6 |
7 |
%4 |
5 |
%7 |
13 |
%4 |
7 |
Over $300K |
Information is from MLS and deemed to be reliable but is not guaranteed.
Prepared by:
Julie San Martin
Team Manager
October 2025
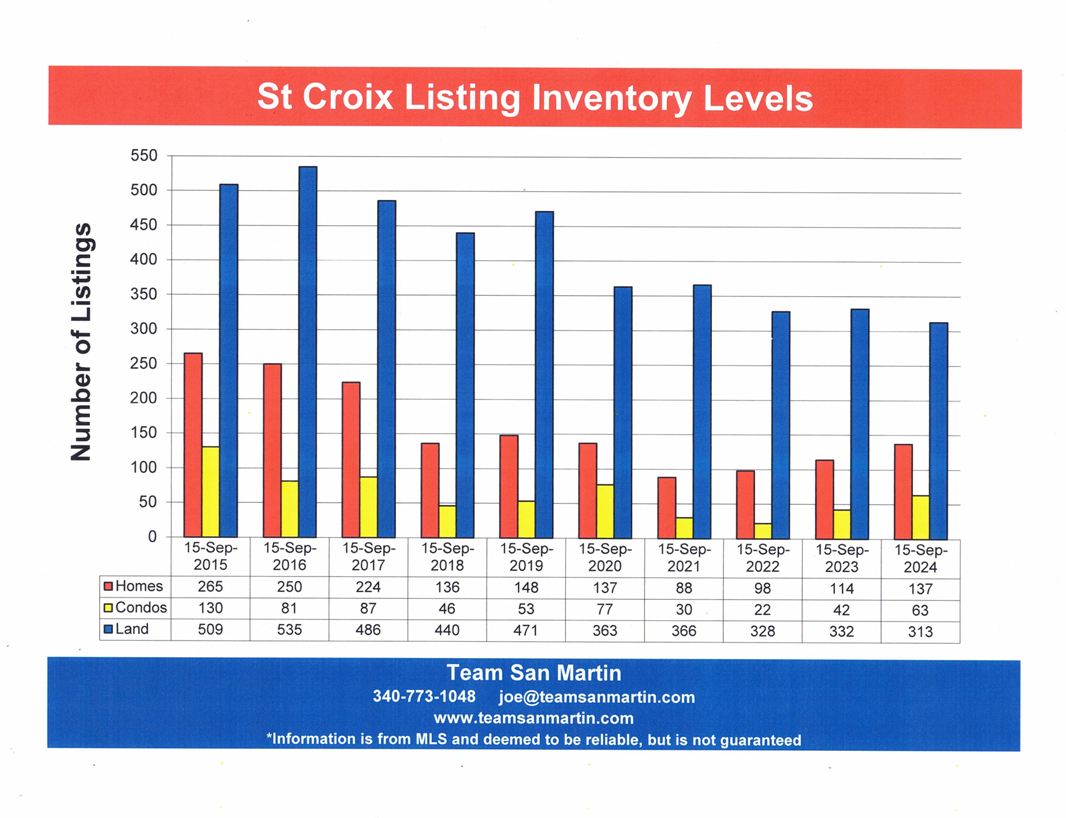
Ten Year Comparison
St Croix Real Estate Inventory Levels
TOTAL INVENTORY
Residential
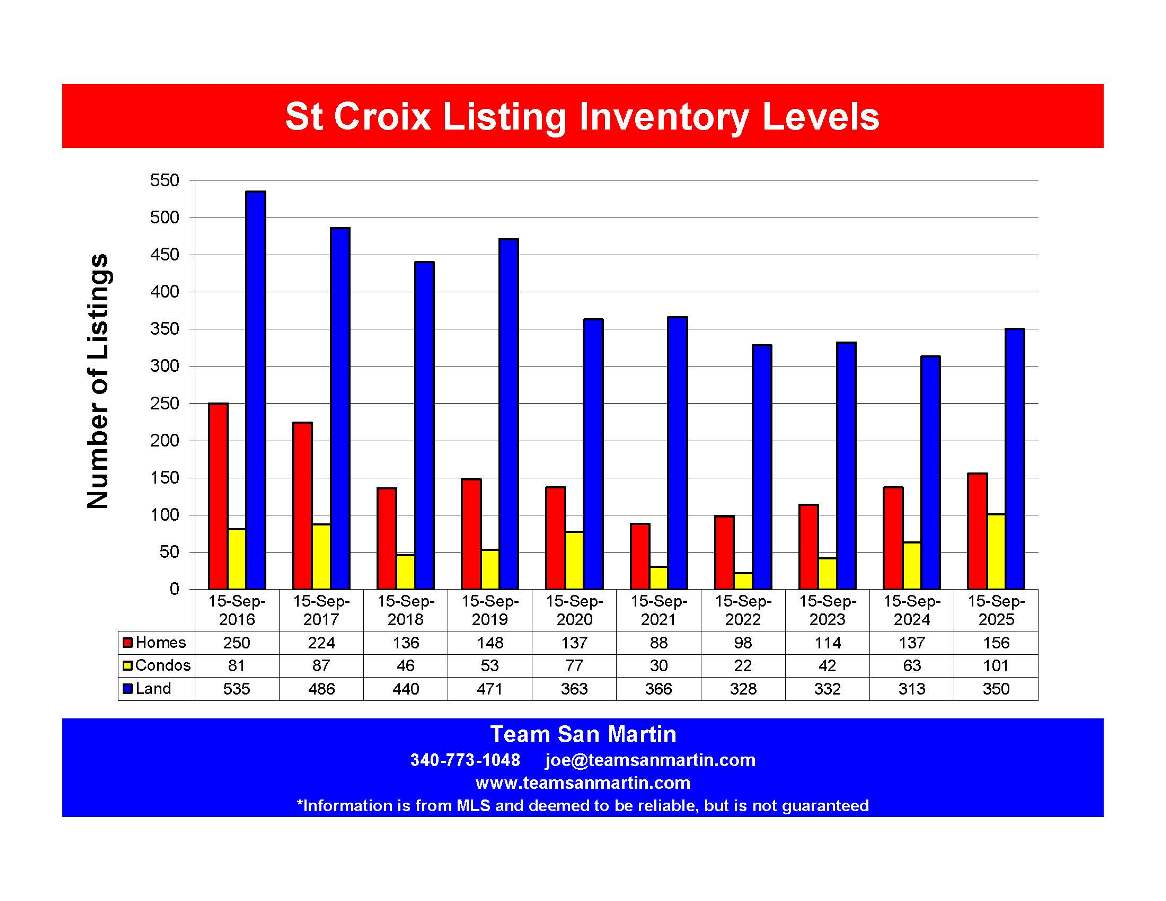
38% fewer homes (94) than ten years ago.
The highest inventory during this period was 9/15/16 with 250 homes on the market.
Lowest inventory during this period was 9/15/21 with only
88 homes for sale.
Condominium
25% more condominiums (20) than ten years ago.
The highest inventory during this period was 9/15/25, with 101 condominiums for sale.
The lowest inventory during this period was 9/15/22 with only 22 condos for sale.
Vacant Land
40% fewer lots (186) than ten years ago.
The highest inventory during this period was 9/15/16 with 535 lots on the market.
9/15/2024 is the lowest inventory of the ten-year period with only.
313 lots for sale.
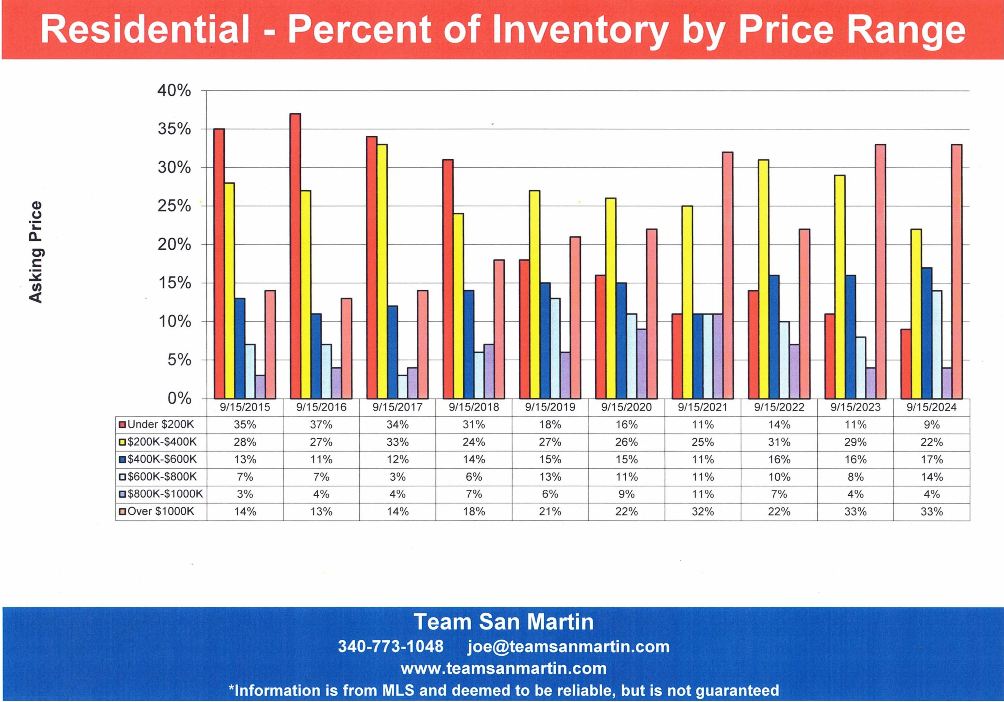
INVENTORY BY PRICE RANGE
Residential
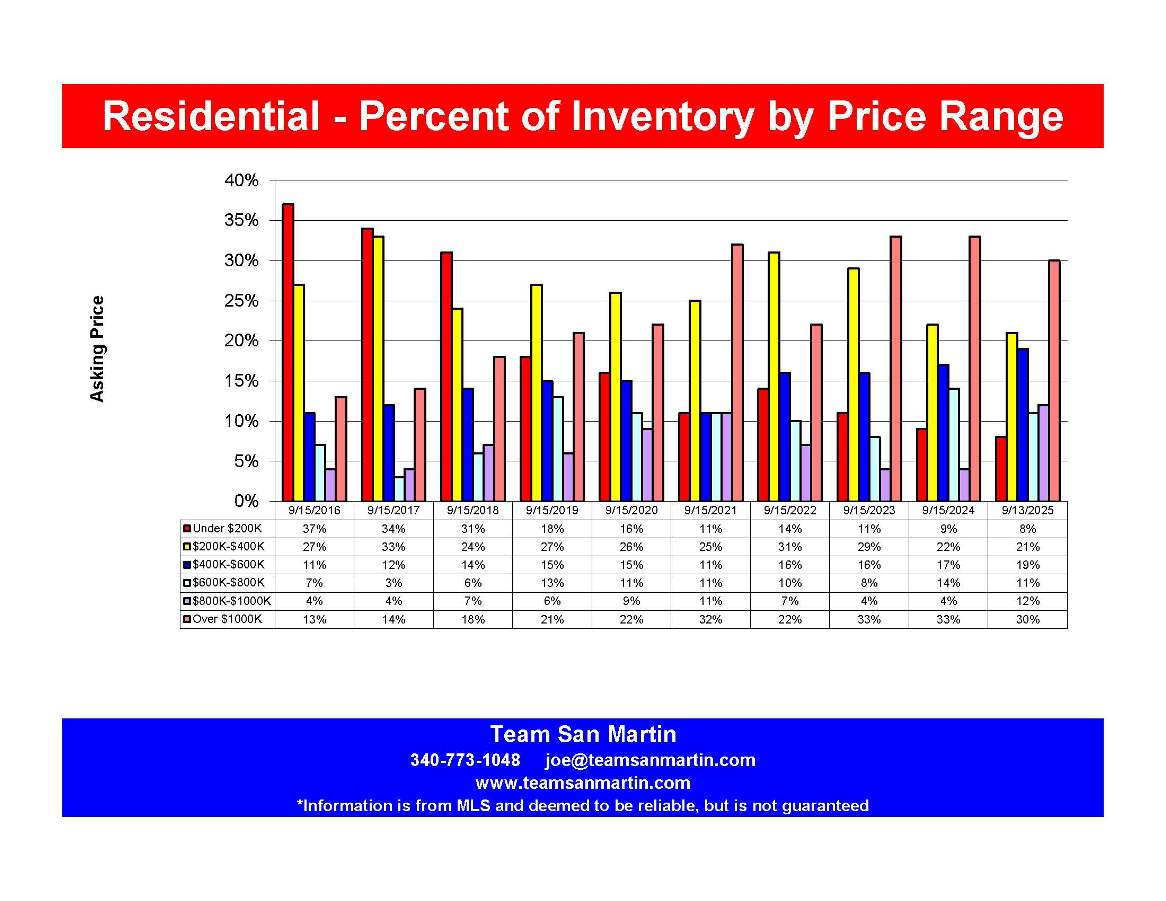
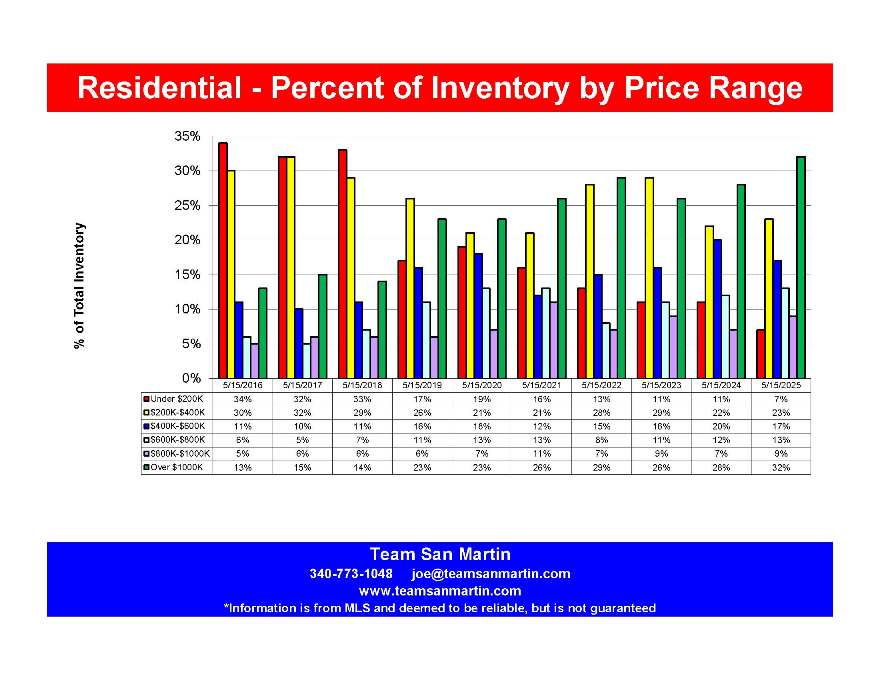
Under $200,000 listings (8%) are 29% lower than ten years ago as percentage of total inventory. Compared to last year, this segment decreased by 1%.
$200,000 to $400,000 listings (21%) have remained relatively constant over the 10-year period, varying from 33% of inventory (9/15/17) to 21% of inventory (9/15/25).
$400,000 to $600 listings (19%) are 8% higher compared to 10 years ago and the highest for this price range. Lowest was 11% (9/15/16 & 9/15/21).
$600,000 to $800,000 listings (11%) are 4% higher than ten years ago (11%). The highest for this price range was 14% (9/15/24), the lowest was 3% (9/15/17).
$800,000 to $1,000,000 listings (12%) are triple the number of ten years ago (4%). The highest percentage of the 10-year period was 12% (9/15/25), the lowest 4% (4 of the 10 years).
Listings over $1,000,000 (30%) have more than doubled over the 10-year period. The lowest level was 9/15/16, at just 13% of total inventory, highest was 33% (9/15/23 & 9/15/24).
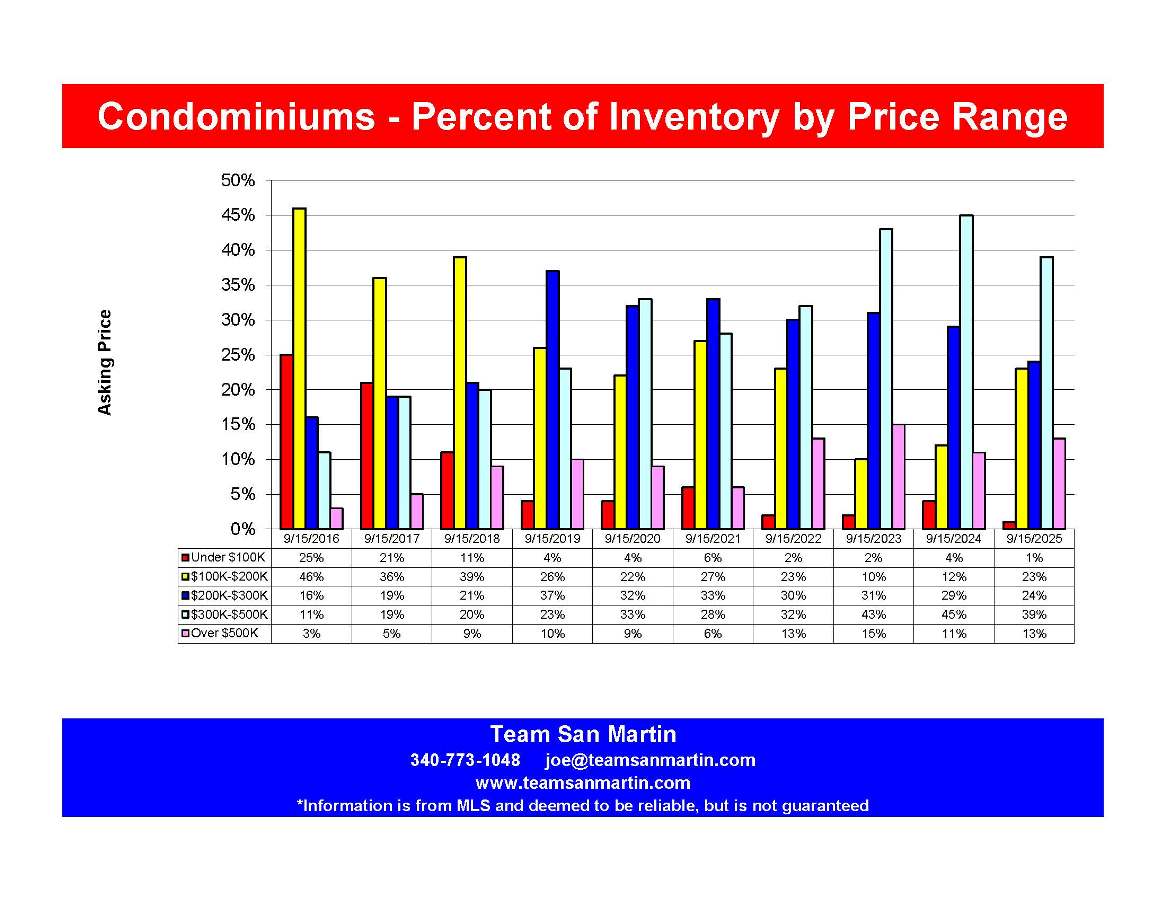
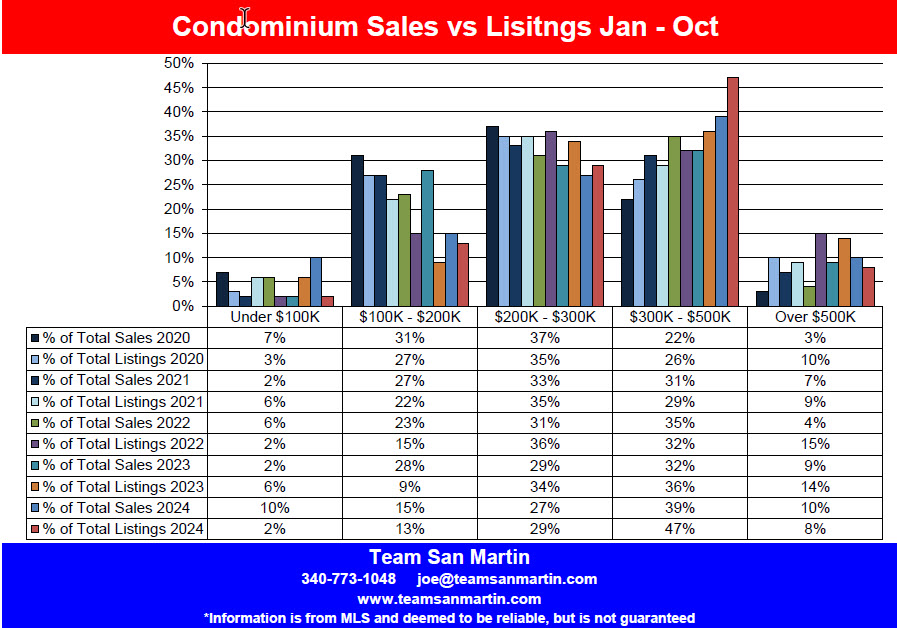
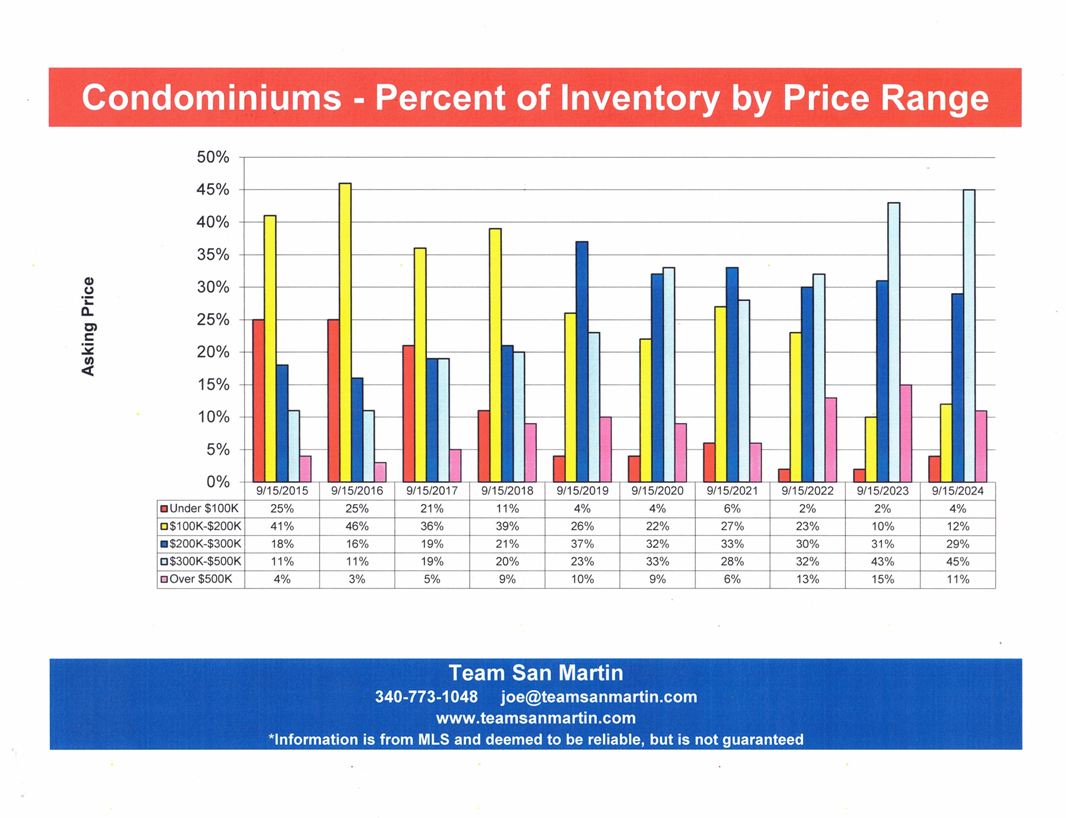
Condominium
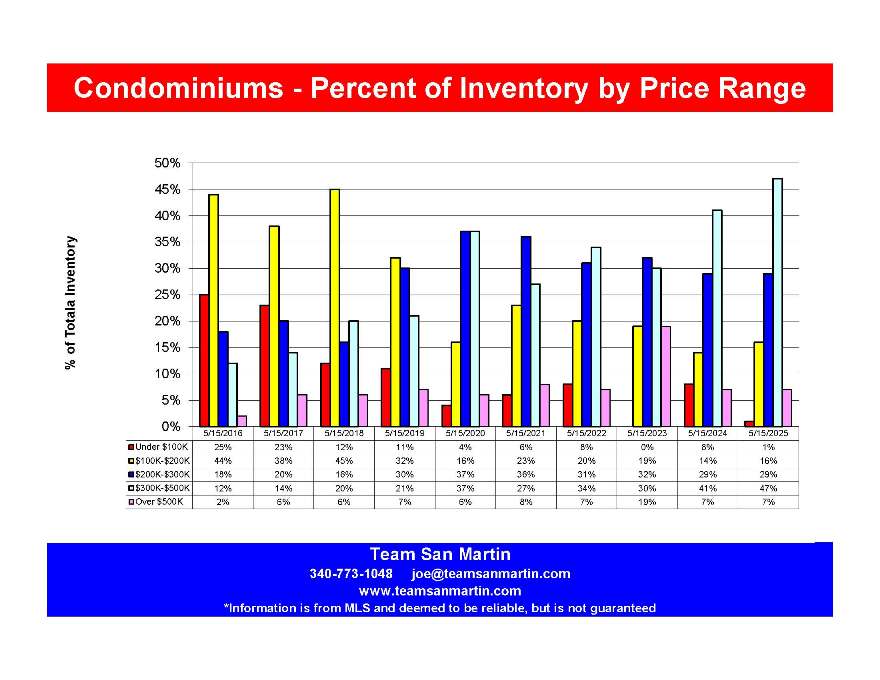
Under $100,000 listings are currently only 1% of total condo listings, down from a high of 25% (9/15/16).
$100,000 to $200,000 listings (23%) are half of total inventory when compared to 10 years ago (46%). The lowest was 10% (9/15/23).
$200,000 to $300,000 listings are at 24% of total inventory, 8% higher than 10 years ago (16%).
$300,000 to $500,000 listings, at 39% of total inventory, have increased 29% compared to ten years ago. The lowest level was 11% (9/13/16). The highest 45% (9/15/24).
Listings over $500,000 represent 13% of the total condominium market, an increase of 10% compared to ten years ago.
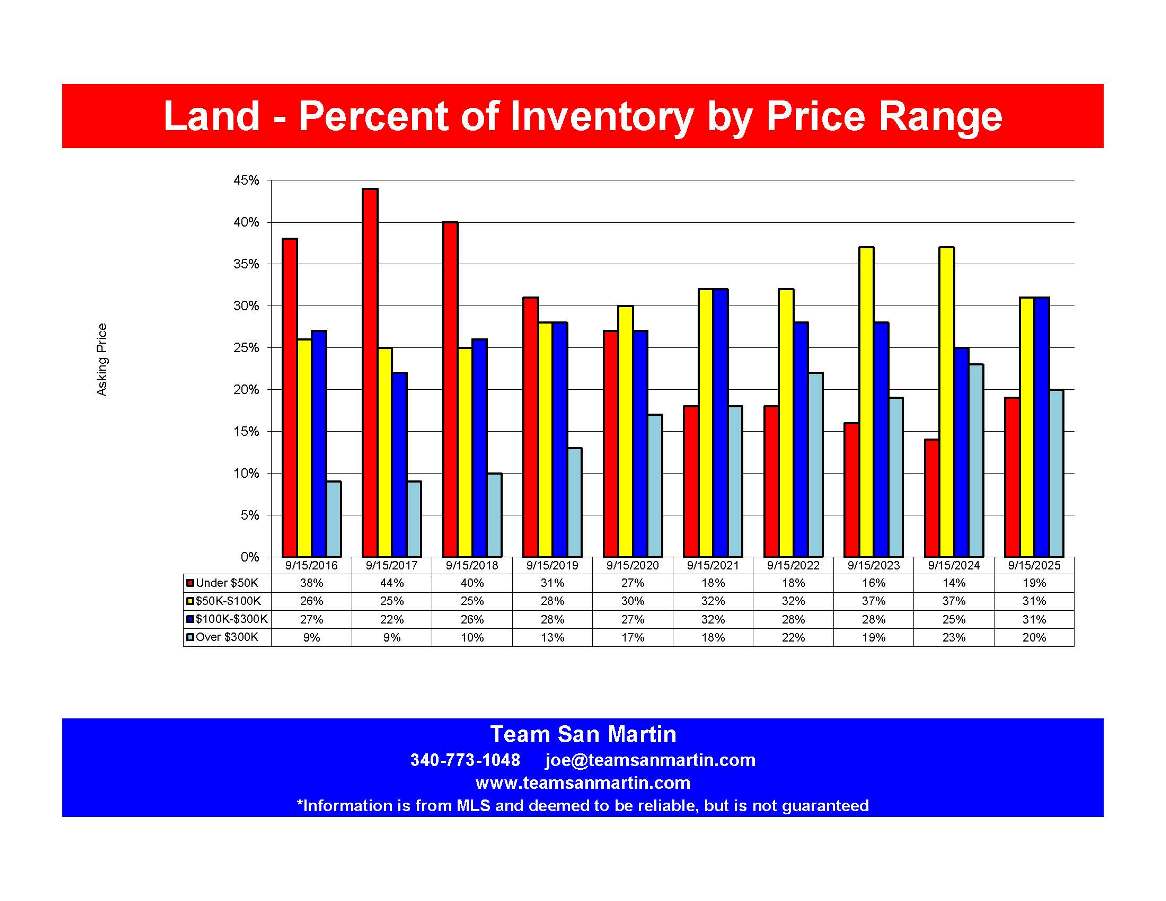
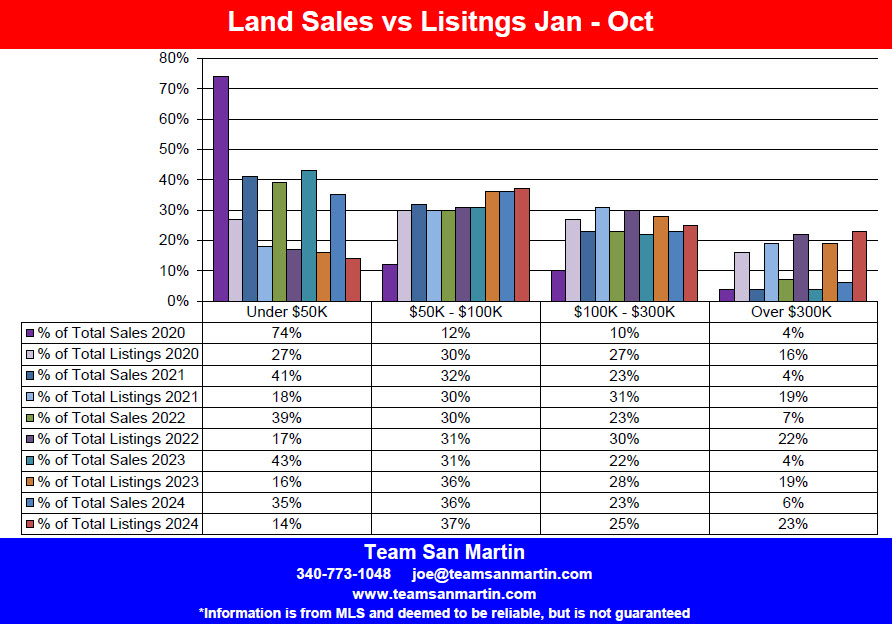
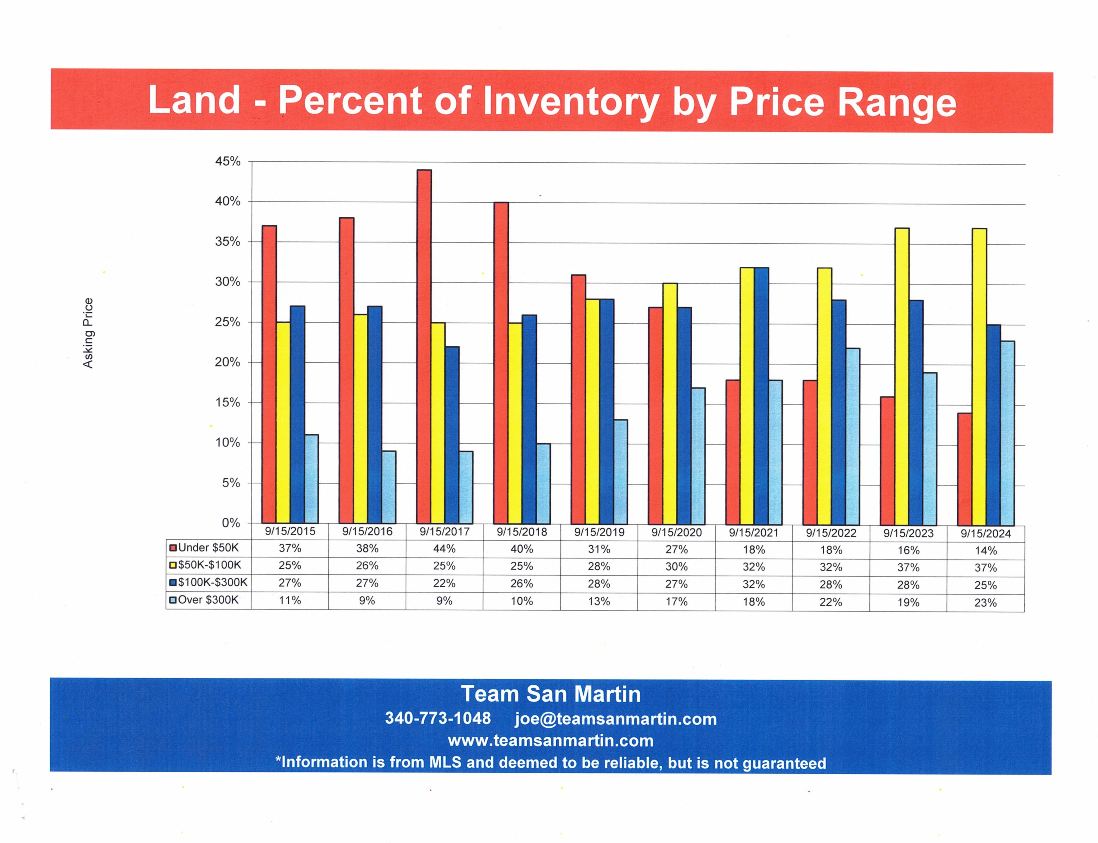
Vacant Land
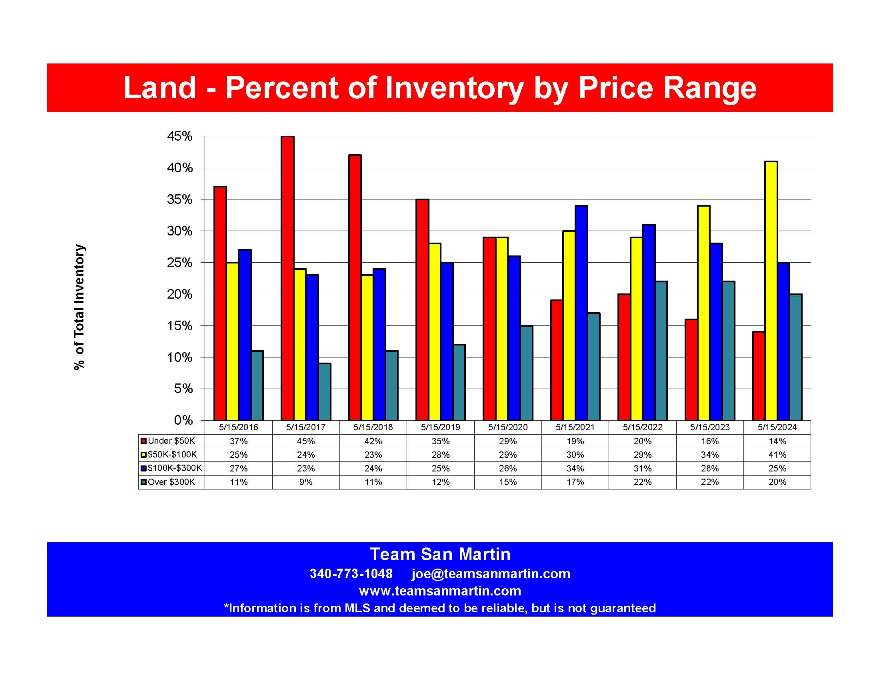
Under $50,000 listings (19%) are half of 10 years ago (38%). The highest percentage of total inventory (44%) was 9/15/17, the lowest (14%) was 9/15/24.
$50,000 to $100,000 listings (31%) have remained relatively constant over the 10-year period.
$100,000 to $300,000 listings (31%) have also remained constant over the ten years, lowest percentage was 9/15/17, at 22% of total land inventory.
Listings over $300,000 (20%) increased 11% when compared to ten years ago. The lowest levels were 2016 and 2017 when this segment of the market decreased to 9% of total land listings.
Information is from MLS and deemed to be reliable, but is not guaranteed.
Prepared by:
Julie San Martin
Team Manager
A Tale of Two Islands
St Croix and St Thomas Real Estate Sales
Ten Year Comparison Year to Date
Condominium
Number of condominium sales increased 11% (8 condos) on St Thomas, compared to last year but is 14% lower (13 condos) than this period ten years ago. On St Croix, the number of condos sold increased 20% (14
condos), compared to last year and is 5% higher (4 condos) than this period ten years ago.
Vacant Land
Number of vacant land sales on St Thomas increased 24% (7 lots) compared to last year and increased 33% (9 lots) compared to ten years ago. On St Croix, land sales decreased 18% (18 lots) compared to last year and increased 48% (26 lots) compared to ten years ago.


Sales Price and Marketing Time on St Croix
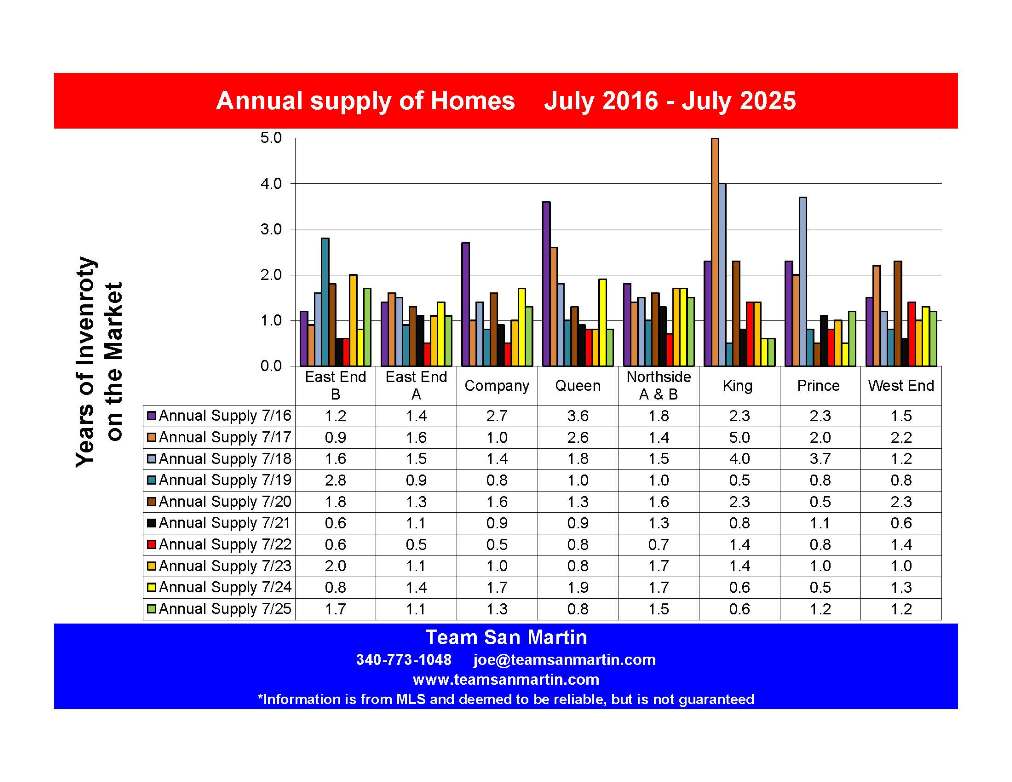
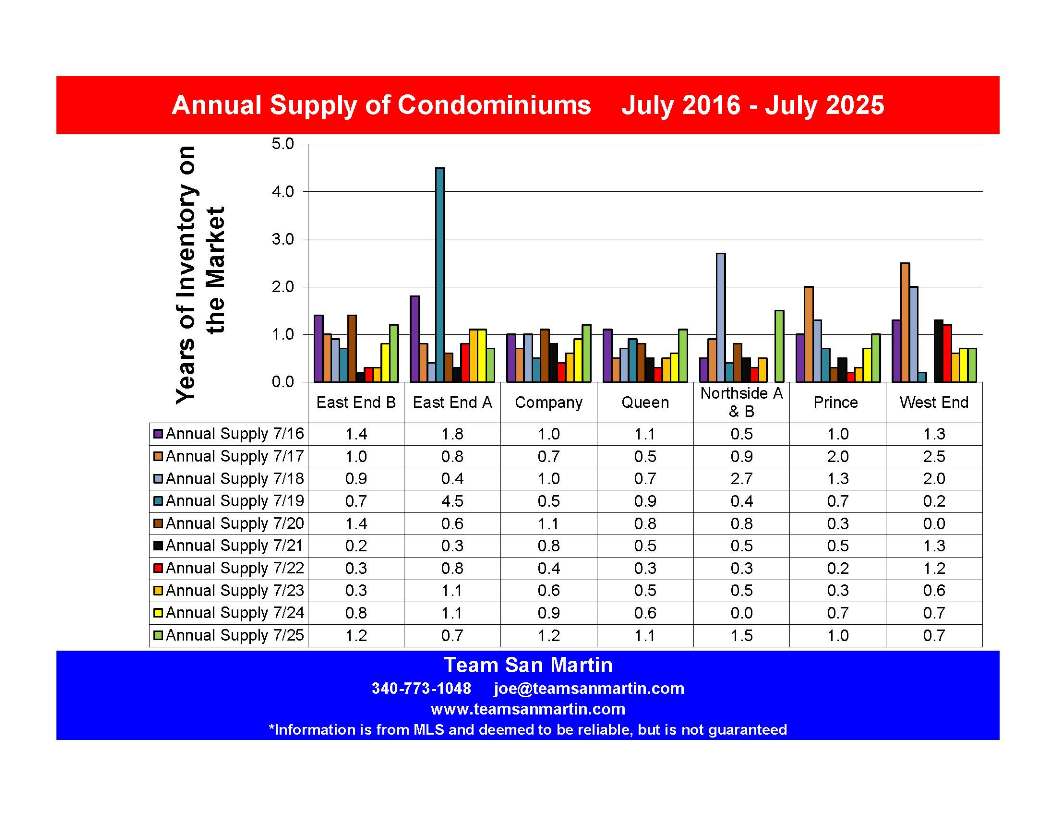
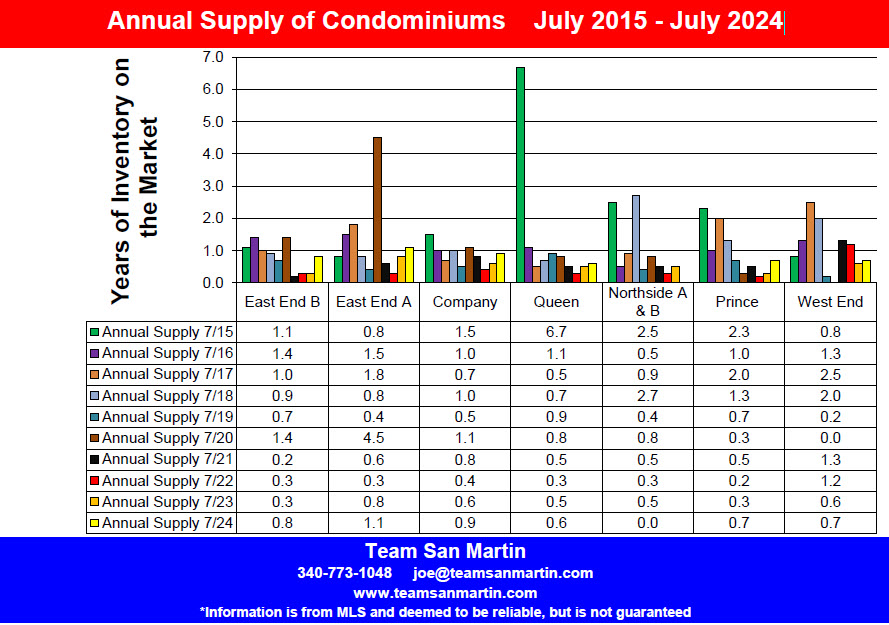
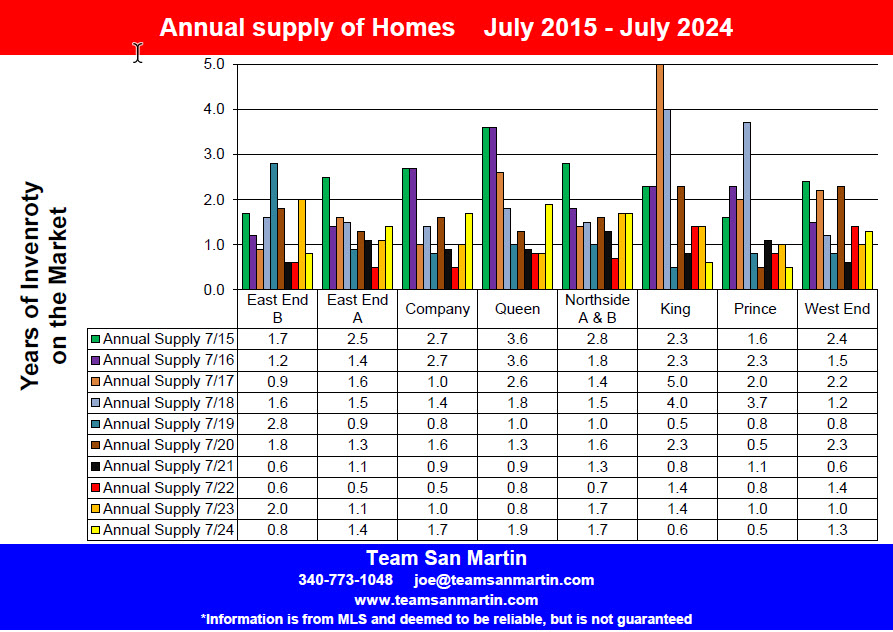
“Annual Supply” represents the number of years it will take at the current annual rate of sales to sell all the properties for sale
in a specific area.
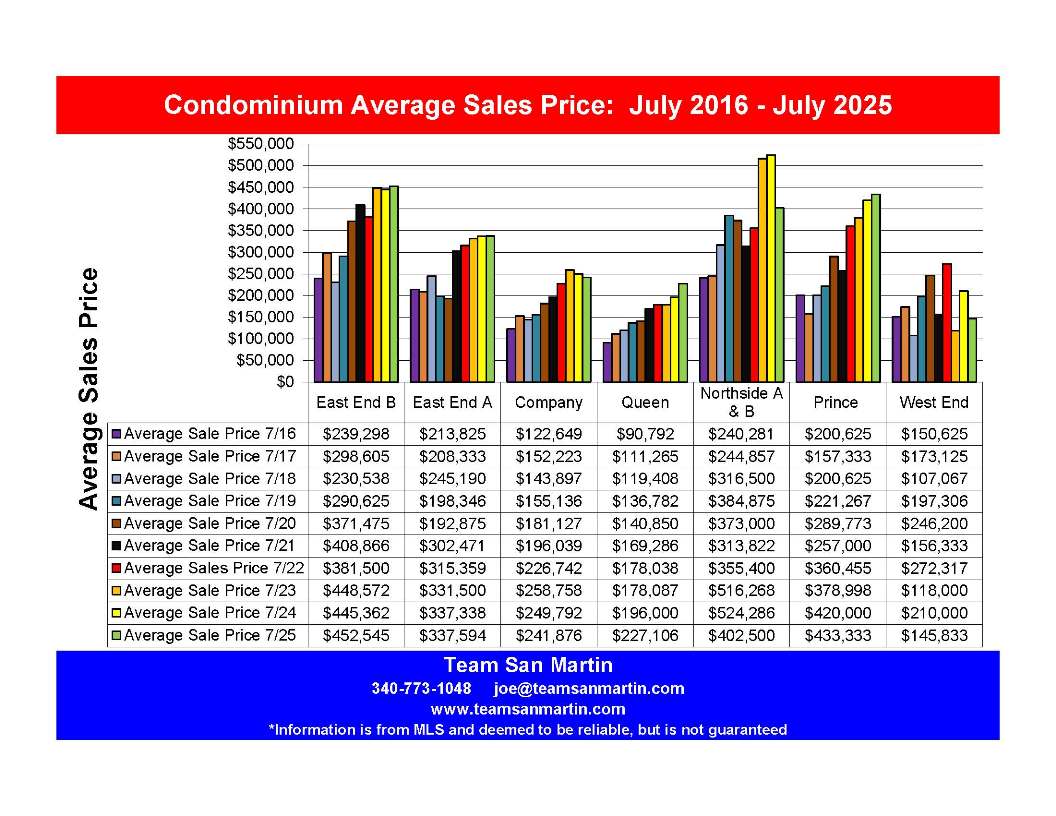
East End B
Far East End
Inventory
Ten years ago (July 2016), there was a 1.2-year supply of homes and a 1.4-year supply of condominiums on the market.
Residential inventory has increased by 6 months, compared to 10 years age.
Condominium inventory has decreased by about 2 months.
There is now a 20-month (1.7 years) supply of homes (an increase of 0.9 years compared to last year) and a 14-month (1.2 year) condominium supply (a 5-month increase compared to last year).
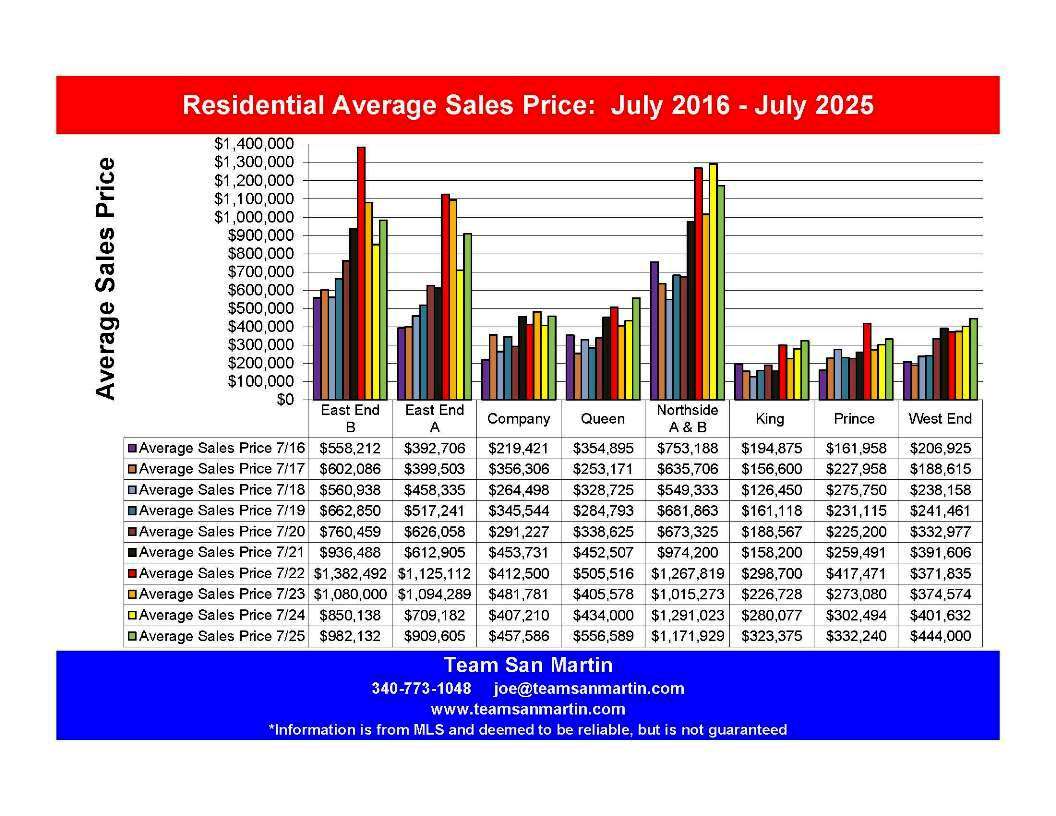
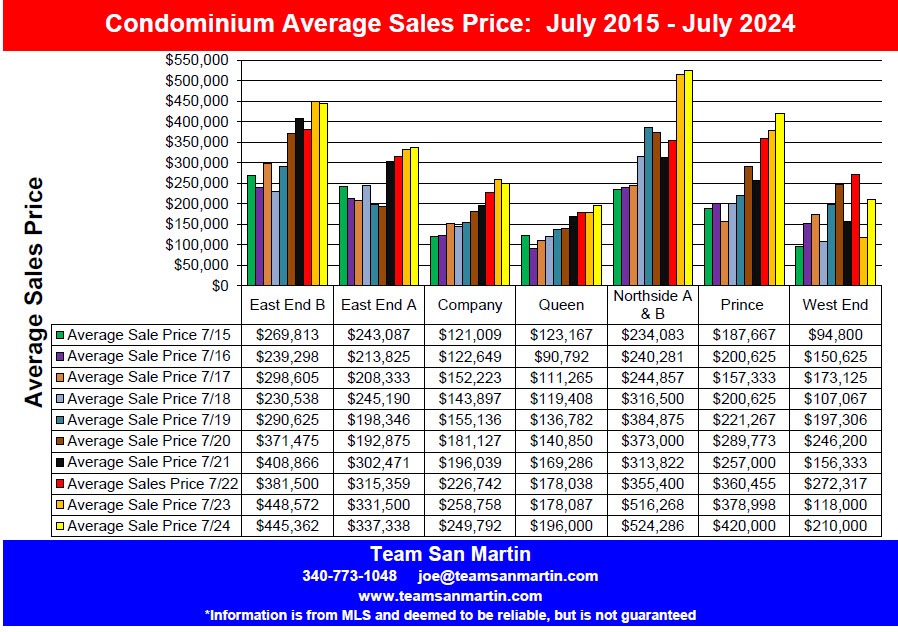
Average Sales Price
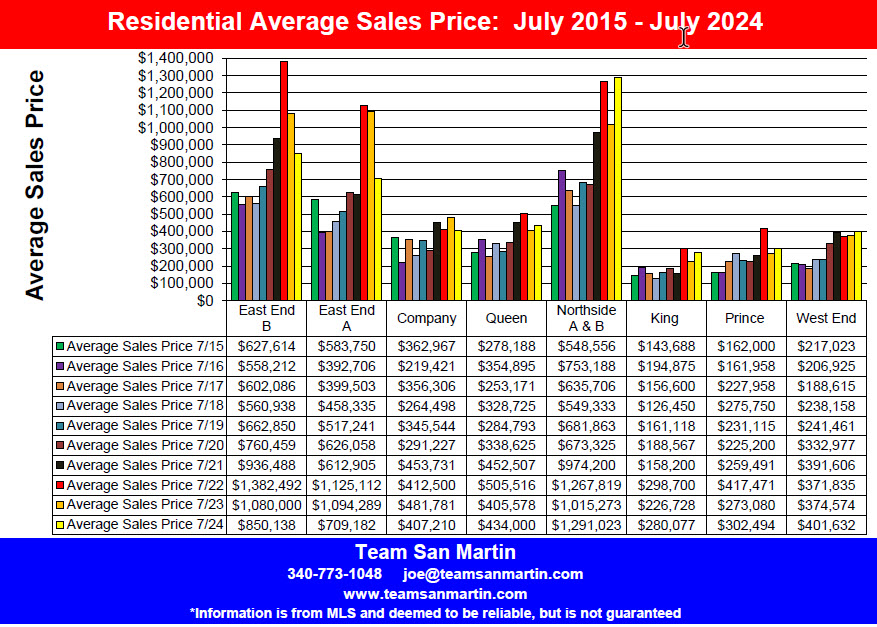
Average residential sale price ($982,132) is 16% higher than last year ($850,138) and 76% higher than 10 years ago ($558,212)
Average condominium sales price ($452,545) is 2% higher than last year ($445,362) and 89% higher than 10 years ago ($239,298).
East End A
Christiansted east to Coakley Bay
Inventory
Ten years ago (July 2016), there was a 1.4-year supply of homes and a 1.8-year supply of condominiums on the market.
Inventory decreased by 4 months for homes, to a 1.1-year supply, compared to 10 years ago and a decrease of 4 months compared to last year.
Inventory decreased by 13 months for condominiums, compared to 10 years ago, and by 5 months since last year.
Average Sales Price
Average residential sale price ($909,605) is 28% higher than last year ($709,182) and 132% higher than ten years ago ($392,706).
Condominium average sale price ($337,594) is unchanged from last year and 58% higher than ten years ago ($213,825).
Company
Christiansted west to east side of Judiths Fancy
Inventory
Ten years ago (July 2016), there was a 2.7-year supply of homes and a 1.0-year supply of condominiums on the market.
Residential inventory decreased by 17 months, to a 1.3-year supply of homes, compared to 10 years ago and a decrease of 5 months compared to last year.
Condominium inventory increased by 2 months, to a 1.2-year supply of condominiums for sale, compared to 10 years ago, and a decrease of 5 months compared to last year.
Average Sales Price
Average home sale price increased 12% ($50,376) compared to the previous year, from $407,210 to $457,586.
Compared to 10 years ago, the average home sales price increased 108% ($238,165).
Average condominium sale price increased 97% compared to 10 years ago, from $122,649 to $241,876.
Since last year, average condominium sale price decreased 3% ($7,916).
Queen
Constitution Hill west to La Reine, includes southwest Judiths Fancy
Inventory
Ten years ago (July 2016), there was a 3.6-year supply of homes and a 1.1-year supply of condominiums on the market.
Home inventory decreased by 3 years, to a 10 month supply over the ten-year period. Since last year, home inventory increased by 1.1 years.
Condominium inventory is unchanged over the 10-year period at 1.1 years. Since last year, inventory increased by 6 months.
Average Sales Price
Average residential sale price increased 57% over the ten-year period, from $354,895 in 2016 to $556,589 for the 12 months ending July 2025. Average residential sales price increased $122,589 (28%) since last year.
Average condo sale price increased 150% ($136,314) over the ten-year period, from
$90,792 in 2016 to $227,106 for the 12 months ending July 2025.
Since last year, average condominium sales price increased 16% ($31,106).
Northside A & B
North shore from north Judiths Fancy west to Hamms Bluff
Inventory
Ten years ago (July 2016), there was a 1.8-year supply of homes and a 6 month supply of condominiums on the market.
Residential inventory decreased by 4 months, to a 1.5-year supply of homes compared to 10 years ago.
Compared to last year, residential inventory decreased by 2 months.
Condominium inventory increased by 1 year over the 10-year period.
Last year there were no condominiums on the market in these quarters, there is now a 1.5-year supply of condominiums on the market.
Average Sales Price
Average home sale price ($1,171,929) increased by $418,741 (55%), compared to ten years ago ($753,188). Average home sale price decreased $119,094 (9%) since last year ($1,291,023).
Average condominium sales price increased $162,219 (68%) over the ten-year period, from $240,281 for the 12 months ending July 2016 to $402,500 for the 12 months ending July 2025.
Compared to last year, the average condominium sale price decreased $121,786 (33%).
King
South shore from La Reine west to UVI
Inventory
Ten years ago (July 2016), there was a 2.3-year supply of homes.
There are no condominiums in King Quarter.
Residential inventory decreased 1.7 years, compared to ten years ago, to 7 months of inventory for the 12 months ending July 2025.
Residential inventory is unchanged from last year.
Average Sales Price
Average home sale price increased $128,5009 (66%) over the ten-year period, from $194,875 for the 12 months ending July 2016 to $323,375 for the 12-months
ending July 2025.
Average home sale price increased $43,298 (15%) compared to last year ($280,077).
Prince
South shore from UVI west to Williams Delight
Inventory
Ten years ago (July 2016), there was a 2.3-year supply of homes and a 1-year supply of condominiums on the market.
Residential inventory decreased by 1.1 years, to a 1.2-year supply of homes over the 10 year period and increased by 8-months compared to the previous year.
Condominium inventory is unchanged compared to 10 years ago and is 4 months higher compared to the previous year.
Average Sales Price
Home sale average price increased $170,282 (105%) when compared to ten years ago, from $161,958 for the 12 months ending July 2016 to $332,240
for the 12 months ending July 2025.
Average home sale price increased $29,746 (10%) compared to last year ($302,484).
Condominiums experienced a $232,708 (116%) increase in average sale price over the ten-year period, from $200,625 for the 12 months ending July 2016 to
$433,333 for the 12 months ending July 2025.
Average condo sales price increased $13,333 (3%) since last year
West End
South from Mahogany Road, East to Williams Delight
Inventory
Ten years ago (July 2016), there was a 1.5-year supply of homes and a 1.3-year supply of condominiums on the market.
Over the ten-year period, residential inventory decreased 4 months, to a 1.2-year supply of homes for the 12 months ending July 2025, a decrease of 1 month compared to the previous year.
Condominium inventory decreased by 7 months, compared to 10 years ago. Compared to last year, condominium inventory is unchanged at 8 months.
Average Sales Price
Average home sale price increased $237,075 (114%) over the ten-year period, from $206,925 for the 12 months ending July 2016 to $444,000 for the
12 months ending July 2025 and a $42,368 (10%) increase over last year ($401,632).
Average condominium sale price decreased $4,792 (3%) over the ten-year period, from $150,625 for the 12 months ending July 2016 to $145,833
for the 12 months ending July 2025.
Compared to last year, the average condominium average sale price decreased $64,167 (31%) over the previous year ($210.000).
Conclusion
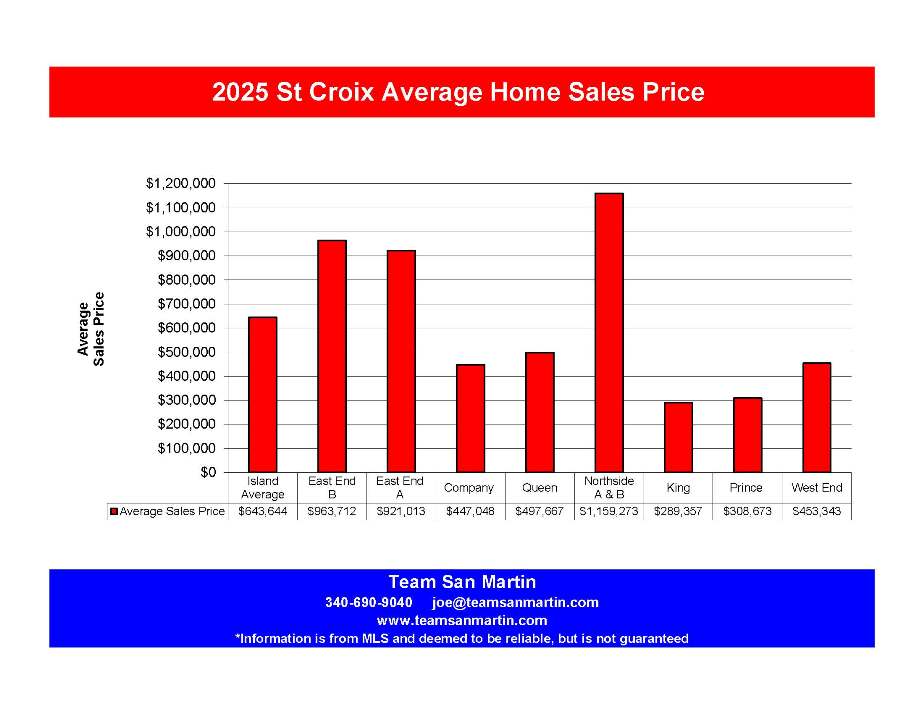
The average home sale price is more than $1 Million in one quarter:
· Northside A & B
These two quarters have average sale prices in the $900,000 range:
· East End B
· East End A
This quarter has average home sale price in the $500,000 range:
· Quen
These two quarters have average home sale prices in the $400,000 range:
· Company
· West End
These two quarters have average sales prices in the $300,000 range:
· Prince
· King
Condominium sales prices were more consistent, with a $306,712 difference between the highest average price (East End B at $452,545) and the lowest.
(West End at $145,833)
Condominium inventory increased in all quarters except East End A.
Residential inventory increased in these quarters:
· East End B
· Prince
Residential inventory decreased in these quarters:
· East End A
· Company
· Queen
· Northside A & B
· West End
Average home sale price increased in all quarters except:
· Northside A & B
Information is from MLS and deemed to be reliable but is not guaranteed.
Prepared by:
Julie San Martin
Team Manager
July 2025
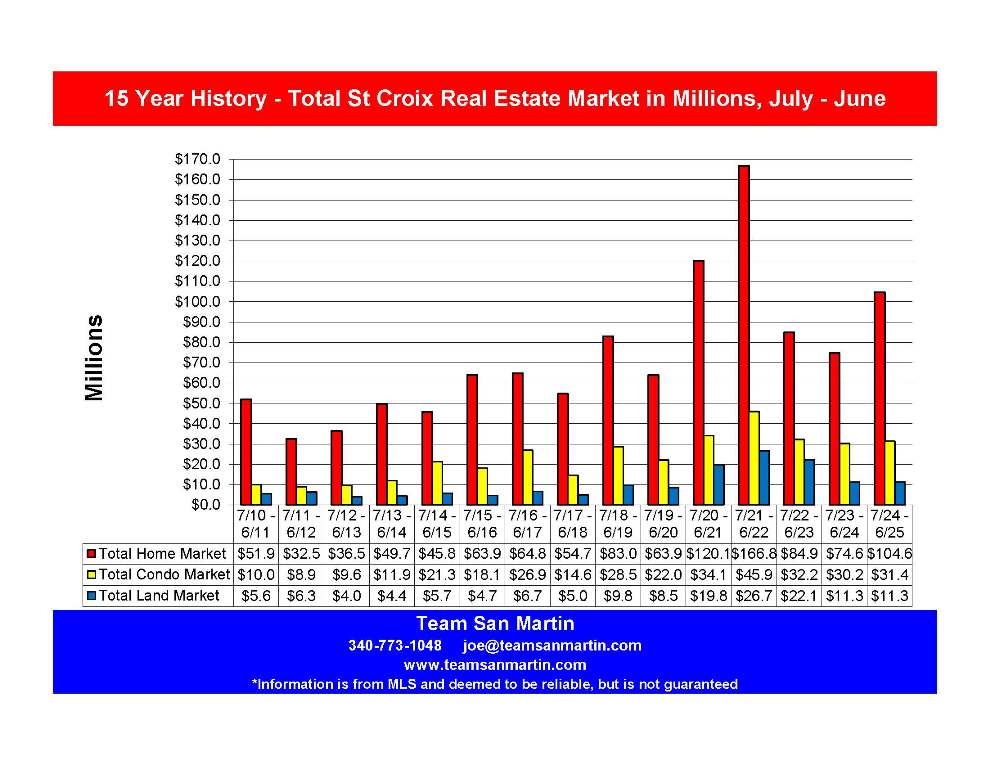
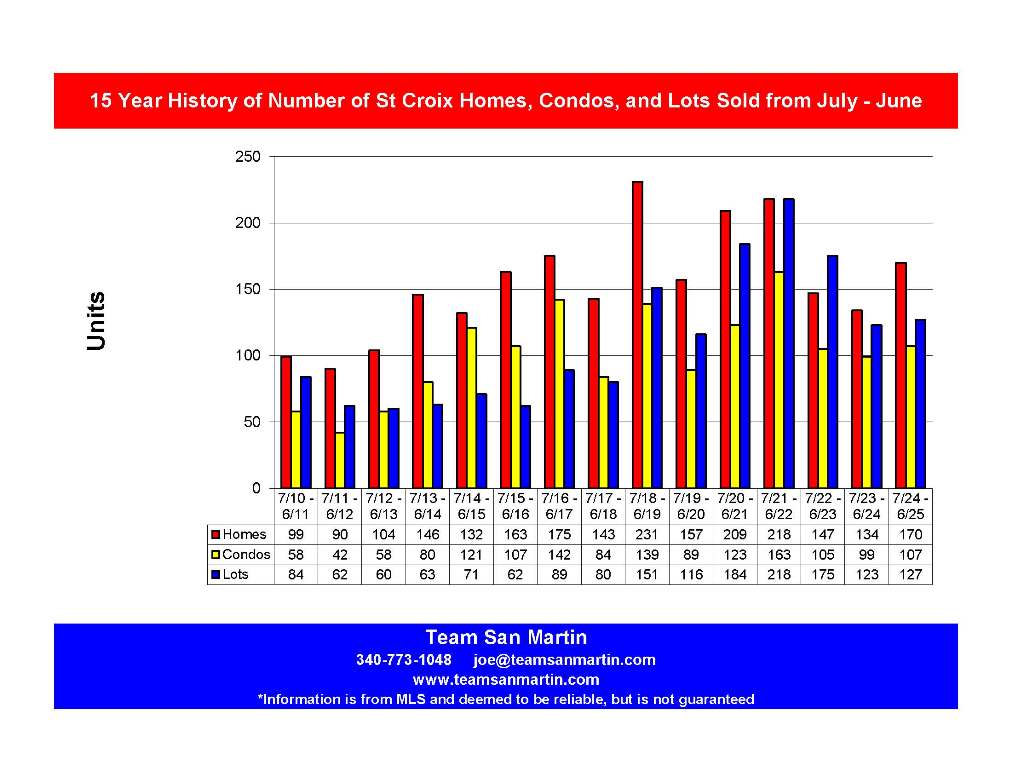
15 year look at the St Croix Real Estate Market for the 12 month period ending 30 June
St Croix real estate market boom cycle is over.
St Croix real estate market peaked July 2021 / June 2022,
Typically, 10 to 15 years between boom cycles
Total number of properties sold
· Residential – During the past 12 months, the number of homes sold (170) is 10% above the average number of homes sold per year for the 15-year period (154) and 72% higher than the number of homes sold 15 years ago during this period (99). Currently there are 174 active home listings and 43 pending home sales, a 25% pending rate.
· Condominiums – During the past 12 months, the number of condominiums sold (107) was slightly higher than the average number of condos sold per year for this 15-year period (101). This is 84% higher than the number of condominiums sold during this period 15 years ago (58). The current inventory level is 112 active and 15 pending condominiums, a 13% pending rate.
· Land – Number of lots sold (127) during the past 12 months is slightly higher than the average number of lots sold per year for the 15-year period (111). Compared to the same 12-month period 15 years ago (84 lot sales), the current period represents a 51% increase. In this category there is plenty of inventory with 353 active lot listings and 41 pending lot sales, a 12% pending rate.
Average sales price
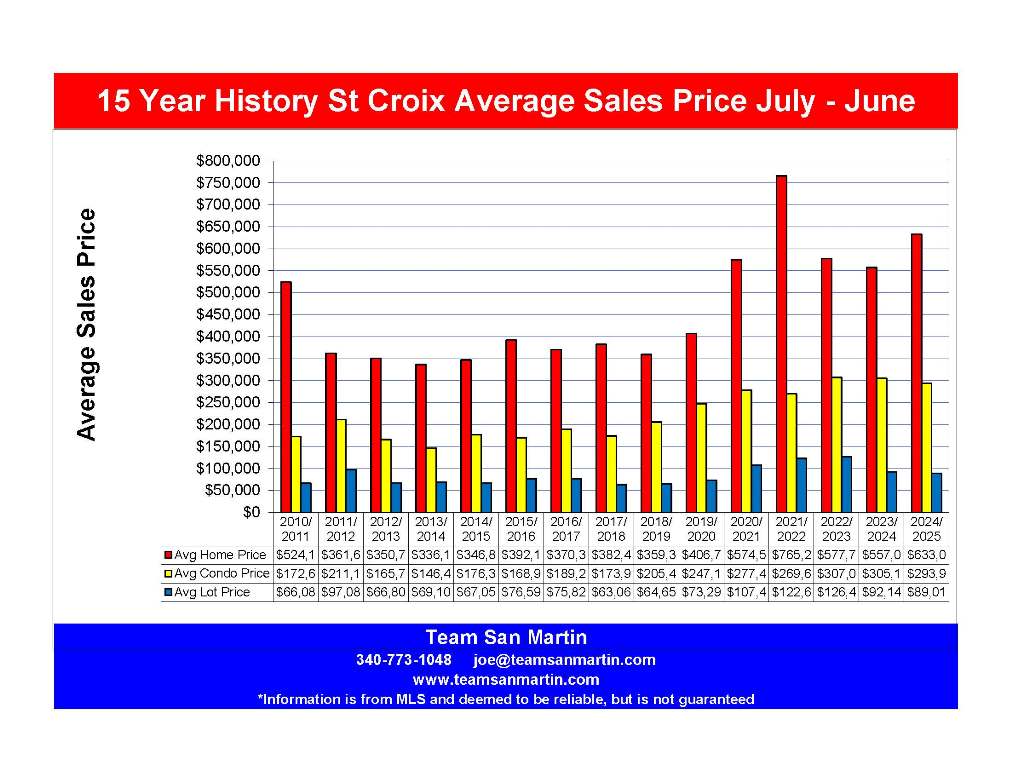
· Residential – Average home sales price increased 14% ($76,049) compared to the previous 12-month period, to $633,073 from $557,026. The 2024 / 2025 average is 37% higher than the average sales price for the 15-year period ($462,561)
· Condominiums – Average condominium sales price ($293,915) is $11,203 less than the previous year, and 33% higher than the 15-year average of $220,684,
· Land – Average lot sales price ($89,016) is 3% lower than the previous 12-month period ($92,149). The current average sales price is 7% higher than the 15-year average sale price ($83,246).
Total Market
Number of properties sold x Average sales price
· Residential – This was the best performing segment of the St Croix real estate market during this 12-month period. Total residential market increased by $30 Millon when compared to the previous 12 months, from $74.6 Million to $104.6 Million. The 2024/2025 period exceeded the 15-year average housing market ($73.2 Million) by $34.4 Million (47%).
· Condominiums – The past 12 months’ sales ($31.4 Million) represent a modest $1.2 Million (4%) increase from the 2023/2024 period ($30.2 Million). The 2024/2025 period exceeded the 15-year average condo market ($23.0 Million) by $8.4 Million (37%).
· Land – The past 12 months sales ($11.3 Million) represents no change from the 2023/2024 period (also $11.3 Million). The 2024/2025 period exceeded the 15-year average land market ($10.1 Million) by $1.2 Million (12%).
Conclusion
Compared to 15 years ago, the total St Croix real estate market increased 118%, from $67.5 Million
(July 2010 to June 2011) to $147.3 million
(July 2024 to June 2025)
An average of 7.9% growth per year
Compared to the previous 12-month period, total
St Croix real estate sales increased by $31.2 Million (15%) from $116.1 Million to $147.3 Million.
The St Croix real estate market boom is over,
the market is readjusting.
Information is from MLS and deemed to be reliable, but is not guaranteed.
Prepared by:
Julie San Martin
Team Manager
Changes in the St Croix Real Estate Market
Inventory levels by price range reflect the seller’s expectations.
The attached graphs compare changes in asking prices over the past decade, using 15 May inventory levels.
BIG changes in sellers’ expectations!
Residential
Condominium
Land
Information is from MLS and deemed to be reliable, but is not guaranteed.
Prepared by:
Julie San Martin
Team Manager
May 2025
Inventory Levels and Sales Projections
May Inventory Levels
10 Year Review
Residential
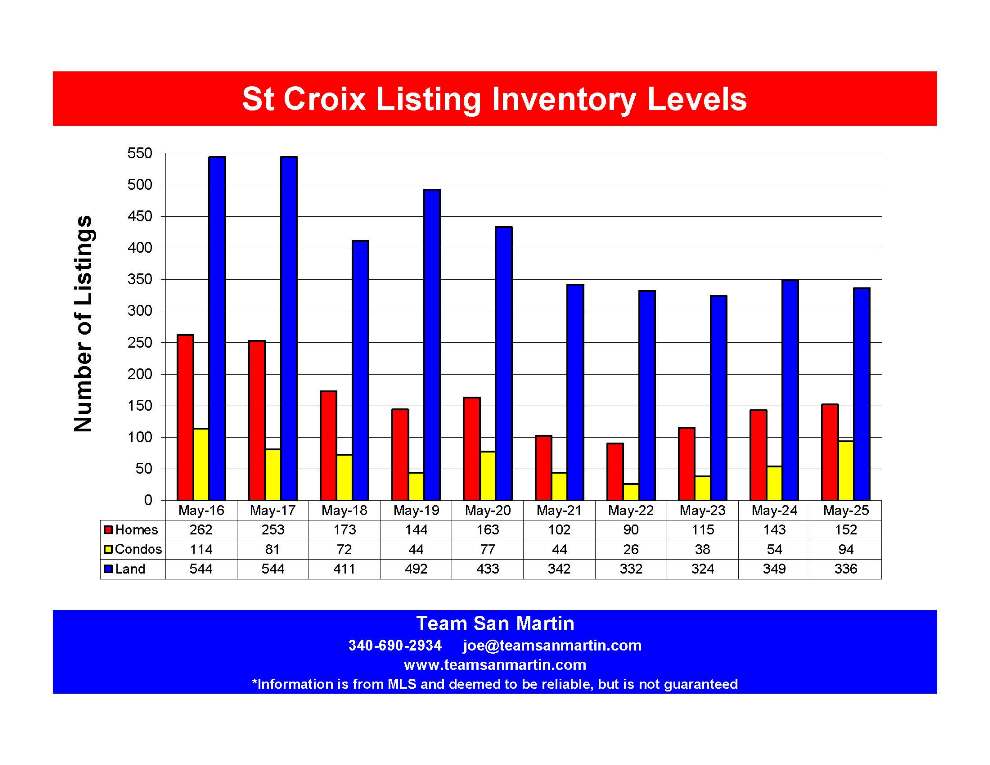
Residential inventory peaked in 2016 with 262 homes for sale and declined through 2022. Current inventory of 152 homes for sale is 58% of the number of homes for sale in 2016.
Condominium
Condominium inventory also peaked in 2016 with 114 condominiums for sale and declined through 2022. Current inventory of 94 condos is 82% of 2016 condominium inventory.
Land
Land inventory peaked in 2016 / 2017 with 544 lots for sale and slowly declining through 2023. Current inventory of 336 lots is 62% of the 2016 / 2017 inventory.
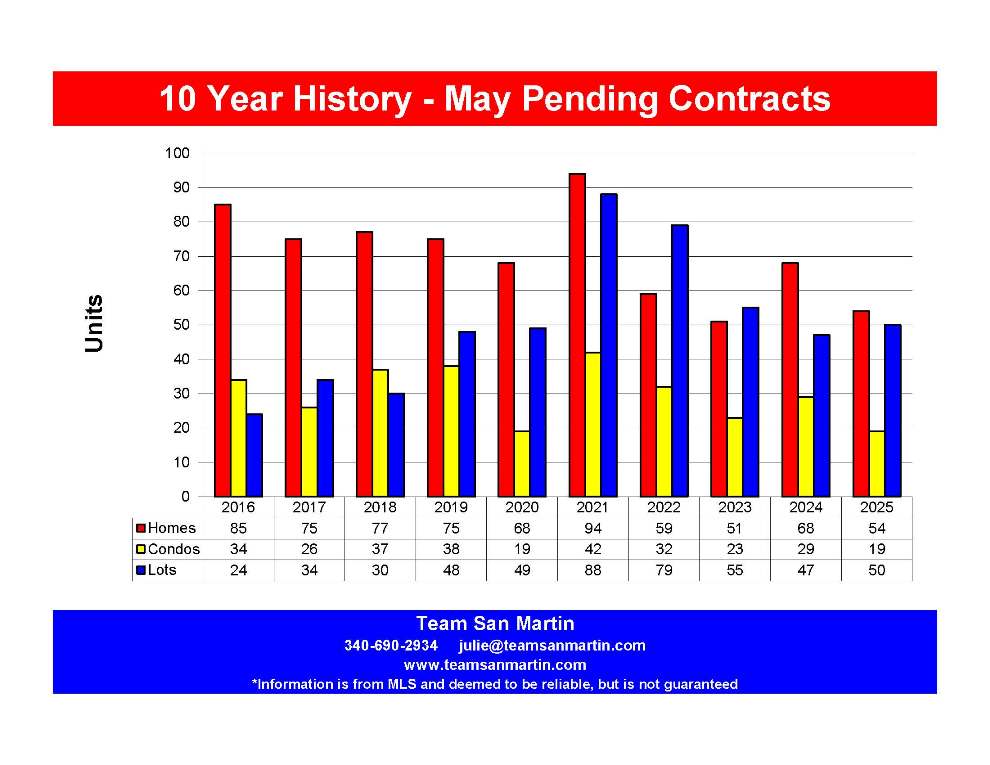
May Pending Sale Levels
10 Year Review
Residential
May 2025 residential pending sales (54) is 64% of the number of pending residential sales 10 years ago (85). The average number of pending residential sales over the 10-year period is 71; the May 2025 number of pending sales (54) is 76% of the 10-year average.
Condominium
May 2025 condominium pending sales (19) is 56% of the number of pending contracts 10 years ago (34). Current pending condominium sales (19) are 63% of the 10-year average of 30 pending condominium sales.
Land
May 2025 pending land sales (50) are more than double pending contracts 10 years ago (24). Current pending land sales ( 50) are 100% of the 10-year average of 50 pending land sales in May.
2024 Sales Predictions
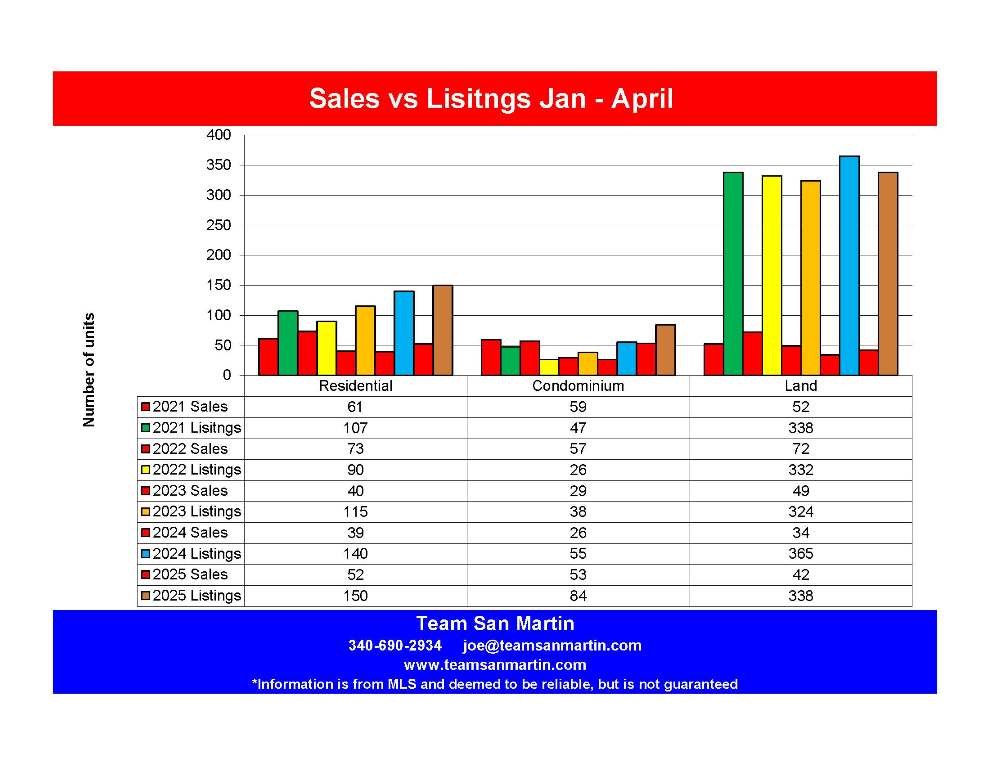
Using the assumption that the first 4 months of 2025 are a valid predictor for the entire year.
Residential
The first four months home sales predict 156 home sales during 2025; pending contracts predict 162 home sales during 2025. Inventory levels of 150 homes on the market suggest the lower number to be more likely.
Condominium
The first four months condominium sales predict 159 condominium sales during 2025; pending contracts predict 57 condominium sales during 2025. Inventory levels of only 94 condominiums on the market suggest a number in the middle, probably 90 to 100 condominium sales.
Land
The first four months land sales predict 126 land sales during 2025; pending contracts predict 150 land sales during 2025. With ample land inventory and dwindling home and condo inventory, it is entirely possible there will be 150 land sales during 2025, an 18% increase from the number of lots sold (127) during 2025.
Information is from MLS and deemed to be reliable, but is not guaranteed.
Prepared by:
Julie San Martin
Team Manager
April 2025
1st Quarter Sales as Predictor for the full year
The St Croix real estate market made a strong recovery through 2022, is now showing signs of contraction.
The question is – what do the 1st quarter statistics predict about market prospects for the rest of the year?
First, a look at inventory trends over the
15 year period:
· Residential inventory peaked in 2012, with 340 homes for sale, then steadily declined each year to the low point of only 85 homes for sale in 2022. Residential inventory is again increasing.
· Condominium inventory also peaked in 2012, with 217 condominiums for sale, then steadily declined each year to the low point of only 14 condos on the market in 2022. The 2025 level of 89 condominiums for sale continues to be low inventory.
· Land inventory also peaked in 2012, at 566 lots for sale. Until 2020, land inventory was between 566 and 443 lots for sale. For the past five years, 1st quarter land inventory has been in the low to mid-300 lot range.
Residential Sales & 2025 Predictions
Over the past 15 years, the number of homes sold during the first quarter has under predicted the annual sales number, with two outliers (2017 and 2019) which slightly overpredicted the annual number of homes sold.
The 1st quarter average sales price has been a fairly accurate predictor of the annual home sales price. Again, there were a few outlier years – 2011, 2021, and 2022 when 1st quarter sales price overpredicted the annual average sales price.
2025 annual prediction:
· Total number of homes sold will be as predicted, around 150 homes.
· Average sales price will most likely be in mid $600,000 range.
Condominium Sales & 2025 Predictions
Condominiums are a much smaller market, with just a few units built since the 1980s. It is more difficult to identify trends because the sample is significantly smaller.
Since 2015, the number of condominium sales on St Croix has been in the 100 to 150 unit annual range.
1st quarter average sale price has, in most cases, been a fairly close predictor for the year.
2025 annual prediction:
· Total number of condominiums sold will be in the 100 unit range.
· Average sales price will most likely be in the low $300,000 range.
Land Sales & 2025 Predictions
Both predicted and actual number of lots sold were trending up until 2023. The number of lots sold declined 37% from 2022 to 2024. The 2025 1st quarter figure predicts only 76 lot sales during 2025.
For the period of 2021 through 2023, the average lot sales price was in the $100,000 range. The 2025 prediction, based on 1st quarter sales, is a return to an average sales price in the $90,000 range.
2025 annual prediction:
· Total number of lots sold will be under 100.
· The 2025 average lot sales price will be in the $90,000 range.
Information is from MLS and deemed to be reliable, but is not guaranteed.
Prepared by:
Julie San Martin
Team Manager
March 2025
Home Sales
St Thomas vs St Croix
A 20 Year Look
Total Number of Properties Sold
· Over the 20-year period, more homes sold every year on St Croix than on St Thomas.
· Over the 20-year period, the highest number of homes sold was in 2021 for St Croix with 219 home sales and 2018 for St Thomas with 133 home sales; 2021 was nearly the same, with 132 home sales on St Thomas.
· During 2024, 83 more homes were sold on St Croix than on St Thomas.
· Over the 20-year period, the fewest number of homes sold on St Croix (88) was during 2012, the fewest number of homes sold on St Thomas (46) was during 2009.
Average Sales Price
· For the past 20 years, the annual average home sale price on St Thomas has exceeded that of St Croix.
· For 2024, the average St Thomas home sale price was 57% higher, at $867,561, than the 2004 average sales price ($550,560).
· The average annual home sale price on St Croix for 2024 was 64% higher, at $583,099, than the 2004 average home sale price ($355,100).
· For 2024, the average sale price of a home on St Croix ($583,099) was 67% of the average sales price of a home on St Thomas ($867,561).
Total Market in Millions of Dollars
· This measurement is a combination of total homes sold multiplied by average sales price; it gives the best overview of annual market performance.
· During this 20-year period, the total St Thomas residential market exceeded the total St Croix market during six years: 2008, 2012, 2013, 2014, 2015, 2018, and 2023.
· During 2024, the total St Croix residential market ($92.1 Million) exceeded the total St Thomas residential market ($65.1 Million) by $27 Million.
Information is from MLS and deemed to be reliable but is not guaranteed.
Prepared by:
Julie San Martin Team Manager
February 2025
The St Croix Real Estate Cycle
A 20 Year Look
2024 St Croix real estate sales were mixed.
Total Number of Properties Sold
· The number of homes sold on St Croix during 2024 (169) is 37 more homes sold than the previous year (132) and 5 fewer than 20 years ago (1744).
· There were 102 condominium sales on St Croix during 2024, 3 more than the previous year (99) and 106 fewer than twenty years ago (208).
· There were 133 lot sales in 2024. This is 19 fewer than the previous year (152) and 198 fewer than 20 years ago (231).
Average Sales Price
· At $589,856, the average 2024 home sales price was exceeded only by the 2021 average home sales price ($618,943) and 2022 average home sales price ($771,242). The average 2024 home sales price is $234,756 higher than 20 years ago ($3555,100).
· The 2024 average condominium sales price ($293,590) is exceeded only by the 2023 average sales price ($301,649), also the highest average sales price of the entire 20-year period. The average 2024 sales price is $126,587 higher than 20 years ago ($167,003).
· The average 2024 lot sales price ($92,858) is $13,877 lower than the previous year’s average lot sale price ($106,435), a 13% decrease, and $1,433 lower than the 2005 average lot sale price of $94,291.
Total Market in Millions of Dollars
· The 2024 total residential market ($99.7 million) is 67% of the 2022 record setting market of $148.1 million. Only 2 years during this 20-year period exceeded the 2024 figure: 2021 ($135.5 million) and 2022.
· The 2024 total condominium market ($30 million) exceeded 2023 by $100,000. Only 3 years during this 20-year period exceed 2024: 2005 ($34.7 million), 2021 ($45.2 million), and 2022 ($39.9 million).
· The 2024 total land market ($12.4 million) is $3.8 million lower than the previous year ($16.2 million) and $18.8 million less than 20 years ago ($31.2 million).
Information is from MLS and deemed to be reliable but is not guaranteed.
Prepared by:
Julie San Martin
Team Manager
January 2025
10 Year St Croix Home Sales Price Trends
The average sales price of a home on St Croix increased $178,143 over the
10-year period; this is a 44% increase.
Total number of homes sold annually decreased 12% (17 homes) since 2015.
All areas of the island did not perform the same.
East End B
Far East End
Compared to 9 years ago, the average sales price of a home increased 44% ($297,382 increase).
The number of homes sold in a year decreased by 8 homes, compared to 9 years ago.
25 homes sold in 2015, 17 homes sold in 2024.
East End A
Christiansted East to Coakley Bay
Compared to 9 years ago, the average sales price of a home increased 14%
($81,447 increase).
The number of homes sold in a year increased by 5 homes, compared to 9 years ago;
25 homes sold in 2015, 30 homes sold in 2024
Company
Christiansted West to the East Side of Judiths Fancy
Compared to 9 years ago, the average sales price of a home increased 51% ($168,370 increase).
The number of homes sold in a year increased by 9 homes, compared to 9 years ago,
from 12 home sales in 2015 to 21 home sales in 2024.
Queen
Constitution Hill West to La Reine, includes southwest
Judiths Fancy
Compared to 9 years ago, the average sales price of a home increased 69%
($203,139 increase).
The number of homes sold in a year increased by 6 homes, compared to 9 years ago, from 20 homes sold in 2015 to 26 home sales in 2024.
Northside A & B
North Shore from North Judiths Fancy to Hamms Bluff
Compared to 9 years ago, the average sales price of a home increased 74% ($479,605 increase).
The number of homes sold in a year increased by 2 homes, compared to 9 years ago.
10 home sales closed in 2015, 12 home sales closed in 2024.
King
South Shore from La Reine West to UVI
Compared to 9 years ago, the average sales price of a home increased 140%
($197,271 increase).
The number of homes sold in a year increased by 4 homes, compared to 9 years ago, from 8 homes sold in 2015 to 12 home sales in 2024.
Prince
South Shore from UVI West to Williams Delight
Compared to 9 years ago, the average sales price of a home increased 45%
($96,814 increase).
The number of homes sold in a year increased by 5 homes, compared to 9 years ago, from 9 homes sold in 2015 to 14 home sales in 2024.
West End
South Shore, South from Mahogany Road,
East to Williams Delight
Compared to 9 years ago, the average sales price of a home increased 84%
($180,221 increase).
The number of homes sold in a year is unchanged, compared to 9 years ago, with 23 homes sales in 2015 and 23 homes sales in 2024.
Observations
Average home sales prices in three areas of the island consistently exceed the
island wide “average” home sales price:
· East End B
· East End A
· Northside A & B
Average home sales prices are consistently much lower than the island wide “average” home sales price:
· Company
· Queen
· King
· Prince
· West End
More homes sold in all quarters during 2024, when compared to 2015 except for:
· East End B
Compared to 2023, the island wide average home sale price increased 2%.
All quarters experienced increased average sales prices except for:
· East End A
· Northside A & B
Information is from MLS and deemed to be reliable but is not guaranteed.
Prepared by:
Julie San Martin
Team Manager
December 2024
up to November
Ten Year Inventory Level Trends
Current Annual supply represents the number of years it will take at the current rate of sales to sell all the properties listed in a specific area (Quarter) of St Croix.
[Active Listings + Pending Listings] /
Number of Listings Sold During the Previous 12 Months
For example:
In November 2024, there were 15 active and 5 pending home sales in East End B, with 17 home sales in the previous 12 months, for a 1.2-year supply of homes for sale
[15 + 5] / 17 = 1.2 Years
East End B
Far East End
Residential
Compared to 9 years ago, home inventory is unchanged at 1.2 years; average sales price increased 43%; from $637,077 to $910,112.
Compared to last year, average time on the market decreased by 1 year;
average sales price increased 5% (from $867,818 to $910,112)
Condominium
Compared to 9 years ago, condominium inventory increased by 2 months; average sales price increased 59%, from $281,714 to $447,646
Compared to last year, average time on the market increased by 10 months;
average sales price increased 4% (from $431,772 to $447,646)
Vacant Land
Compared to 9 years ago, land inventory decreased by 4 years,
from 7.3 years to 3.3 years; average sales price increased 67% (from $58,575 to $97,861)
Compared to last year, land inventory increased by 2 months;
average sales price increased 10% (from $97,861 to $108,067)
East End A
Christiansted East to Coakley Bay
Residential
Compared to 9 years ago, home inventory decreased 1.6 years,
from 2.9 years to 1.3 years;
average home sale price increased 5%, from $631,295 to $666,000.
Compared to last year, residential inventory increased by about 2 months;
average sales price decreased 30% (from $958,694 to $666,000)
Condominium
Compared to 9 years ago, condominium inventory decreased by 5 months
(from 1.2 years to 0.8 years);
average condominium sales price increased 46% (from $242,965 to $353,800)
Compared to last year, condominium inventory increased by 2 months;
average sales price increased 3% (from $344,917 to $353,800)
Vacant Land
Compared to 9 years ago, land inventory decreased by 9.7 years,
from 12.3 years to 2.6 years;
average lot sales price increased 18%, from $93,571 to $110,914)
Compared to last year, land inventory decreased by 4 months;
average lot sales price increased 5% (from $105,958 to $110,914)
Company
Christiansted West to the East Side of Judiths Fancy
Residential
Compared to 9 years ago, residential inventory decreased by 1.9 years, from 3.7 years to 1.8 years; average home sales price increased 35% (from $342,409 to $463,647)
Compared to last year, residential inventory decreased by 11 months;
average home sales price increased 15% (from $401,789 to $463,647)
Condominium
Compared to 9 years ago, condominium inventory decreased by 10 months (from 1.6 years to 0.8 years);
average sales price increased 89% (from $122,610 to $231,886)
Compared to last year, condominium inventory decreased by 2 months, from 11 months to 9 months; average condo sales price decreased 7%
(from $250,163 to $231,886)
Vacant Land
Compared to 9 years ago, lot inventory decreased by 14 years, from 16.7 years to 2.7 years; average lot sales price increased 232%, from $22,5000 to $74,625.
Compared to last year, land inventory increased by 8 months, from 2 years to 2.7 years; average sales price increased 2%, from $73,286 to $74,625.
Queen
Constitution Hill West to La Reine, includes southwest
Judiths Fancy
Residential
Compared to 9 years ago, residential inventory decreased by 1.4 years
(from 2.9 years to 1.5 years);
average sales priced increased 92% (from $253,171 to $486,760)
Compared to last year, residential inventory increased by 4 months, from 1.2 years to 1.5 years; average sales price increased 20% (from $404,160 to $486,760)
Condominium
Compared to 9 years ago, condominium inventory decreased by
4.7 years (from 5.7 years to 1 year);
average condominium sales price increased 141% (from $88,333 to $213,053)
Compared to last year, condominium inventory increased by 4 months, from 8 months to 1 year; average sales price increased 10% (from $194,5629 to $213,053)
Vacant Land
Compared to 9 years ago, land inventory decreased by 5.2 years,
from 7.8 years to 2.6 years);
average lot sales price increased 40%, from $37,889 to $52,938.
Compared to last year, land inventory increased by 2 months, from 2.4 years to 2.6 years; average lot sales price decreased 36%, from $83,062 to $52,938.
Northside A & B
North Shore from North Judiths Fancy to Hamms Bluff
Residential
Compared to 9 years ago, residential inventory decreased by 1.6 years, from 2.9 years to 1.3 years; average home sales price increased 114%
(from $529,444 to $1,131,108)
Compared to last year, residential inventory decreased by 2 months, from 1.5 years to 1.3 years; average home sales price decreased 12% (from $1,292,500 to $1,131,108)
Condominium
Compared to 9 years ago, condominium inventory decreased by
4 months (from 10 months to 6 months);
average sales price increased 118% (from $239,670 to $523,333)
Compared to last year, condominium inventory decreased by 10 months, from 1.3 years to 6 months; average condo sales price decreased 4%,
from $542,143 to $523,333.
Vacant Land
Compared to 9 years ago, land inventory increased by
2 years, from 3.9 years to 5.9 years;
average lot sales price increased 2%, from $98,671 to $101,136.
Compared to last year, land inventory increased by 2.5 years, from 3.4 years to 5.9 years; average lot sales price decreased 20%, from $125,588 to $101,136.
King
South Shore from La Reine West to UVI
Residential
Compared to 9 years ago, residential inventory decreased by
1.4 years (from 2 years to 0.6 years);
average home sales price increased 156% (from $128,833 to $329,455)
Compared to last year, residential inventory decreased by
2 months (from 0.8 years to 0.6 years);
average residential sales price increased 32% (from $248,717 to $329,455)
Condominium
There are no condominium complexes in King Quarter
Vacant Land
Compared to 9 years ago, land inventory decreased by 5 months,
from 4 years to 3.6 years;
average lot sales price increased 3%, from $76,667 to $78,600)
Compared to last year, land inventory decreased by 1 year,
from 4.6 years to 3.6 years;
average lot sales price increased 29%, from $60,800 to $78,600.
Prince
South Shore from UVI West to Williams Delight
Residential
Compared to 9 years ago, residential inventory decreased by
2.7 years (from 3.3 years to 0.6 year);
average residential sales price increased 79% (from $176,056 to $315,923)
Compared to last year, residential inventory decreased by 5 months, from 1 year to 0.6 years; average residential sales price increased 18% (from $266,460 to $315,923)
Condominium
Compared to 9 years ago, condominium inventory decreased by 4 months, from 1.3 years to 1 year;
Average condominium sales price increased 108% (from $202,000 to $420,000).
Compared to last year, condominium inventory increased by 8 months, from 0.3 years to 1 year; average condominium sale price increased 9%
(from $384,000 to $420,000)
Vacant Land
Compared to 9 years ago, land inventory decreased by
3.1 years, from 4.5 years to 1.4 years;
average lot sales price increased 3%, from $70,985 to $73,286)
Compared to last year, land inventory is unchanged at 1.4 years;
average lot sales price decreased 56%, from $167,381 to $73,286.
West End
South Shore, South from Mahogany Road,
East to Williams Delight
Residential
Compared to 9 years ago, residential inventory decreased by 5 months
(from 2 years to 1.6 years);
average home sale price increased 91%, from $223,800 to $427,541.
Compared to last year, residential inventory increased by 7 months, from 1 year to 1.6 years; average home sale price increased 41% (from $302,275 to $427,541)
Condominium
Compared to 9 years ago, condominium inventory increased by 4 months (from 0.4 years to 0.7 years)
average condominium sales price increased 40% (from $107,714 to $151,333)
Last year, there were no condos for sale in West End quarter on this date; this year there is an 8 month inventory;
average condominium sales price decreased 22%, from $194,500 to $151,333.
Vacant Land
Compared to 9 years ago, land inventory decreased by 12 years,
from 15.6 years to 3.6 years;
average lot sales price increased 8%, from $93,279 to $100,909.
Compared to last year, land inventory increased by 2.2 years, from 1.4 years to 3.6 years; average lot sales price decreased 30%, from $144,391 to $100,909.
Information is from MLS and deemed to be reliable but is not guaranteed.
Prepared by:
Julie San Martin
Team Manage

November 2024
First 10 months of 2020 through 2024
Residential
2020
136 home sales closed January through October; there were 129 homes for sale
1.05 buyers for every seller
2021
183 home sales closed January through October; there were 90 homes for sale
2.03 buyers for every seller
2022
157 home sales closed January through October; there were 96 homes for sale
1.64 buyers for every seller
114 home sales closed January through October; there were 123 homes for sale
0.93 buyers for every seller
2024
127 home sales closed January through October; there were 135 homes for sale
0.94 buyers for every seller
Condominium
2020
71 condominium sales closed January - October; there were 78 condos for sale
0.91 buyers for every seller
2021
131 condominium sales closed January - October; there were 26 condos for sale
5.04 buyers for every seller
2022
127 condominium sales closed January - October; there were 30 condos for sale
4.23 buyers for every seller
2023
82 condominium sales closed January - October; there were 49 condos for sale
1.67 buyers for every seller
2024
84 condominium sales closed January - October; there were 76 condos for sale
1.11 buyers for every seller
Vacant Land
2020
112 land sales closed January through October; there were 391 lots for sale
0.29 buyers for every seller
2021
158 land sales closed January through October; there were 373 lots for sale
0.42 buyers for every seller
2022
175 land sales closed January through October; there were 336 lots for sale
0.52 buyers for every seller
132 land sales closed January through October; there were 332 lots for sale
0.40 buyers for every seller
2024
111 land sales closed January through October; there were 315 lots for sale
0.35 buyers for every seller
SALES BY PRICE RANGE
Residential
|
2024 % of Sales |
2024 Sales |
2023 % of Sales |
2023 Sales |
2022 % of Sales |
2022 Sales |
2021 % of Sales |
2021 Sales |
2020 % of Sales |
2020 Sales |
Sales Price |
|
%14 |
18 |
%19 |
22 |
%11 |
18 |
%16 |
30 |
32% |
44 |
Under $200K |
|
%31 |
39 |
%34 |
39 |
%25 |
33 |
%25 |
45 |
29% |
39 |
$200K - $400K |
|
%17 |
21 |
%14 |
16 |
%21 |
33 |
%17 |
31 |
16% |
22 |
$400K - $600K |
|
%10 |
13 |
%11 |
13 |
%10 |
16 |
%19 |
34 |
10% |
14 |
$600K - $800K |
|
%11 |
14 |
%11 |
12 |
%8 |
13 |
%11 |
21 |
2% |
3 |
$800K - $1 Million |
|
%17 |
22 |
%11 |
12 |
%28 |
44 |
%12 |
22 |
10% |
14 |
Over $1 Million |
Condominium
|
2024 % of Sales |
2024 Sales |
2023 % of Sales |
2023 Sales |
2022 % of Sales |
2022 Sales |
2021 % of Sales |
2021 Sales |
2020 % of Sales |
2020 Sales |
Sales Price |
|
%10 |
8 |
%2 |
2 |
%6 |
8 |
%2 |
2 |
7% |
5 |
Under $100K |
|
%15 |
13 |
%28 |
23 |
%23 |
29 |
%27 |
36 |
31% |
22 |
$100K - $200K |
|
%27 |
23 |
%29 |
24 |
%31 |
40 |
%33 |
43 |
37% |
26 |
$200K - $300K |
|
%38 |
32 |
%32 |
26 |
%35 |
45 |
%31 |
41 |
22% |
16 |
$300K - $500K |
|
%10 |
8 |
%9 |
7 |
%4 |
5 |
%7 |
9 |
3% |
2 |
Over $500K |
Vacant Land
|
2024 % of Sales |
2024 Sales |
2023 % of Sales |
2023 Sales |
2022 % of Sales |
2022 Sales |
2021 % of Sales |
2021 Sales |
2020 % of Sales |
2020 Sales |
Sales Price |
|
%35 |
39 |
%43 |
57 |
%39 |
68 |
%41 |
65 |
74% |
83 |
Under $50K |
|
%36 |
40 |
%31 |
41 |
%30 |
53 |
%32 |
50 |
12% |
13 |
$50K - $100K |
|
%23 |
25 |
%22 |
29 |
%23 |
41 |
%23 |
36 |
10% |
11 |
$100K - $300K |
|
%6 |
7 |
%4 |
5 |
%7 |
13 |
%4 |
7 |
4% |
5 |
Over $300K |
Information is from MLS and deemed to be reliable but is not guaranteed.
Prepared by:
Julie San Martin
Team Manager
October 2024
Ten Year Comparison
St Croix Real Estate Inventory Levels
TOTAL INVENTORY
Residential
52% fewer homes (128) than ten years ago.
The highest inventory during this period was 9/15/15 with 265 homes on the market.
Lowest inventory during this period was 9/15/21 with only
88 homes for sale.
Condominium
52% fewer condominiums (67) than ten years ago.
The highest inventory during this period was 9/15/15, with 130 condominiums for sale.
The lowest inventory during this period was 9/15/22 with only 22 condos for sale.
Vacant Land
39% fewer lots (196) than ten years ago.
The highest inventory during this period was 9/15/16 with 535 lots on the market.
9/15/2024 is the lowest inventory of the ten-year period with only.
313 lots for sale.
INVENTORY BY PRICE RANGE
Residential
Under $200,000 listings (9%) are 26% lower than ten years ago as percentage of total inventory. Compared to last year, this segment decreased by 2%.
$200,000 to $400,000 listings (22%) have remained relatively constant over the 10-year period, varying from 33% of inventory (9/15/17) to 22% of inventory (9/15/24).
$400,000 to $600 listings (17%) are 4% higher compared to 10 years ago and the highest for this price range. Lowest was 11% (9/15/16 & 9/15/21).
$600,000 to $800,000 listings (14%) are double the percentage of ten years ago (7%).
$800,000 to $1,000,000 listings (4%) are the same as ten years ago. The highest percentage of the 10-year period was 11% (9/15/21).
Listings over $1,000,000 (33%) have more than doubled over the 10-year period. The lowest level was 9/15/16, at just 13% of total inventory, highest was 33% (9/15/23 & 9/15/24).
Condominium
Under $100,000 listings are currently only 4% of total condo listings, down from a high of 25% (9/15/15 & 9/15/16).
$100,000 to $200,000 listings (12%) decreased by 29% of total inventory when compared to 10 years ago. On 9/15/16, this price range represented 46% of the total condominium inventory.
$200,000 to $300,000 listings are at 29% of total inventory, 11% higher than 10 years ago (18%).
$300,000 to $500,000 listings, at 45% of total inventory, have increased 34% compared to ten years ago. The lowest level was 11% (9/15/15 & 9/13/16).
Listings over $500,000 represent 11% of the total condominium market, an increase of 7% compared to ten years ago.
Vacant Land
Under $50,000 listings (14%) are less than half of 10 years ago (37%). The highest percentage of total inventory (44%) was 9/15/17.
$50,000 to $100,000 listings (37%) have remained relatively constant over the 10-year period.
$100,000 to $300,000 listings (25%) have also remained relatively constant over the ten years. Lowest percentage was 9/15/17, at 22% of total land inventory.
Listings over $300,000 (23%) increased 12% when compared to ten years ago. The lowest levels were 2016 and 2017 when this segment of the market decreased to 9% of total land listings.
Information is from MLS and deemed to be reliable, but is not guaranteed.
information is from MLS and deemed to be reliable, but is not guaranteed.
Prepared by:
Julie San Martin
Team Manager
September 2024
A Tale of Two Islands
St Croix and St Thomas Real Estate Sales
Ten Year Comparison Year to Date
Number of Sales
Residential
Number of residential sales on St Thomas decreased 15% (8 homes) compared to ten years ago. On St Croix, the number of homes sold increased 19% (16 homes) compared to ten years ago.
|
% increase (decrease) Year over year |
St Croix |
% increase (decrease) Year over year |
St Thomas |
Number of Homes Sold |
|
(-25%) |
85 |
(-19%) |
54 |
Jan – Aug 2015 |
|
+38% |
117 |
+37% |
74 |
Jan – Aug 2016 |
|
+5% |
123 |
+4% |
77 |
Jan – Aug 2017 |
|
+3% |
127 |
+9% |
84 |
Jan – Aug 2018 |
|
+6% |
134 |
+1% |
85 |
Jan – Aug 2019 |
|
(-23%) |
103 |
(-35%) |
55 |
Jan – Aug 2020 |
|
+48% |
152 |
+78% |
98 |
Jan – Aug 2021 |
|
(-13%) |
134 |
(-40%) |
70 |
Jan – Aug 2022 |
|
(-34%) |
88 |
(-11%) |
62 |
Jan – Aug 2023 |
|
+15% |
101 |
(-35%) |
46 |
Jan – Aug 2024 |
Condominium
Number of condominium sales increased 6% (4 condos) on St Thomas, compared to ten years ago. On St Croix, the number of condos sold increased 1% (1 condo), compared to ten years ago.
|
% increase (decrease) Year over year |
St Croix |
% increase (decrease) Year over year |
St Thomas |
Number of Condos Sold |
|
(-16%) |
69 |
(-6%) |
66 |
Jan – Aug 2015 |
|
+16% |
80 |
+38% |
91 |
Jan – Aug 2016 |
|
+11% |
89 |
+7% |
98 |
Jan – Aug 2017 |
|
(-19%) |
72 |
(-28%) |
71 |
Jan – Aug 2018 |
|
+36% |
98 |
+32% |
94 |
Jan – Aug 2019 |
|
(-44%) |
55 |
(-32%) |
64 |
Jan – Aug 2020 |
|
+98% |
109 |
+136% |
151 |
Jan – Aug 2021 |
|
+2% |
111 |
(-49%) |
77 |
Jan – Aug 2022 |
|
(-39%) |
68 |
+14% |
88 |
Jan – Aug 2023 |
|
+3% |
70 |
(-26%) |
70 |
Jan – Aug 2024 |
Vacant Land
Number of vacant land sales on St Thomas decreased 24% (9 lots), compared to ten years ago. On St Croix, land sales increased 108% (51 lots) compared to ten years ago.
|
% increase (decrease) Year over year |
St Croix |
% increase (decrease) Year over year |
St Thomas |
Number of Lots Sold |
|
+57% |
47 |
+27% |
38 |
Jan – Aug 2015 |
|
+15% |
54 |
(-29%) |
27 |
Jan – Aug 2016 |
|
+30% |
70 |
+59% |
43 |
Jan – Aug 2017 |
|
(-12%) |
62 |
(-33%) |
27 |
Jan – Aug 2018 |
|
+55% |
96 |
+37% |
37 |
Jan – Aug 2019 |
|
(-17%) |
80 |
+5% |
39 |
Jan – Aug 2020 |
|
+58% |
126 |
+77% |
69 |
Jan – Aug 2021 |
|
+17% |
147 |
(-17%) |
57 |
Jan – Aug 2022 |
|
(-28%) |
106 |
(-21%) |
45 |
Jan – Aug 2023 |
|
(-8%) |
98 |
(-36%) |
29 |
Jan – Aug 2024 |
Residential
Average Sales Price
The average St Thomas residential sales price increased 28% ($191,844) compared to ten years ago. On St Croix, the average home sales price increased 30% ($126,949) when compared to ten years ago.
|
% increase (decrease) Year over year |
St Croix |
% increase (decrease) Year over year |
St Thomas |
Average Home Sales Price |
|
+28% |
$426,719 |
(-11%) |
$689,658 |
Jan – Aug 2015 |
|
(-18%) |
$350,076 |
(-14%) |
$594,317 |
Jan – Aug 2016 |
|
+12% |
$393,754 |
(-2%) |
$583,676 |
Jan – Aug 2017 |
|
(-32%) |
$342,041 |
(-10%) |
$524,735 |
Jan – Aug 2018 |
|
+18% |
$403,103 |
+27% |
$666,577 |
Jan – Aug 2019 |
|
+8% |
$437,163 |
+6% |
$709,626 |
Jan – Aug 2020 |
|
+36% |
$594,970 |
+26% |
$896,493 |
Jan – Aug 2021 |
|
+47% |
874,628$ |
+20% |
1,078,479$ |
Jan – Aug 2022 |
|
(-38%) |
545,642$ |
+8% |
1,167,194$ |
Jan – Aug 2023 |
|
+1% |
$553,668 |
(-24%) |
881,502$ |
Jan – Aug 2023 |
St Thomas Home Sales Prices
|
|
Lowest |
Highest |
|
Jan – Aug 2015 |
$85,000 |
$6,000,000 |
|
Jan – Aug 2016 |
$49,000 |
$2,990,000 |
|
Jan – Aug 2017 |
$9,000 |
$3,200,000 |
|
Jan – Aug 2018 |
$55,000 |
$3,150,000 |
|
Jan – Aug 2019 |
$40,000 |
$5,650,000 |
|
Jan – Aug 2020 |
$81,000 |
$2,800,000 |
|
Jan – Aug 2021 |
$80,000 |
$5,900,000 |
|
Jan – Aug 2022 |
$80,000 |
$3,400,000 |
|
Jan – Aug 2023 |
$150,000 |
$4,500,000 |
|
Jan – Aug 2024 |
$180,000 |
$3,750,000 |
St Croix Home Sales Prices
|
|
Lowest |
Highest |
|
Jan – Aug 2015 |
$31,000 |
$6,250,000 |
|
Jan – Aug 2016 |
$40,000 |
$2,500,000 |
|
Jan – Aug 2017 |
$17,000 |
$2,212,500 |
|
Jan – Aug 2018 |
$37,500 |
$1,600,000 |
|
Jan – Aug 2019 |
$35,000 |
$2,975,000 |
|
Jan – Aug 2020 |
$35,000 |
$1,900,000 |
|
Jan – Aug 2021 |
$55,000 |
$2,500,000 |
|
Jan – Aug 2022 |
$55,000 |
$9,500,000 |
|
Jan – Aug 2023 |
$34,000 |
$3,200,000 |
|
Jan – Aug 2024 |
$50,000 |
$2,250,000 |
Median sales price is the midpoint - half of all homes sold for more than this price, half sold for less.
For St Thomas, the median home sales price is 32% higher ($158,000) compared to ten years ago. On St Croix, the median home sales price increased 61% ($155,000) when compared to ten years ago.
Median Home Sales Price
|
% increase (decrease) Year over year |
St Croix |
% increase (decrease) Year over year |
St Thomas |
Median Home Sales Price |
|
(-15%) |
$255,000 |
No change |
$492,000 |
Jan – Aug 2015 |
|
(-14%) |
$220,000 |
No change |
$492,500 |
Jan – Aug 2016 |
|
+27% |
$280,000 |
(-18%) |
$405,000 |
Jan – Aug 2017 |
|
No change |
$279,000 |
(-6%) |
$380,000 |
Jan – Aug 2018 |
|
No change |
$280,500 |
+6% |
$405,000 |
Jan – Aug 2019 |
|
+16% |
$325,000 |
+14% |
$568,060 |
Jan – Aug 2020 |
|
+49% |
$485,000 |
+18% |
$667,500 |
Jan – Aug 2021 |
|
+16% |
$562,000 |
+31% |
$875,000 |
Jan – Aug 2022 |
|
(-36%) |
$362,500 |
+2% |
$895,000 |
Jan – Aug 2023 |
|
+13% |
$410,000 |
(-27%) |
$650,000 |
Jan – Aug 2024 |
Condominium
Average Sales Price
The average St Thomas condominium sales price increased 71% ($162,163) compared to ten years ago. On St Croix, average sales price increased 42% ($84,485) when compared to ten years ago.
|
% increase (decrease) Year over year |
St Croix |
% increase (decrease) Year over year |
St Thomas |
Average condo Sales Price |
|
+30% |
$202,402 |
+3% |
$227,064 |
Jan – Aug 2015 |
|
(-17%) |
$168,023 |
+21% |
$274,901 |
Jan – Aug 2016 |
|
(-2%) |
$164,630 |
(-7%) |
$254,416 |
Jan – Aug 2017 |
|
+23% |
$203,095 |
(-1%) |
$252,387 |
Jan – Aug 2018 |
|
+2% |
$207,834 |
(-1%) |
$250,208 |
Jan – Aug 2019 |
|
+17% |
$243,895 |
+5% |
$263,459 |
Jan – Aug 2020 |
|
+18% |
$287,464 |
+29% |
$339,825 |
Jan – Aug 2021 |
|
(-1%) |
$283,594 |
+12% |
$380,683 |
Jan – Aug 2022 |
|
+3% |
$291,081 |
+14% |
$432,682 |
Jan – Aug 2023 |
|
(-1%) |
$286,887 |
(-10%) |
$389,227 |
Jan – Aug 2024 |
St Thomas Condominium Sales Prices
|
|
Lowest |
Highest |
|
Jan – Aug 2015 |
$55,000 |
$940,000 |
|
Jan – Aug 2016 |
$30,000 |
$1,690,000 |
|
Jan – Aug 2017 |
$24,000 |
$665,000 |
|
Jan – Aug 2018 |
$53,000 |
$780,000 |
|
Jan – Aug 2019 |
$72,000 |
$600,000 |
|
Jan – Aug 2020 |
$119,000 |
$730,000 |
|
Jan – Aug 2021 |
$21,000 |
$1,437,500 |
|
Jan – Aug 2022 |
$65,000 |
$1,600,000 |
|
Jan – Aug 2023 |
$77,000 |
$1,193,000 |
|
Jan – Aug 2024 |
$85,000 |
$850,000 |
St Croix Condominium Sales Prices
|
|
Lowest |
Highest |
|
Jan – Aug 2015 |
$22,500 |
$1,150,000 |
|
Jan – Aug 2016 |
$22,500 |
$700,000 |
|
Jan – Aug 2017 |
$33,000 |
$570,000 |
|
Jan – Aug 2018 |
$34,000 |
$570,000 |
|
Jan – Aug 2019 |
$41,000 |
$650,000 |
|
Jan – Aug 2020 |
$62,000 |
$1,060,000 |
|
Jan – Aug 2021 |
$74,900 |
$1,295,000 |
|
Jan – Aug 2022 |
$69,000 |
$1,000,000 |
|
Jan – Aug 2023 |
$98,000 |
$627,500 |
|
Jan – Aug 2024 |
$62,500 |
$870,000 |
Compared to ten years ago, the median condominium sales price increased 108% ($195,000) on St Thomas and 83% ($125,000) on St Croix.
Median Condominium Sales Price
|
% increase (decrease) Year over year |
St Croix |
% increase (decrease) Year over year |
St Thomas |
Median Condo Sales Price |
|
+26% |
$150,000 |
+9% |
$180,000 |
Jan – Aug 2015 |
|
(-10%) |
$135,000 |
+19% |
$215,000 |
Jan – Aug 2016 |
|
+7% |
$145,000 |
+2% |
$220,000 |
Jan – Aug 2017 |
|
+17% |
$170,000 |
(-10%) |
$198,562 |
Jan – Aug 2018 |
|
+9% |
$185,000 |
+13% |
$225,000 |
Jan – Aug 2019 |
|
+22% |
$225,000 |
(-1%) |
$222,500 |
Jan – Aug 2020 |
|
+16% |
$260,000 |
+30% |
$290,000 |
Jan – Aug 2021 |
|
(-4%) |
$249,500 |
+12% |
$325,000 |
Jan – Aug 2022 |
|
+4% |
$260,000 |
+23% |
$400,000 |
Jan – Aug 2023 |
|
+6% |
$275,000 |
(-6%) |
$375,000 |
Jan – Aug 2024 |
Vacant Land
Average Sales Price
The average St Thomas land sales price increased 115% ($124,867) compared to ten years ago. On St Croix, average land sales price increased 195% ($84,824) compared to ten years ago.
|
% increase (decrease) Year over year |
St Croix |
% increase (decrease) Year over year |
St Thomas |
Average lot Sales Price |
|
(-3%) |
$78,055 |
(-26%) |
$91,737 |
Jan – Aug 2015 |
|
(-2%) |
$76,518 |
+97% |
$181,144 |
Jan – Aug 2016 |
|
(-7%) |
$71,529 |
+24% |
$225,455 |
Jan – Aug 2017 |
|
(-6%) |
$67,655 |
(-51%) |
$110,830 |
Jan – Aug 2018 |
|
(-21%) |
$53,597 |
+55% |
$172,270 |
Jan – Aug 2019 |
|
+53% |
$81,949 |
(-38%) |
$107,410 |
Jan – Aug 2020 |
|
+55% |
$126,840 |
+71% |
$183,522 |
Jan – Aug 2021 |
|
+1% |
$128,249 |
+27% |
$233,224 |
Jan – Aug 2022 |
|
(-6%) |
$120,021 |
+39% |
$325,003 |
Jan – Aug 2023 |
|
(-20%) |
$96,663 |
(-46%) |
$176,272 |
Jan – Aug 2024 |
St Thomas Land Sales Prices
|
|
Lowest |
Highest |
|
Jan – Aug 2015 |
$20,000 |
$370,000 |
|
Jan – Aug 2016 |
$8,000 |
$900,000 |
|
Jan – Aug 2017 |
$20,000 |
$2,100,000 |
|
Jan – Aug 2018 |
$30,000 |
$600,000 |
|
Jan – Aug 2019 |
$35,000 |
$990.000 |
|
Jan – Aug 2020 |
$40,000 |
$375,000 |
|
Jan – Aug 2021 |
$25,000 |
$1,065,000 |
|
Jan – Aug 2022 |
$30,000 |
$2,500,000 |
|
Jan – Aug 2023 |
$65,000 |
$2,800,000 |
|
Jan – Aug 2024 |
$37,500 |
$825,000 |
St Croix Land Sales Prices
|
|
Lowest |
Highest |
|
Jan – Aug 2015 |
$13,000 |
$348,000 |
|
Jan – Aug 2016 |
$16,000 |
$335,000 |
|
Jan – Aug 2017 |
$12,000 |
$500,000 |
|
Jan – Aug 2018 |
$15,000 |
$350,000 |
|
Jan – Aug 2019 |
$14,000 |
$275,000 |
|
Jan – Aug 2020 |
$14,000 |
$999,999 |
|
Jan – Aug 2021 |
$7,000 |
$3,000,000 |
|
Jan – Aug 2022 |
$20,000 |
$2,150,000 |
|
Jan – Aug 2023 |
$5,000 |
$2,100,000 |
|
Jan – Aug 2024 |
$13,000 |
$600,000 |
Median Land Sales Price
On St Thomas, the median lot sales price increased 111% ($94,500) compared to ten years ago. On St Croix, the median lot sales price increased 52% ($21,500) compared to ten years ago.
|
% increase (decrease) Year over year |
St Croix |
% increase (decrease) Year over year |
St Thomas |
Median Lot Sales Price |
|
+1% |
$40,000 |
(-35%) |
$55,000 |
Jan – Aug 2015 |
|
+64% |
$65,500 |
+78% |
$98,000 |
Jan – Aug 2016 |
|
(-43%) |
$37,250 |
(-13%) |
$85,000 |
Jan – Aug 2017 |
|
+7% |
$40,000 |
(-6%) |
$80,000 |
Jan – Aug 2018 |
|
No change |
$40,000 |
No change |
$80,000 |
Jan – Aug 2019 |
|
(-9%) |
$36,500 |
(-12%) |
$70,000 |
Jan – Aug 2020 |
|
+40% |
$51,000 |
+71% |
$119,500 |
Jan – Aug 2021 |
|
+25% |
$64,000 |
+5% |
$125,000 |
Jan – Aug 2022 |
|
(-6%) |
$60,000 |
+44% |
$179,500 |
Jan – Aug 2023 |
|
(-2%) |
$59,000 |
(-19%) |
$145,000 |
Jan – Aug 2023 |
Total Market (Millions)
The St Thomas total residential market increased 9% ($3.4 million) compared to ten years ago. On St Croix, total residential market increased 54% ($19.6 million) compared to ten years ago.
Residential
|
% increase (decrease) Year over year |
St Croix |
% increase (decrease) Year over year |
St Thomas |
Number of Homes Sold |
|
(-4%) |
$36.3 |
(-28%) |
$37.2 |
Jan – Aug 2015 |
|
+13% |
$41.0 |
+18% |
$44.0 |
Jan – Aug 2016 |
|
+18% |
$48.4 |
+2% |
$44.9 |
Jan – Aug 2017 |
|
(-10%) |
$43.4 |
(-2%) |
$44.1 |
Jan – Aug 2018 |
|
+24% |
$54.0 |
+29% |
$56.7 |
Jan – Aug 2019 |
|
(-17%) |
$45.0 |
(-31%) |
$39.0 |
Jan – Aug 2020 |
|
+101% |
$90.4 |
+125% |
$87.9 |
Jan – Aug 2021 |
|
+130% |
$117.2 |
(-14%) |
$75.5 |
Jan – Aug 2022 |
|
(-59%) |
$48.0 |
(-4%) |
$72.4 |
Jan – Aug 2023 |
|
+16% |
$55.9 |
(-44%) |
$40.6 |
Jan – Aug 2024 |
The St Thomas total condominium market increased 81% ($12.2 million) compared to ten years ago. On St Croix, the total condominium market increased 44% ($6.1 million) compared to ten years ago.
Condominium
|
% increase (decrease) Year over year |
St Croix |
% increase (decrease) Year over year |
St Thomas |
Number of Condos Sold |
|
+10% |
$14.0 |
(-3%) |
$15.0 |
Jan – Aug 2015 |
|
(-4%) |
$13.4 |
+67% |
$25.0 |
Jan – Aug 2016 |
|
+9% |
$14.6 |
No change |
$24.9 |
Jan – Aug 2017 |
|
No change |
$14.6 |
(-38%) |
$17.9 |
Jan – Aug 2018 |
|
+40% |
$20.4 |
+31% |
$23.5 |
Jan – Aug 2019 |
|
(-34%) |
$13.4 |
(-28%) |
$16.9 |
Jan – Aug 2020 |
|
+134% |
$31.3 |
+203% |
$51.3 |
Jan – Aug 2021 |
|
+1% |
$31.5 |
(-43%) |
$29.3 |
Jan – Aug 2022 |
|
(-37%) |
$19.8 |
+30% |
$38.1 |
Jan – Aug 2023 |
|
+2% |
$20.1 |
(-29%) |
$27.2 |
Jan – Aug 2024 |
The St Thomas total land market increased 46% ($1.6 million) compared to ten years ago. On St Croix, total land market increased 157% ($5.8 million) compared to ten years ago.
Vacant Land
|
increase (decrease) Year over year |
St Croix |
% increase (decrease) Year over year |
St Thomas |
Number of Lots Sold |
|
+54% |
$3.7 |
(-8%) |
$3.5 |
Jan – Aug 2015 |
|
+11% |
$4.1 |
+40% |
$4.9 |
Jan – Aug 2016 |
|
+24% |
$5.1 |
+102% |
$9.9 |
Jan – Aug 2017 |
|
(-18%) |
$4.2 |
(-70%) |
$3.0 |
Jan – Aug 2018 |
|
+45% |
$6.1 |
+113% |
$6.4 |
Jan – Aug 2019 |
|
+8% |
$6.6 |
(-34%) |
$4.2 |
Jan – Aug 2020 |
|
+186% |
$18.9 |
+202% |
$12.7 |
Jan – Aug 2021 |
|
(-1%) |
$18.8 |
+5% |
$13.3 |
Jan – Aug 2022 |
|
(-32%) |
$12.7 |
+10% |
$14.6 |
Jan – Aug 2023 |
|
(-25%) |
$9.5 |
(-66%) |
$5.1 |
Jan – Aug 2024 |
A Tale of Two Islands
St Croix and St Thomas Real Estate Sales
Ten Year Comparison Year to Date
Number of Sales
Residential
Number of residential sales on St Thomas decreased 15% (8 homes) compared to ten years ago. On St Croix, the number of homes sold increased 19% (16 homes) compared to ten years ago.
|
% increase (decrease) Year over year |
St Croix |
% increase (decrease) Year over year |
St Thomas |
Number of Homes Sold |
|
(-25%) |
85 |
(-19%) |
54 |
Jan – Aug 2015 |
|
+38% |
117 |
+37% |
74 |
Jan – Aug 2016 |
|
+5% |
123 |
+4% |
77 |
Jan – Aug 2017 |
|
+3% |
127 |
+9% |
84 |
Jan – Aug 2018 |
|
+6% |
134 |
+1% |
85 |
Jan – Aug 2019 |
|
(-23%) |
103 |
(-35%) |
55 |
Jan – Aug 2020 |
|
+48% |
152 |
+78% |
98 |
Jan – Aug 2021 |
|
(-13%) |
134 |
(-40%) |
70 |
Jan – Aug 2022 |
|
(-34%) |
88 |
(-11%) |
62 |
Jan – Aug 2023 |
|
+15% |
101 |
(-35%) |
46 |
Jan – Aug 2024 |
Condominium
Number of condominium sales increased 6% (4 condos) on St Thomas, compared to ten years ago. On St Croix, the number of condos sold increased 1% (1 condo), compared to ten years ago.
|
% increase (decrease) Year over year |
St Croix |
% increase (decrease) Year over year |
St Thomas |
Number of Condos Sold |
|
(-16%) |
69 |
(-6%) |
66 |
Jan – Aug 2015 |
|
+16% |
80 |
+38% |
91 |
Jan – Aug 2016 |
|
+11% |
89 |
+7% |
98 |
Jan – Aug 2017 |
|
(-19%) |
72 |
(-28%) |
71 |
Jan – Aug 2018 |
|
+36% |
98 |
+32% |
94 |
Jan – Aug 2019 |
|
(-44%) |
55 |
(-32%) |
64 |
Jan – Aug 2020 |
|
+98% |
109 |
+136% |
151 |
Jan – Aug 2021 |
|
+2% |
111 |
(-49%) |
77 |
Jan – Aug 2022 |
|
(-39%) |
68 |
+14% |
88 |
Jan – Aug 2023 |
|
+3% |
70 |
(-26%) |
70 |
Jan – Aug 2024 |
Vacant Land
Number of vacant land sales on St Thomas decreased 24% (9 lots), compared to ten years ago. On St Croix, land sales increased 108% (51 lots) compared to ten years ago.
|
% increase (decrease) Year over year |
St Croix |
% increase (decrease) Year over year |
St Thomas |
Number of Lots Sold |
|
+57% |
47 |
+27% |
38 |
Jan – Aug 2015 |
|
+15% |
54 |
(-29%) |
27 |
Jan – Aug 2016 |
|
+30% |
70 |
+59% |
43 |
Jan – Aug 2017 |
|
(-12%) |
62 |
(-33%) |
27 |
Jan – Aug 2018 |
|
+55% |
96 |
+37% |
37 |
Jan – Aug 2019 |
|
(-17%) |
80 |
+5% |
39 |
Jan – Aug 2020 |
|
+58% |
126 |
+77% |
69 |
Jan – Aug 2021 |
|
+17% |
147 |
(-17%) |
57 |
Jan – Aug 2022 |
|
(-28%) |
106 |
(-21%) |
45 |
Jan – Aug 2023 |
|
(-8%) |
98 |
(-36%) |
29 |
Jan – Aug 2024 |
Residential
Average Sales Price
The average St Thomas residential sales price increased 28% ($191,844) compared to ten years ago. On St Croix, the average home sales price increased 30% ($126,949) when compared to ten years ago.
|
% increase (decrease) Year over year |
St Croix |
% increase (decrease) Year over year |
St Thomas |
Average Home Sales Price |
|
+28% |
$426,719 |
(-11%) |
$689,658 |
Jan – Aug 2015 |
|
(-18%) |
$350,076 |
(-14%) |
$594,317 |
Jan – Aug 2016 |
|
+12% |
$393,754 |
(-2%) |
$583,676 |
Jan – Aug 2017 |
|
(-32%) |
$342,041 |
(-10%) |
$524,735 |
Jan – Aug 2018 |
|
+18% |
$403,103 |
+27% |
$666,577 |
Jan – Aug 2019 |
|
+8% |
$437,163 |
+6% |
$709,626 |
Jan – Aug 2020 |
|
+36% |
$594,970 |
+26% |
$896,493 |
Jan – Aug 2021 |
|
+47% |
874,628$ |
+20% |
1,078,479$ |
Jan – Aug 2022 |
|
(-38%) |
545,642$ |
+8% |
1,167,194$ |
Jan – Aug 2023 |
|
+1% |
$553,668 |
(-24%) |
881,502$ |
Jan – Aug 2023 |
St Thomas Home Sales Prices
|
|
Lowest |
Highest |
|
Jan – Aug 2015 |
$85,000 |
$6,000,000 |
|
Jan – Aug 2016 |
$49,000 |
$2,990,000 |
|
Jan – Aug 2017 |
$9,000 |
$3,200,000 |
|
Jan – Aug 2018 |
$55,000 |
$3,150,000 |
|
Jan – Aug 2019 |
$40,000 |
$5,650,000 |
|
Jan – Aug 2020 |
$81,000 |
$2,800,000 |
|
Jan – Aug 2021 |
$80,000 |
$5,900,000 |
|
Jan – Aug 2022 |
$80,000 |
$3,400,000 |
|
Jan – Aug 2023 |
$150,000 |
$4,500,000 |
|
Jan – Aug 2024 |
$180,000 |
$3,750,000 |
St Croix Home Sales Prices
|
|
Lowest |
Highest |
|
Jan – Aug 2015 |
$31,000 |
$6,250,000 |
|
Jan – Aug 2016 |
$40,000 |
$2,500,000 |
|
Jan – Aug 2017 |
$17,000 |
$2,212,500 |
|
Jan – Aug 2018 |
$37,500 |
$1,600,000 |
|
Jan – Aug 2019 |
$35,000 |
$2,975,000 |
|
Jan – Aug 2020 |
$35,000 |
$1,900,000 |
|
Jan – Aug 2021 |
$55,000 |
$2,500,000 |
|
Jan – Aug 2022 |
$55,000 |
$9,500,000 |
|
Jan – Aug 2023 |
$34,000 |
$3,200,000 |
|
Jan – Aug 2024 |
$50,000 |
$2,250,000 |
Median sales price is the midpoint - half of all homes sold for more than this price, half sold for less.
For St Thomas, the median home sales price is 32% higher ($158,000) compared to ten years ago. On St Croix, the median home sales price increased 61% ($155,000) when compared to ten years ago.
Median Home Sales Price
|
% increase (decrease) Year over year |
St Croix |
% increase (decrease) Year over year |
St Thomas |
Median Home Sales Price |
|
(-15%) |
$255,000 |
No change |
$492,000 |
Jan – Aug 2015 |
|
(-14%) |
$220,000 |
No change |
$492,500 |
Jan – Aug 2016 |
|
+27% |
$280,000 |
(-18%) |
$405,000 |
Jan – Aug 2017 |
|
No change |
$279,000 |
(-6%) |
$380,000 |
Jan – Aug 2018 |
|
No change |
$280,500 |
+6% |
$405,000 |
Jan – Aug 2019 |
|
+16% |
$325,000 |
+14% |
$568,060 |
Jan – Aug 2020 |
|
+49% |
$485,000 |
+18% |
$667,500 |
Jan – Aug 2021 |
|
+16% |
$562,000 |
+31% |
$875,000 |
Jan – Aug 2022 |
|
(-36%) |
$362,500 |
+2% |
$895,000 |
Jan – Aug 2023 |
|
+13% |
$410,000 |
(-27%) |
$650,000 |
Jan – Aug 2024 |
Condominium
Average Sales Price
The average St Thomas condominium sales price increased 71% ($162,163) compared to ten years ago. On St Croix, average sales price increased 42% ($84,485) when compared to ten years ago.
|
% increase (decrease) Year over year |
St Croix |
% increase (decrease) Year over year |
St Thomas |
Average condo Sales Price |
|
+30% |
$202,402 |
+3% |
$227,064 |
Jan – Aug 2015 |
|
(-17%) |
$168,023 |
+21% |
$274,901 |
Jan – Aug 2016 |
|
(-2%) |
$164,630 |
(-7%) |
$254,416 |
Jan – Aug 2017 |
|
+23% |
$203,095 |
(-1%) |
$252,387 |
Jan – Aug 2018 |
|
+2% |
$207,834 |
(-1%) |
$250,208 |
Jan – Aug 2019 |
|
+17% |
$243,895 |
+5% |
$263,459 |
Jan – Aug 2020 |
|
+18% |
$287,464 |
+29% |
$339,825 |
Jan – Aug 2021 |
|
(-1%) |
$283,594 |
+12% |
$380,683 |
Jan – Aug 2022 |
|
+3% |
$291,081 |
+14% |
$432,682 |
Jan – Aug 2023 |
|
(-1%) |
$286,887 |
(-10%) |
$389,227 |
Jan – Aug 2024 |
St Thomas Condominium Sales Prices
|
|
Lowest |
Highest |
|
Jan – Aug 2015 |
$55,000 |
$940,000 |
|
Jan – Aug 2016 |
$30,000 |
$1,690,000 |
|
Jan – Aug 2017 |
$24,000 |
$665,000 |
|
Jan – Aug 2018 |
$53,000 |
$780,000 |
|
Jan – Aug 2019 |
$72,000 |
$600,000 |
|
Jan – Aug 2020 |
$119,000 |
$730,000 |
|
Jan – Aug 2021 |
$21,000 |
$1,437,500 |
|
Jan – Aug 2022 |
$65,000 |
$1,600,000 |
|
Jan – Aug 2023 |
$77,000 |
$1,193,000 |
|
Jan – Aug 2024 |
$85,000 |
$850,000 |
St Croix Condominium Sales Prices
|
|
Lowest |
Highest |
|
Jan – Aug 2015 |
$22,500 |
$1,150,000 |
|
Jan – Aug 2016 |
$22,500 |
$700,000 |
|
Jan – Aug 2017 |
$33,000 |
$570,000 |
|
Jan – Aug 2018 |
$34,000 |
$570,000 |
|
Jan – Aug 2019 |
$41,000 |
$650,000 |
|
Jan – Aug 2020 |
$62,000 |
$1,060,000 |
|
Jan – Aug 2021 |
$74,900 |
$1,295,000 |
|
Jan – Aug 2022 |
$69,000 |
$1,000,000 |
|
Jan – Aug 2023 |
$98,000 |
$627,500 |
|
Jan – Aug 2024 |
$62,500 |
$870,000 |
Compared to ten years ago, the median condominium sales price increased 108% ($195,000) on St Thomas and 83% ($125,000) on St Croix.
Median Condominium Sales Price
|
% increase (decrease) Year over year |
St Croix |
% increase (decrease) Year over year |
St Thomas |
Median Condo Sales Price |
|
+26% |
$150,000 |
+9% |
$180,000 |
Jan – Aug 2015 |
|
(-10%) |
$135,000 |
+19% |
$215,000 |
Jan – Aug 2016 |
|
+7% |
$145,000 |
+2% |
$220,000 |
Jan – Aug 2017 |
|
+17% |
$170,000 |
(-10%) |
$198,562 |
Jan – Aug 2018 |
|
+9% |
$185,000 |
+13% |
$225,000 |
Jan – Aug 2019 |
|
+22% |
$225,000 |
(-1%) |
$222,500 |
Jan – Aug 2020 |
|
+16% |
$260,000 |
+30% |
$290,000 |
Jan – Aug 2021 |
|
(-4%) |
$249,500 |
+12% |
$325,000 |
Jan – Aug 2022 |
|
+4% |
$260,000 |
+23% |
$400,000 |
Jan – Aug 2023 |
|
+6% |
$275,000 |
(-6%) |
$375,000 |
Jan – Aug 2024 |
Vacant Land
Average Sales Price
The average St Thomas land sales price increased 115% ($124,867) compared to ten years ago. On St Croix, average land sales price increased 195% ($84,824) compared to ten years ago.
|
% increase (decrease) Year over year |
St Croix |
% increase (decrease) Year over year |
St Thomas |
Average lot Sales Price |
|
(-3%) |
$78,055 |
(-26%) |
$91,737 |
Jan – Aug 2015 |
|
(-2%) |
$76,518 |
+97% |
$181,144 |
Jan – Aug 2016 |
|
(-7%) |
$71,529 |
+24% |
$225,455 |
Jan – Aug 2017 |
|
(-6%) |
$67,655 |
(-51%) |
$110,830 |
Jan – Aug 2018 |
|
(-21%) |
$53,597 |
+55% |
$172,270 |
Jan – Aug 2019 |
|
+53% |
$81,949 |
(-38%) |
$107,410 |
Jan – Aug 2020 |
|
+55% |
$126,840 |
+71% |
$183,522 |
Jan – Aug 2021 |
|
+1% |
$128,249 |
+27% |
$233,224 |
Jan – Aug 2022 |
|
(-6%) |
$120,021 |
+39% |
$325,003 |
Jan – Aug 2023 |
|
(-20%) |
$96,663 |
(-46%) |
$176,272 |
Jan – Aug 2024 |
St Thomas Land Sales Prices
|
|
Lowest |
Highest |
|
Jan – Aug 2015 |
$20,000 |
$370,000 |
|
Jan – Aug 2016 |
$8,000 |
$900,000 |
|
Jan – Aug 2017 |
$20,000 |
$2,100,000 |
|
Jan – Aug 2018 |
$30,000 |
$600,000 |
|
Jan – Aug 2019 |
$35,000 |
$990.000 |
|
Jan – Aug 2020 |
$40,000 |
$375,000 |
|
Jan – Aug 2021 |
$25,000 |
$1,065,000 |
|
Jan – Aug 2022 |
$30,000 |
$2,500,000 |
|
Jan – Aug 2023 |
$65,000 |
$2,800,000 |
|
Jan – Aug 2024 |
$37,500 |
$825,000 |
St Croix Land Sales Prices
|
|
Lowest |
Highest |
|
Jan – Aug 2015 |
$13,000 |
$348,000 |
|
Jan – Aug 2016 |
$16,000 |
$335,000 |
|
Jan – Aug 2017 |
$12,000 |
$500,000 |
|
Jan – Aug 2018 |
$15,000 |
$350,000 |
|
Jan – Aug 2019 |
$14,000 |
$275,000 |
|
Jan – Aug 2020 |
$14,000 |
$999,999 |
|
Jan – Aug 2021 |
$7,000 |
$3,000,000 |
|
Jan – Aug 2022 |
$20,000 |
$2,150,000 |
|
Jan – Aug 2023 |
$5,000 |
$2,100,000 |
|
Jan – Aug 2024 |
$13,000 |
$600,000 |
Median Land Sales Price
On St Thomas, the median lot sales price increased 111% ($94,500) compared to ten years ago. On St Croix, the median lot sales price increased 52% ($21,500) compared to ten years ago.
|
% increase (decrease) Year over year |
St Croix |
% increase (decrease) Year over year |
St Thomas |
Median Lot Sales Price |
|
+1% |
$40,000 |
(-35%) |
$55,000 |
Jan – Aug 2015 |
|
+64% |
$65,500 |
+78% |
$98,000 |
Jan – Aug 2016 |
|
(-43%) |
$37,250 |
(-13%) |
$85,000 |
Jan – Aug 2017 |
|
+7% |
$40,000 |
(-6%) |
$80,000 |
Jan – Aug 2018 |
|
No change |
$40,000 |
No change |
$80,000 |
Jan – Aug 2019 |
|
(-9%) |
$36,500 |
(-12%) |
$70,000 |
Jan – Aug 2020 |
|
+40% |
$51,000 |
+71% |
$119,500 |
Jan – Aug 2021 |
|
+25% |
$64,000 |
+5% |
$125,000 |
Jan – Aug 2022 |
|
(-6%) |
$60,000 |
+44% |
$179,500 |
Jan – Aug 2023 |
|
(-2%) |
$59,000 |
(-19%) |
$145,000 |
Jan – Aug 2023 |
Total Market (Millions)
The St Thomas total residential market increased 9% ($3.4 million) compared to ten years ago. On St Croix, total residential market increased 54% ($19.6 million) compared to ten years ago.
Residential
|
% increase (decrease) Year over year |
St Croix |
% increase (decrease) Year over year |
St Thomas |
Number of Homes Sold |
|
(-4%) |
$36.3 |
(-28%) |
$37.2 |
Jan – Aug 2015 |
|
+13% |
$41.0 |
+18% |
$44.0 |
Jan – Aug 2016 |
|
+18% |
$48.4 |
+2% |
$44.9 |
Jan – Aug 2017 |
|
(-10%) |
$43.4 |
(-2%) |
$44.1 |
Jan – Aug 2018 |
|
+24% |
$54.0 |
+29% |
$56.7 |
Jan – Aug 2019 |
|
(-17%) |
$45.0 |
(-31%) |
$39.0 |
Jan – Aug 2020 |
|
+101% |
$90.4 |
+125% |
$87.9 |
Jan – Aug 2021 |
|
+130% |
$117.2 |
(-14%) |
$75.5 |
Jan – Aug 2022 |
|
(-59%) |
$48.0 |
(-4%) |
$72.4 |
Jan – Aug 2023 |
|
+16% |
$55.9 |
(-44%) |
$40.6 |
Jan – Aug 2024 |
The St Thomas total condominium market increased 81% ($12.2 million) compared to ten years ago. On St Croix, the total condominium market increased 44% ($6.1 million) compared to ten years ago.
Condominium
|
% increase (decrease) Year over year |
St Croix |
% increase (decrease) Year over year |
St Thomas |
Number of Condos Sold |
|
+10% |
$14.0 |
(-3%) |
$15.0 |
Jan – Aug 2015 |
|
(-4%) |
$13.4 |
+67% |
$25.0 |
Jan – Aug 2016 |
|
+9% |
$14.6 |
No change |
$24.9 |
Jan – Aug 2017 |
|
No change |
$14.6 |
(-38%) |
$17.9 |
Jan – Aug 2018 |
|
+40% |
$20.4 |
+31% |
$23.5 |
Jan – Aug 2019 |
|
(-34%) |
$13.4 |
(-28%) |
$16.9 |
Jan – Aug 2020 |
|
+134% |
$31.3 |
+203% |
$51.3 |
Jan – Aug 2021 |
|
+1% |
$31.5 |
(-43%) |
$29.3 |
Jan – Aug 2022 |
|
(-37%) |
$19.8 |
+30% |
$38.1 |
Jan – Aug 2023 |
|
+2% |
$20.1 |
(-29%) |
$27.2 |
Jan – Aug 2024 |
The St Thomas total land market increased 46% ($1.6 million) compared to ten years ago. On St Croix, total land market increased 157% ($5.8 million) compared to ten years ago.
Vacant Land
|
% increase (decrease) Year over year |
St Croix |
% increase (decrease) Year over year |
St Thomas |
Number of Lots Sold |
|
+54% |
$3.7 |
(-8%) |
$3.5 |
Jan – Aug 2015 |
|
+11% |
$4.1 |
+40% |
$4.9 |
Jan – Aug 2016 |
|
+24% |
$5.1 |
+102% |
$9.9 |
Jan – Aug 2017 |
|
(-18%) |
$4.2 |
(-70%) |
$3.0 |
Jan – Aug 2018 |
|
+45% |
$6.1 |
+113% |
$6.4 |
Jan – Aug 2019 |
|
+8% |
$6.6 |
(-34%) |
$4.2 |
Jan – Aug 2020 |
|
+186% |
$18.9 |
+202% |
$12.7 |
Jan – Aug 2021 |
|
(-1%) |
$18.8 |
+5% |
$13.3 |
Jan – Aug 2022 |
|
(-32%) |
$12.7 |
+10% |
$14.6 |
Jan – Aug 2023 |
|
(-25%) |
$9.5 |
(-66%) |
$5.1 |
Jan – Aug 2024 |
Information is from MLS and deemed to be reliable, but is not guaranteed.
Prepared by:
Julie San Martin
Team Manager
August 2024
Sales Price and Marketing Time on St Croix
“Annual Supply” represents the number of years it will take at the current annual rate of sales to sell all the properties for sale
in a specific area.
East End B
Far East End
Inventory
Ten years ago (July 2015), there was a 1.7-year supply of homes and a 1.1-year supply of condominiums on the market.
Both home and condominium inventory have decreased, compared to 10 years ago.
There is now a 10-month (0.8 year) supply of homes (a decrease of 1.4 years compared to last year) and condominiums (a 4-month increase compared to last year).
Average Sales Price
Average residential sale price ($850,138) is 21% lower than last year ($1,080,000) and 35% higher than 10 years ago ($627,614)
Average condominium sales price ($445,362) is unchanged since last year.
East End A
Christiansted east to Coakley Bay
Inventory
Ten years ago (July 2015), there was a 2.5-year supply of homes and a 0.8-year supply of condominiums on the market.
Inventory decreased by over a year for homes, to a 1.4-year supply, an increase of 4 months compared to last year.
Inventory increased by 4 months for condominiums, compared to 10 years ago and since last year.
Average Sales Price
Average residential sale price ($709,182) is 35% lower than last year ($1,094,289) and 21% higher than ten years ago ($583,750).
Condominium average sale price ($337,338) is 2% higher than last year ($331,500) and 39% higher than ten years ago ($243,087).
Company
Christiansted west to east side of Judiths Fancy
Inventory
Ten years ago (July 2015), there was a 2.7-year supply of homes and a 1.5-year supply of condominiums on the market.
Residential inventory decreased by 1 year, to a 1.7-year supply of homes, an increase of 8 months compared to last year.
Condominium inventory decreased by 11 months, to an 11-month supply of condominiums for sale, an increase of 4 months compared to last year.
Average Sales Price
Average home sale price decreased 15% ($74,571) compared to the previous year, from $481,781 to $407,210.
Compared to 10 years ago, the average home sales price increased 12% ($44,243).
Average condominium sale price increased 106% compared to 10 years ago, from $121,009 to $249,792.
Since last year, average condominium sale price decreased 3% ($8,966).
Queen
Constitution Hill west to La Reine, includes southwest Judiths Fancy
Inventory
Ten years ago (July 2015), there was a 3.6-year supply of homes and a 6.7-year supply of condominiums on the market.
Home inventory decreased by 1.7 years, to a 1.9-year supply over the ten-year period. Since last year, home inventory increased by 1.1 years.
Condominium inventory decreased by 6.1 years over the 10-year period. Since last year, inventory increased by 1 month.
Average Sales Price
Average residential sale price increased 56% over the ten-year period, from $278,188 in 2015 to $434,000 for the 12 months ending July 2024. Average residential sales price increased $28,422 (7%) since last year.
Average condo sale price increased 59% ($72,833) over the ten-year period, from
$123,167 in 2015 to $196,000 for the 12 months ending July 2024.
Since last year, average condominium sales price increased 10% ($17,913).
Northside A & B
North shore from north Judiths Fancy west to Hamms Bluff
Inventory
Ten years ago (July 2015), there was a 2.8-year supply of homes and a 2.5-year supply of condominiums on the market.
Residential inventory decreased by 1.1 years, to a 1.7 year supply of homes.
Compared to last year, residential inventory is unchanged.
Condominium inventory decreased by 2.5 years, to no condominiums on the market.
Last year there was a 6-month inventory of condominiums on the market.
Average Sales Price
Average home sale price ($1,291,023) increased by $742,467 (135%), compared to ten years ago ($548,556). Average home sale price increased $275,750 (27%) since last year ($1,015,273).
Average condominium sales price increased $290,203 (124%) over the ten-year period, from $234,083 for the 12 months ending July 2015 to $524,286 for the 12 months ending July 2024, the highest average sale price of the 10-year period.
Compared to last year, the average condominium sale price increased $8,018 (2%).
King
South shore from La Reine west to UVI
Inventory
Ten years ago (July 2014), there was a 2.3-year supply of homes.
There are no condominiums in King Quarter.
Residential inventory decreased 1.7 years, compared to ten years ago, to 7 months of inventory for the 12 months ending July 2024.
Average Sales Price
Average home sale price increased $136,389 (95%) over the ten-year period, from $143,688 for the 12 months ending July 2015 to $280,077 for the 12-months
ending July 2024.
Average home sale price increased $53,349 (24%) compared to last year ($226,728).
Prince
South shore from UVI west to Williams Delight
Inventory
Ten years ago (July 2015), there was a 1.6-year supply of homes and a 2.3-year supply of condominiums on the market.
Residential inventory decreased by 1.1 years, to a 6-month supply of homes, a increase of 6-months compared to the previous year.
Condominium inventory decreased 1.6 years to an 8-month supply, an increase of 5 months compared to the previous year.
Average Sales Price
Home sale average price increased $140,494 (87%) when compared to ten years ago, from $162,000 for the 12 months ending July 2015 to $302,494
for the 12 months ending July 2024.
Average home sale price increased $29,414 (11%) compared to last year ($273,080).
Condominiums experienced a $232,333 (124%) increase in average sale price over the ten-year period, from $187,667 for the 12 months ending July 2015 to
$420,000 for the 12 months ending July 2024.
Average condo sales price increased $41,002 (11%) since last year
West End
South from Mahogany Road, East to Williams Delight
Inventory
Ten years ago (July 2015), there was a 2.4-year supply of homes and a 10-month supply of condominiums on the market.
Over the ten-year period, residential inventory decreased 1.1 years, to a 1.3-year supply of homes for the 12 months ending July 2024, an increase of 4 months compared to the previous year.
Condominium inventory decreased by 1 month, compared to 10 years ago. Compared to last year, condominium inventory increased by 1 month.
Average Sales Price
Average home sale price increased $184,609 (85%) over the ten-year period, from $217,023 for the 12 months ending July 2015 to $401,632 for the
12 months ending July 2024, a $27,058 (7%) increase over last year ($374,574).
Average condominium sale price increased $115,200 (122%) over the ten-year period, from $94,800 for the 12 months ending July 2015 to $210,000
for the 12 months ending July 2024.
Compared to last year, the average condominium average sale price increased $92,000 (78%) over the previous year ($118.000).
Conclusion
The average home sale price is more than $1 Million in one quarter:
· Northside A & B
These two quarters have average sale prices in the $750,000 range:
· East End B
· East End A
These three quarters have average home sale prices in the $400,000 range:
· Queen
Company
· West End
These two quarters have average sales prices in the $300,000 range:
· Prince
· King
Condominium sales prices were more consistent, with a $328,286 difference between the highest average price (Northside A & B at $524,286) and the lowest.
(Queen at $196,000)
Condominium inventory increased in all quarters. Only East End A has more than a 1-year inventory of condos.
Residential inventory increased in these quarters:
· East End A
· Company
· Queen
· West End
Residential inventory decreased in these quarters:
· East End B
· King
· Prince
Average home sale price increased in these five quarters:
· Queen
· Northside A & B
· King
· Prince
· West End
Average home sale price declined in these three quarters:
· Eat End B
· East End A
· Company
Information is from MLS and deemed to be reliable but is not guaranteed.
Prepared by:
Julie San Martin
Team Manager
July 2024
15 year look at the St Croix Real Estate Market for the 12 month period ending 30 June
St Croix real estate market boom cycle is over.
St Croix real estate market peaked July 2021 / June 2022,
Typically, 10 to 15 years between boom cycles
Total number of properties sold
· Residential – During the past 12 months, the number of homes sold (134) is below the average number of homes sold per year for the 15-year period (152) and close to the number of homes sold 15 years ago during this period (128). Currently there are 162 active home listings and 59 pending home sales, a 27% pending rate.
· Condominiums – During the past 12 months, the number of condominiums sold (99) was slightly higher than the average number of condos sold per year for this 15-year period (97). Twice as many condominiums sold during this period as were sold 15 years ago (49). The current inventory level is 68 active and 21 pending condominiums, a 24% pending rate.
· Land – Number of lots sold (123) during the past 12 months is significantly higher than the average number of lots sold per year for the 15-year period (110). Compared to the same 12 month period 15 years ago (105 lot sales), the current period represents a 17 % increase. In this category there is plenty of inventory with 339 active lot listings and 54 pending lot sales, a 14% pending rate.
Average sales price
· Residential – Average home sales price decreased 4% ($20,733) compared to the previous 12-month period, to $557,026 from $577,759. The 2023 / 2024 average is 25% higher than the average sales price for the 15-year period ($445,673)
· Condominiums – Average condominium sales price ($305,118) is only $1,925 less than the previous year, the highest of the 15-year period, and 41% higher than the 15-year average of $216,244,
· Land – Average lot sales price ($92,149) is 27% lower than the previous 12-month period ($126,444), which was the highest of the 15-year period. The current average sales price is 10% higher than the 15 year average sale price ($84,030).
Total Market
Number of properties sold x Average sales price
· Residential – Downward market readjustment continues. Total residential market declined $10.3 Millon when compared to the previous 12 months, from $84.9 Million to $74.6 Million. The 2023/2024 period did exceed the 15-year average housing market ($69.4 Million) by $5.2 Million (7%).
· Condominiums – The past 12 months’ sales ($30.2 Million) represent a $2 Million (6%) decrease from the 2022/2023 period ($32.2 Million). The 2023/2024 period exceeded the 15-year average condo market ($21.7 Million) by $8.5 Million (39%).
· Land – The past 12 months sales ($11.3 Million) represent a $10.8 Million (49%) decrease from the 2022/2023 period ($22.1 Million). The 2023/2024 period exceeded the 15-year average land market ($10.0 Million) by $1.3 Million (13%).
Conclusion
Compared to 15 years ago, the total St Croix real estate market increased 67%, from $69.4 Million
(July 2009 to June 2010) to $116.1 million
(July 2023 to June 2024)
An average of 4.5% growth per year
Compared to the previous 12-month period, total
St Croix real estate sales decreased by $23.1 Million (20%) from $139.2 Million to $116.1 Million.
The St Croix real estate market boom is over,
the market is readjusting.
Information is from MLS and deemed to be reliable, but is not guaranteed.
Prepared by:
Julie San Martin
Team Manager
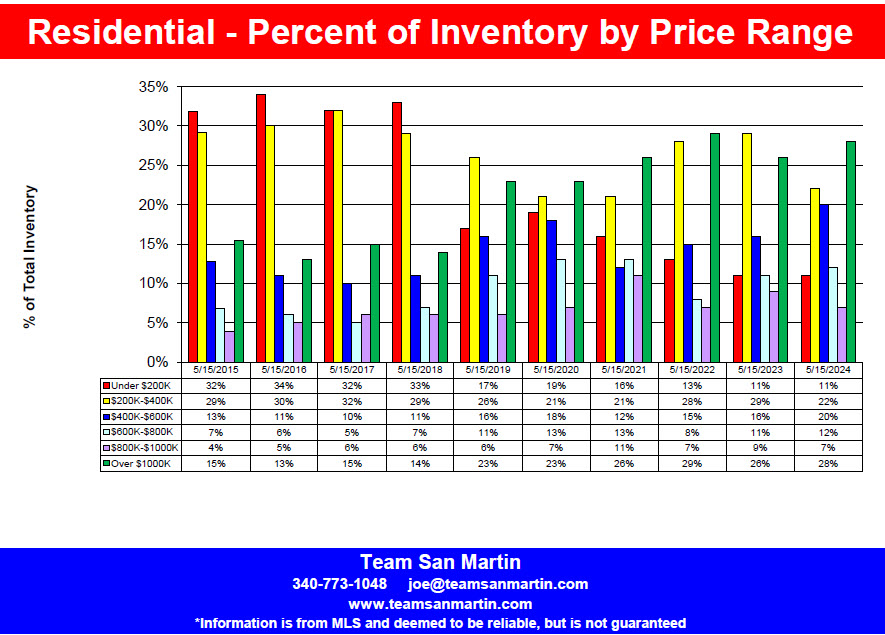
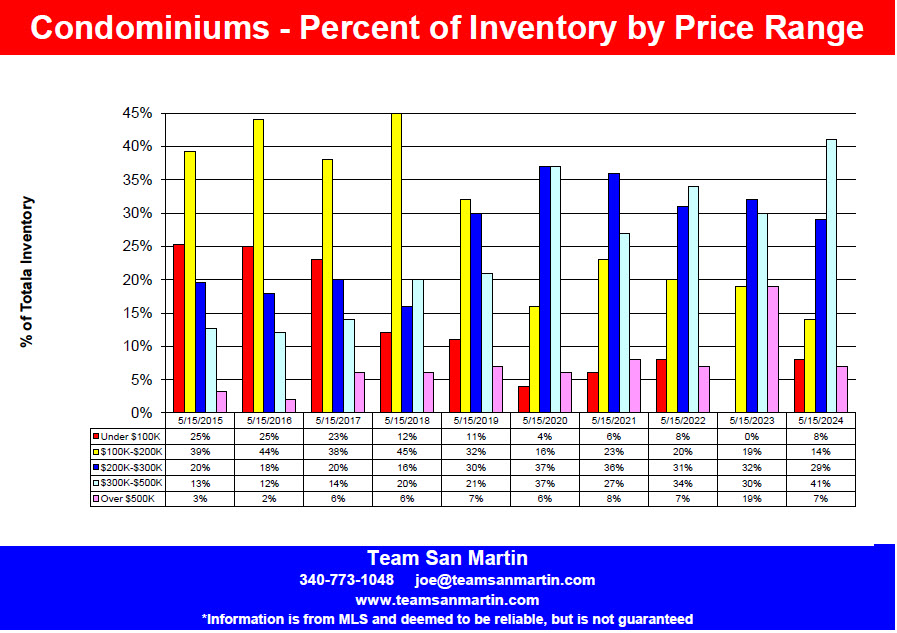
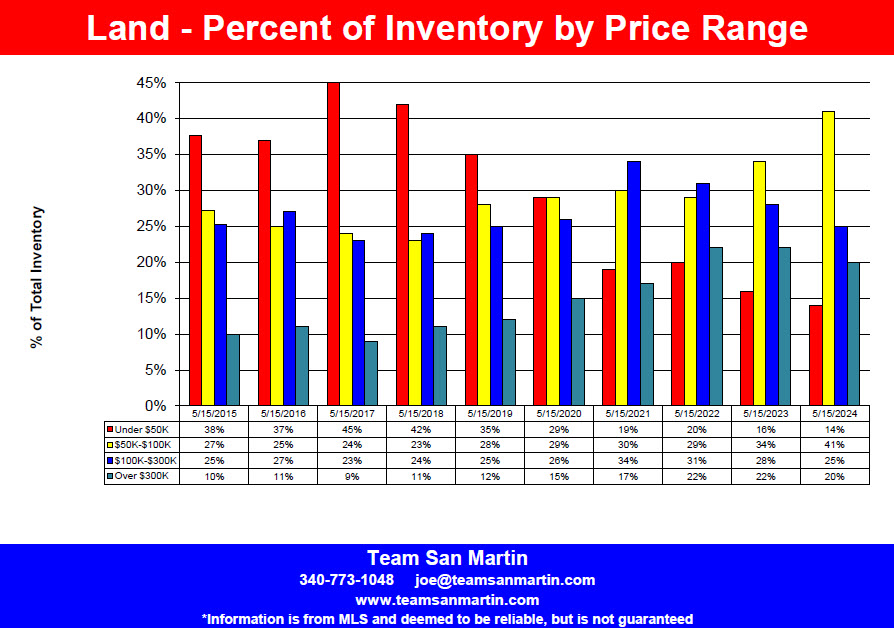
June2024
Changes in the St Croix Real Estate Market
Inventory levels by price range reflect the seller’s expectations.
The attached graphs compare changes in asking prices over the past decade, using 15 May inventory levels.
BIG changes in sellers’ expectations!
Residential
The lowest price range (under $200,000) accounted for about one third of the St Croix residential inventoryfrom 2015 through 2018. This segment now represents only 11% of inventory. 17% of home sales on St Croixover the past 12 months (23 homes) were for $200,000 or less; 11% of inventory accounted for 17% of all home sales.
The second tier ($200,000 to $400,000) consistently accounted for about 30% of inventory through 2019, this segment then declined to 21% of inventory with the exception of 2022 and 2023 when this segment returned to 29% of inventory.36% of St Croix home sales over the past 12 months (48 homes) were between $200,000 and $400,000; 22% of inventory accounted for 36% of sales.
Homes listed for more than $400,000 currently account for two thirds of the inventory, an increase of 28% over the decade. During the past 12 months, this price range accounted for 47% of all homes sold (64 homes).
Homes listed for more than $1,000,000 increased to 28% of the inventory (54 homes), from just 15% a decade ago.During the past 12 months, this price range accounted for 10% (14 homes) of the total 135 homes sold.28% of the inventory accounted for just 10% of home sales.
Condominium
The lowest price range (under $100,000) was 25% of condominiuminventory 10 years ago; by May2024, only 8% of condominiums for sale were listed for less than $100,000.5% of condominium sales (5 condos) on St Croix over the past 12 months were for $100,000 or less.
The second tier ($100,000 to $200,000) consistently included40%of the inventory until 2019. In May 2024 this segment was 14% of total condominium inventory. 22% of all sales over the past 12 months were between $100,000 and $200,000. 14% of inventory accounted for 22% of condominium sales.
Condominiums listed for more than $200,000increased to 77% of inventory, compared to only 36% of condo inventory 10 years ago. 73% of the 108 condominiums sold over the past 12 months were sold for more than $200,000.78% of inventory accounted for 73% of Condominium sales.
Land
The lowest price range (under $50,000) decreased by 24%, compared to 10 years ago, from 38% to 14% of total inventory. 14% of inventory accounted for 42% of sales (62 lots) over the past 12 months.
The middle tier ($50,000 to $300,000) accounted for 52% of land inventory 10 years ago. In May 2024, this segment accounted for 66%, extraordinarily little change.62% of all land sales on St Croix (77 lots) over the past 12 months were between $50,000 and $300,000.
Lots listed for more than $300,000increased 10%, compared to 10 years ago, from 10% to 20% of total listing inventory. 5% of land sales on St Croix over the past 12 months (8 parcels) were sold for more than $300,000. 20% of inventory accounted for 5% of sales over the past 12 months.
Information is from MLS and deemed to be reliable, but is not guaranteed.
Prepared by:
Julie San Martin
Team Manager
May 2024
Inventory Levels and Sales Projections
May Inventory Levels
10 Year Review
Residential
Residential inventory peaked in 2016 with 262 homes for sale and declined through 2022. Current inventory of 143 homes for sale is 55% of the number of homes for sale in 2016.
Condominium
Condominium inventory peaked in 2015 with 134 condominiums for sale and declined through 2022. Condominium inventory reduction is even greater; current inventory of 54 condos is just 40% of 2015 condominium inventory.
Land
Land inventory peaked in 2016 / 2017 with 544 lots for sale and slowly declining through 2023. Current inventory of 349 lots is 64% of the 2016 / 2017 inventory.
May Pending Sale Levels
10 Year Review
Residential
May 2024 residential pending sales (68) exceeds the number of pending residential sales 10 years ago (56) by 21%. The average number of pending residential sales over the 10-year period is 71; the May 2024 number of pending sales (68) is 96% of the 10-year average.
Condominium
May 2024 condominium pending sales (29) exceeds the number of pending contracts 10 years ago (24) by 21%. Current pending condominium sales (29) are 97% of the 10-year average of 30 pending condominium sales.
Land
May 2024 pending land sales (47) are more than double pending contracts 10 years ago (23). Current pending land sales (47) are 98% of the 10-year average of 48 pending land sales in May.
2024 Sales Predictions
Using the assumption that the first 4 months of 2024 are a valid predictor for the entire year.
Residential
The first four months home sales predict 117 home sales during 2024; pending contracts predict 204 home sales during 2024. Inventory levels of 143 homes on the market suggest the lower number to be more likely.
Condominium
The first four months condominium sales predict 78 condominium sales during 2024; pending contracts predict 87 condominium sales during 2024. Inventory levels of only 54 condominiums on the market suggest the lower number to be more likely.
Land
The first four months land sales predict 102 land sales during 2024; pending contracts predict 141 land sales during 2024. With ample land inventory and dwindling home and condo inventory, it is entirely possible there will be 141 land sales during 2024, a 7% reduction from the number of lots sold (151) during 2023.
Information is from MLS and deemed to be reliable, but is not guaranteed.
Prepared by:
Julie San Martin
Team Manager
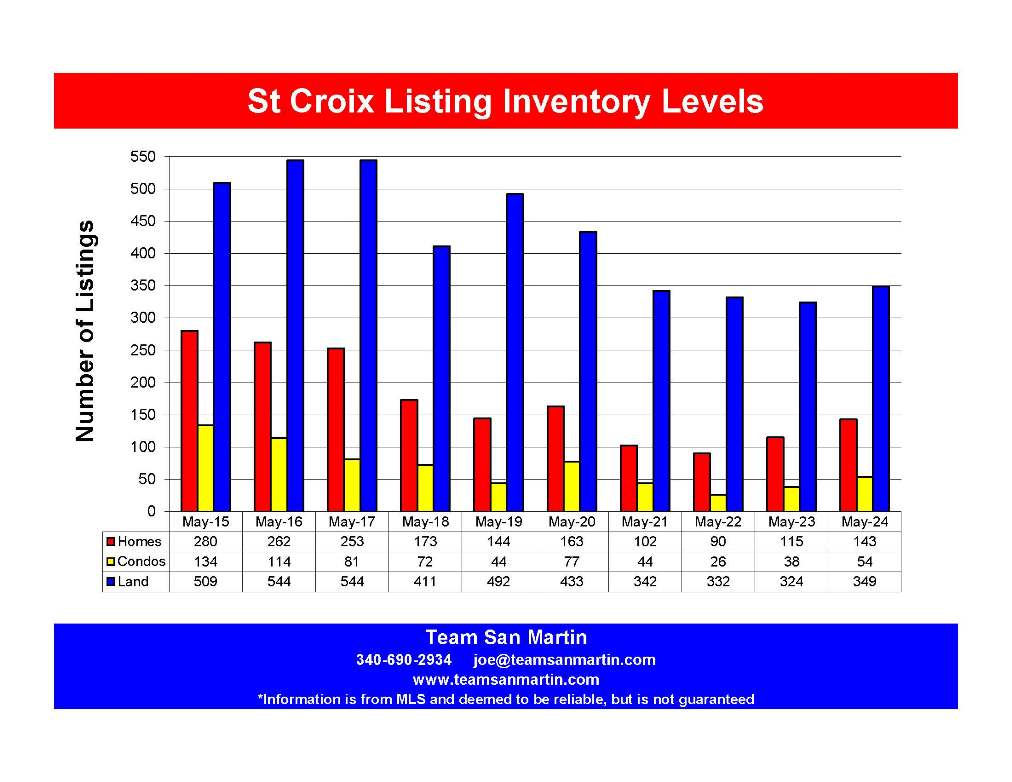
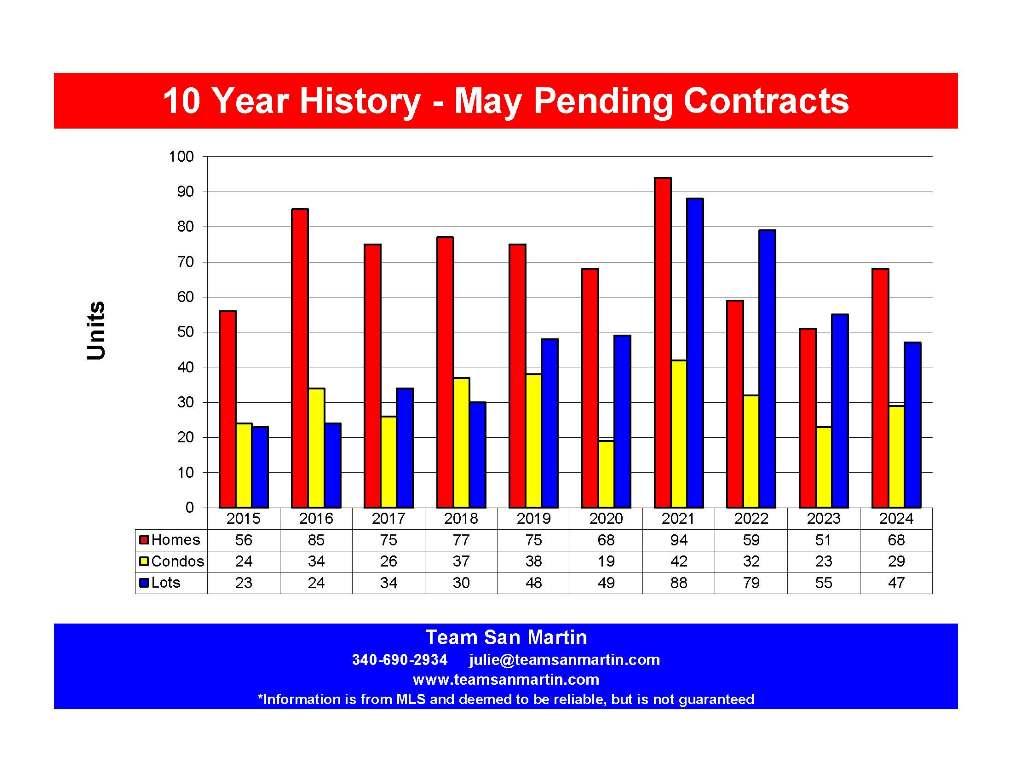
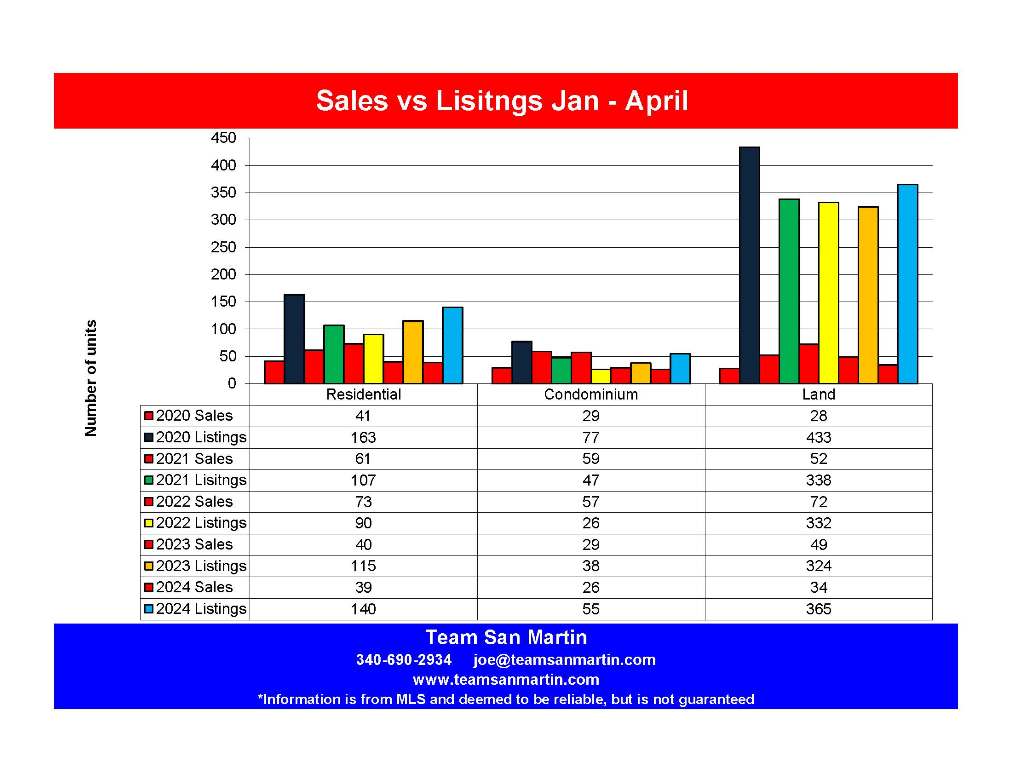
April
1st Quarter Sales as Predictor for the full year
2020 is the 12th year of the St Croix real estate market “recovery” from the real estate boom years of 2006 through 2008. The two Category 5 hurricanes in September 2017 and the 2020 pandemic are not helpful.
The question is – what do the 1st quarter statistics predict about market prospects for the rest of the year?
First, a look at inventory trends over the
12 year period:
· Residential inventory peaked in 2012, with 340 homes for sale, then steadily declined each year to the low point of only 121 homes for sale in 2019. Inventory levels have now returned to the 2018 level of 172 homes for sale.
· Condominium inventory peaked in 2010, with 265 condominiums for sale, then steadily declined each year to the low point of only 46 condos on the market in 2019. The current level of 70 condominiums for sale has not quite returned to the 2018 level.
· Land inventory also peaked in 2010, at 610 lots for sale. Since then, land inventory has been between 566 lots for sale and 443 lots for sale (2020).
Residential Sales & 2020 Predictions
Until 2017 (Irma Maria Hurricanes), the actual number of homes sold annually exceeded the prediction based on 1st quarter sales. In 2018, 1st quarter sales underestimated actual number of homes sales by 40%. In 2019, 1st quarter sales slightly overestimated the total annual sales number. 2020 1st quarter sales predict only 104 home sales for the year, a 47% decrease from 2019.
With the exception of 2009 through 2011, the 1st quarter average sales price was a fairly accurate predictor of the annual home sales price. The 2020 1st quarter average sales price predicts an annual average sales price of nearly $200,000 more than the 2018 average home sales price, but also a significant (47%) decrease in the total number of homes sold.
Here is the prediction for 2020 overall:
· Total number of homes sold will be as predicted, around 104 homes.
· Average sales price will most likely be in the low $400,000 range.
Condominium Sales & 2020 Predictions
This is a much smaller market, with just a few units built since the 1980s. It is more difficult to identify trends, because the sample is significantly smaller.
Beginning in 2014, there have been more than 100 condominium sales annually on St Croix. The prediction for 2020 (76 condominium sales) is a decrease to about 60% of the 2019 number of sales (126).
1st quarter average sale price has, in most cases, overestimated the average annual condominium sales price.
Here is the prediction for 2020 overall:
· Total number of condominiums sold will be in the 70 condo range, approximately the number of condos for sale.
· Average sales price will most likely be in the $250,000 range.
Land Sales & 2020 Predictions
Both predicted and actual number of lots sold have been trending in the right direction since 2014. However, the prediction for 2020 is only 80 annual lot sales, a 45% decrease from 2019.
From 2014 through 2017, the average lot sales price was in the $70,000 range. Since 2018, average sales price dropped about $5,000, to the mid-$60,000 range.
Here is the prediction for 2020 overall:
· Total number of lots sold will be in the 100 range, about 15% lower than 2019.
· The 2020 average lot sales price will be in the $65,000 range, similar to the previous 2 years.
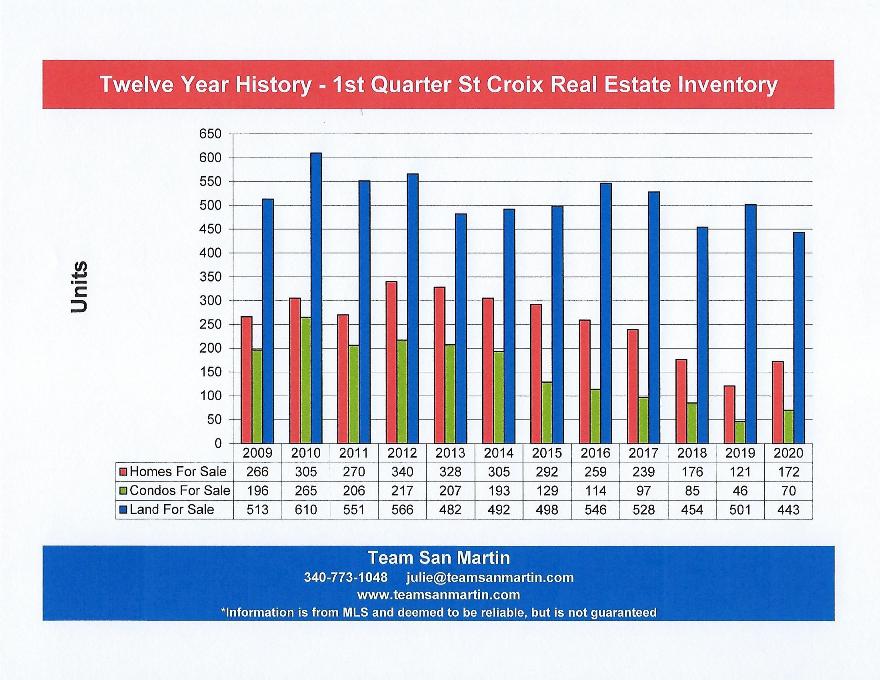
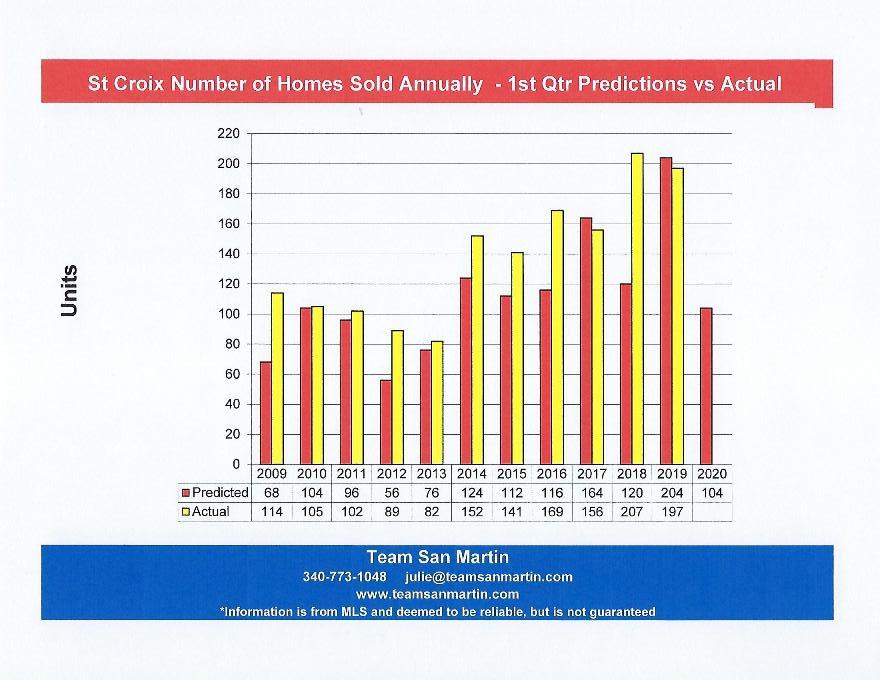
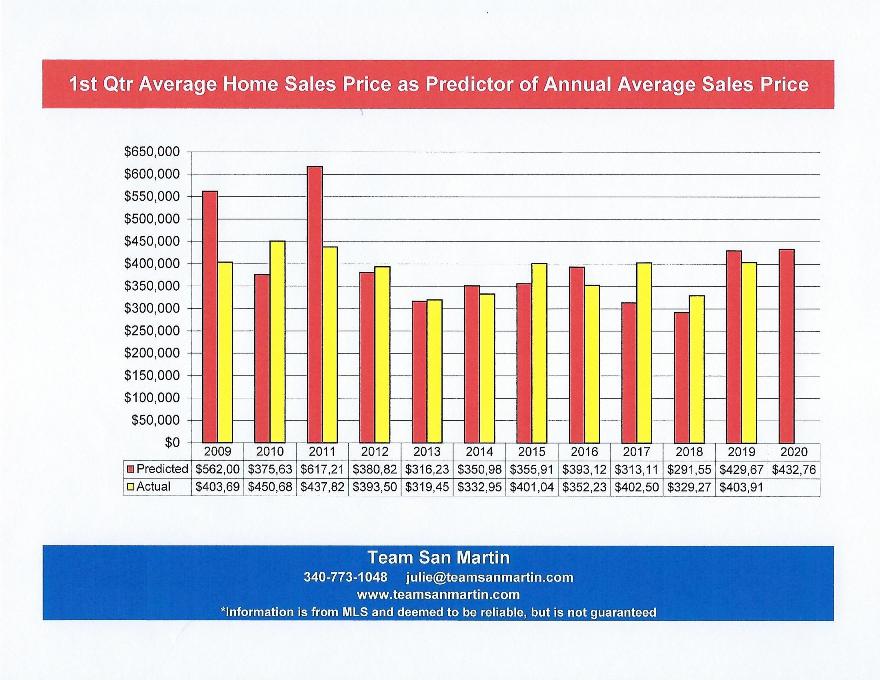
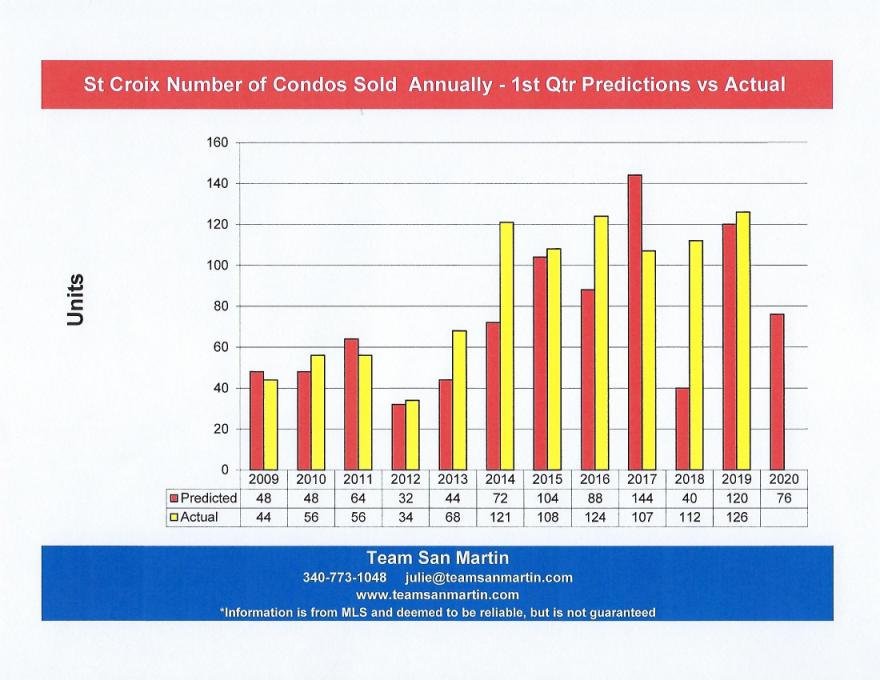
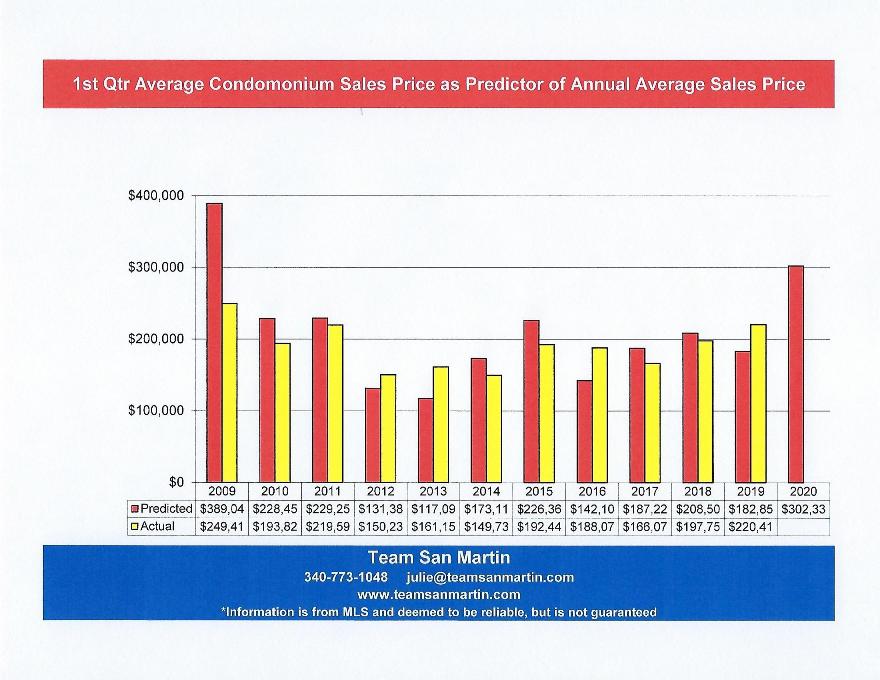
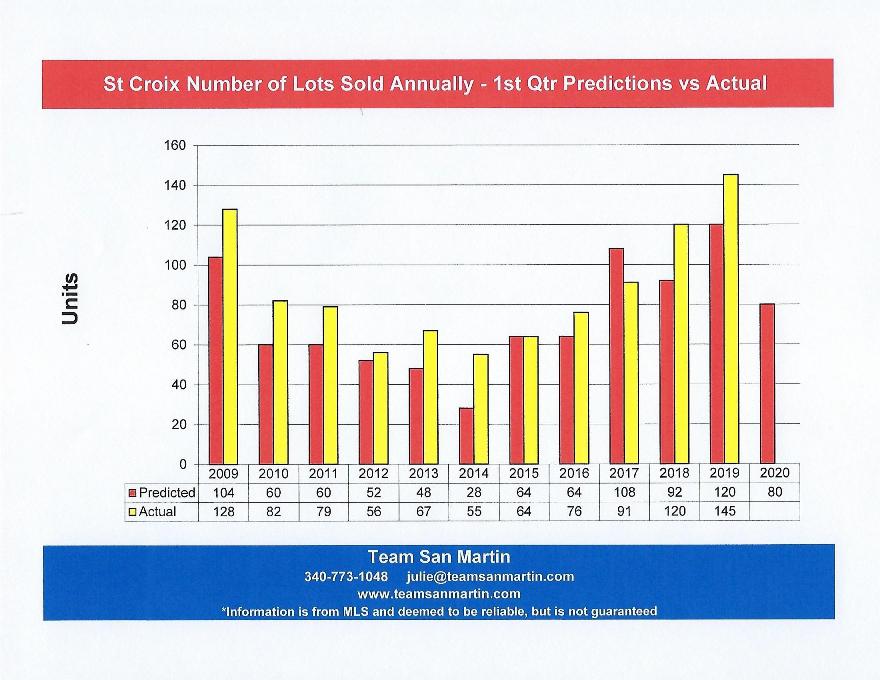
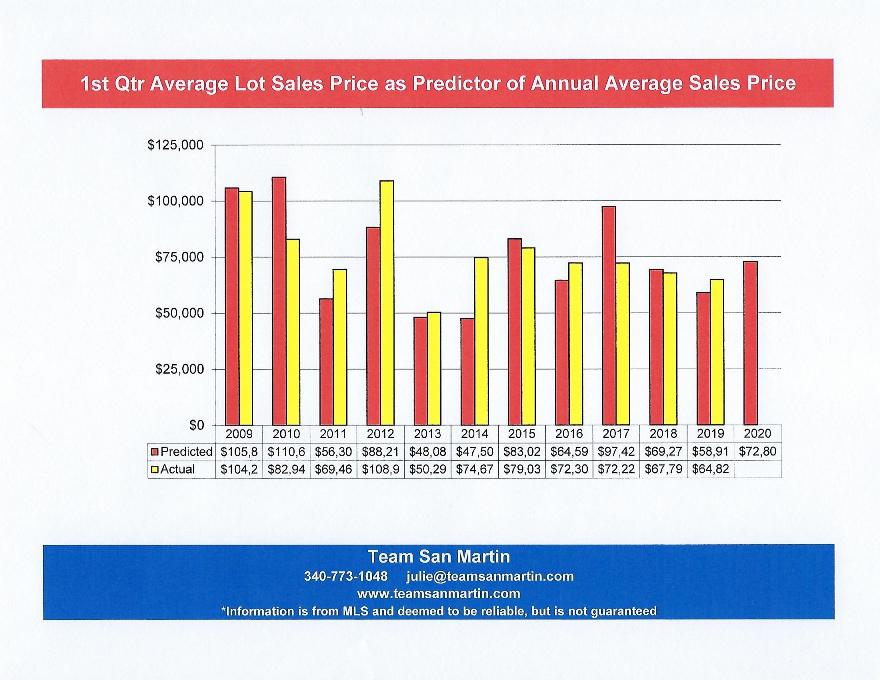
Information is from MLS and deemed to be reliable, but is not guaranteed.
Prepared by:
Julie San Martin
Team Manager
March 2020
Home Sales
St Thomas vs St Croix
A 17 Year Look
Total Number of Properties Sold
· Over the 17 year period, more homes sold every year on St Croix than on St Thomas.
· During 2019, more homes sold on both St Thomas (115) and St Croix (197) than had sold during any of the previous 16 years, with the exception of 2018.
· Over the 17 year period, the fewest number of homes sold on St Croix (88) was during 2012, the fewest number of home sold on St Thomas (53) was during 2011.
· During 2019, 82 more homes were sold on St Croix, when compared to St Thomas.
· Compared to 2018, 18 fewer homes were sold on St Thomas during 2019 and 10 fewer homes were sold on St Croix during 2019.
Average Sales Price
· At the beginning of this 17 year period (2003), average sales prices for St Thomas and St Croix were nearly identical, at an average of $415,823.
· For the past 16 years (since 2004), the annual average home sales price on St Thomas has exceeded that of St Croix.
· For 2019, the average St Thomas homes price was 48% higher, at $617,848, than the 2003 average sales price. The average annual home sales price on St Croix for 2019 was 3% lower, at $403,914, than the 2003 average sales price.
· For 2019, the average sale price of a home on St Croix ($403,914) was 65% of the averages sales price of a home on St Thomas ($617,848).
Total Market in Millions of Dollars
· This measurement is a combination of total homes sold multiplied by average sales price; it gives the best overview of annual market performance.
· During this 17 year period, the total St Thomas residential market exceeded the total St Croix market during six years: 2008, 2012, 2013, 2014, 2015, and 2018.
· During 2019, the total St Croix residential market exceeded the total St Thomas residential market by about $8.6 Million.
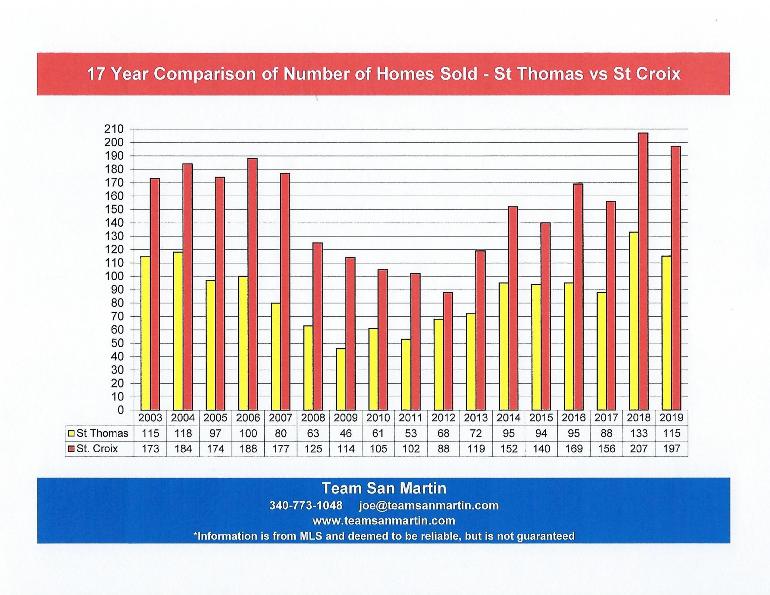
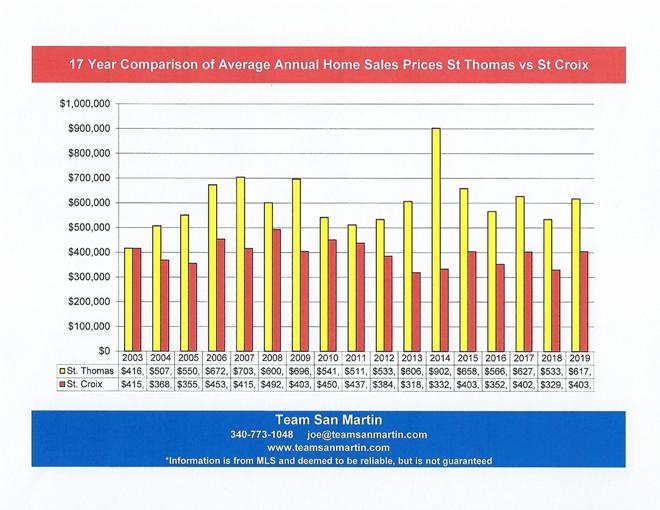
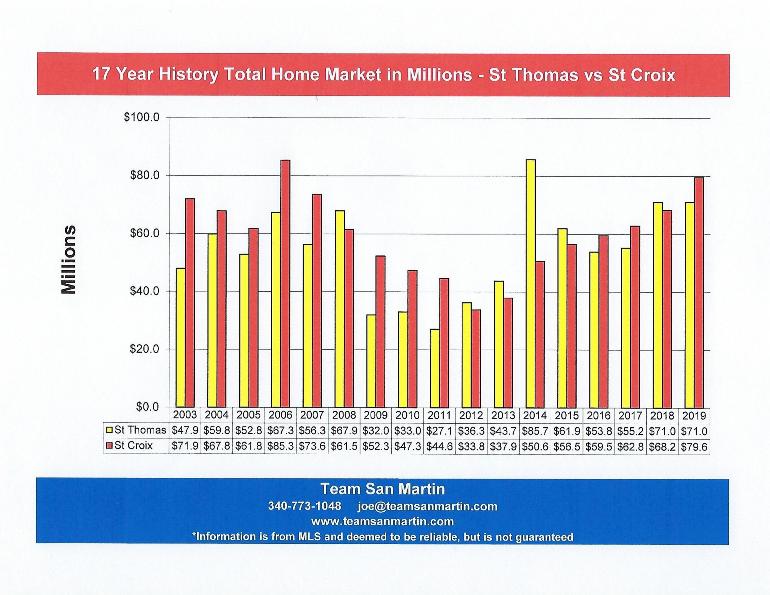
Information is from MLS and deemed to be reliable, but is not guaranteed.
Prepared by:
Julie San Martin Team Manager
February 2020
The St Croix Real Estate Cycle
A 17 Year Look
Total Number of Properties Sold
· Number of home sales on St Croix remains at a historic high level (197), only in 2018 were more homes sold (206). The next highest number of homes sold was 188 during 2006, the height of the real estate boom.
· During 2019, 126 condominiums sold on St Croix, very similar numbers to the previous 5 years. Nearly twice as many condos sold during 2005 (208 condos). The fewest condos sold in 2012, when only 34 condominiums sold.
· There were 145 lots sales in 2019, the highest number of lots sold on St Croix since 2009.
Average Sales Price
· The average 2019 home sales price ($403,914) was $9,525 lower than the 2003 average home sales price of $413,439. Since 2012, the average home sale price has varied between the low $300,000 range to $400,000.
· The 2019 average condominium sales price ($220,498) is $75,675 higher than the average condo price in 2003 ($144,823). Since 2015, the average condominium sales price has remained in the $180,000 to $220,000 range.
· The average 2019 lot sales price ($64,821) is $26,494 lower than the average lot sale price for 2003 ($91,315). Over the 17 year period, only 2013 saw a lower average lot sales price ($50,290).
Total Market in Millions of Dollars
· The 2019 total residential market ($79.6 million) was just $6 million lower than the height of the St Croix real estate market in 2006 ($85.3 million)! While the average sales price has not increased, the number of homes sold on St Croix continues on its upward trend.
· The 2019 total condominium market ($27.8 million) was exceeded only by the total market in 2005 ($34.7 million) and 2006 ($30.7 million). Since 2014, total condos sold has been in the 108 to 126 condo range. Average sales price increased by $25,000 since last year and is exceeded only by 2007 ($252,000) and 2009 ($249,000).
· The 2019 total land market ($9.4 million) is the best performance we have seen since 2009 ($13.3 million). More lots were sold in 2019 (145) than in any year since 2008 (224 lot sales). This market segment is moving in the right direction, but has a long recovery ahead.
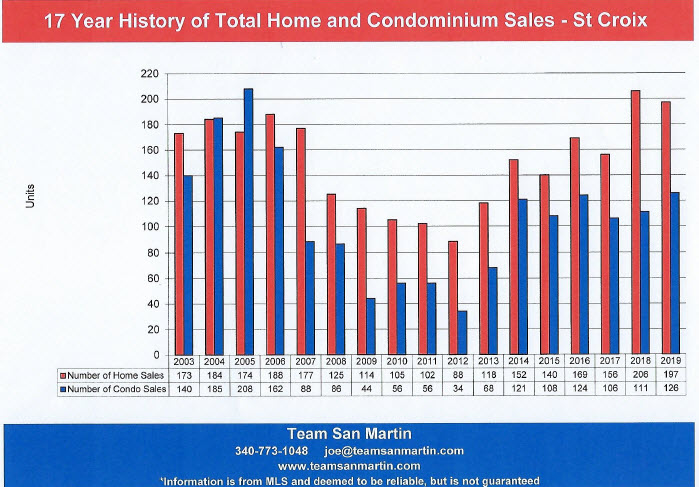
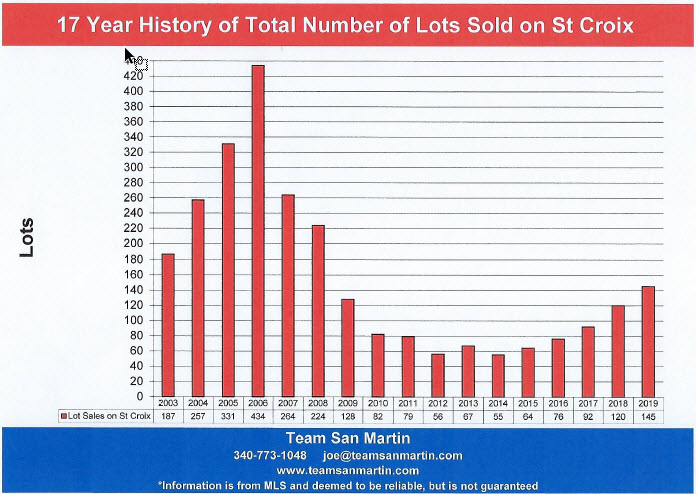
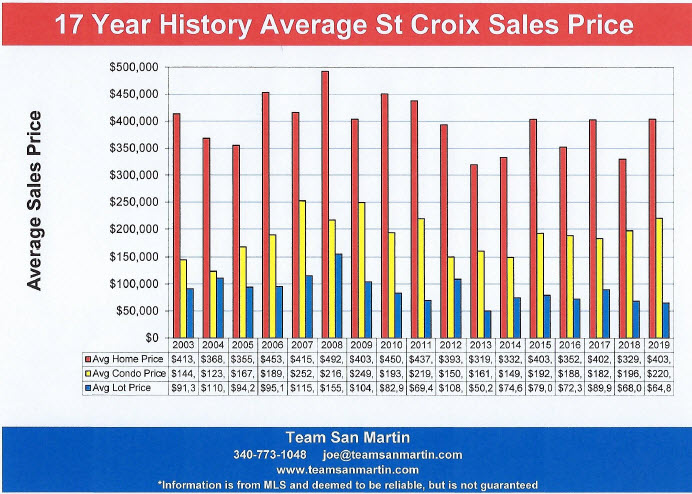
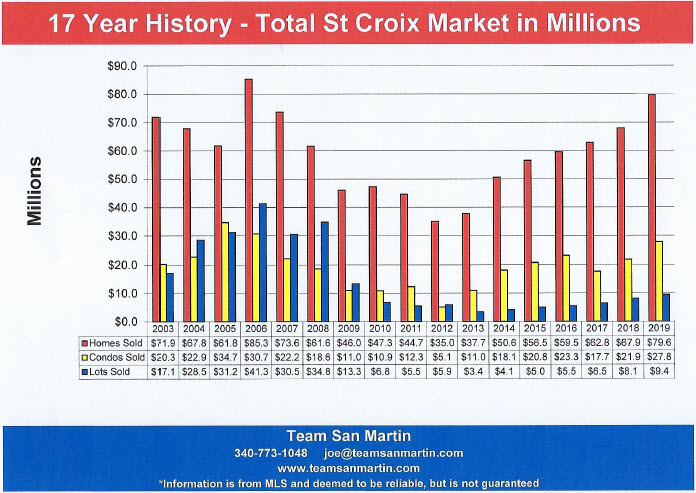
Information is from MLS and deemed to be reliable, but is not guaranteed.
Prepared by:
Julie San Martin
Team Manager
January 2020
8 Year St Croix Home Sales Price Trends
The average sales price of a home on St Croix decreased by $63,061 over the 7 year period; this is a 16% decrease.
Total number of homes sold increased 130% (116 homes) since 2012.
All areas of the island did not perform the same.
East End B
Far East End
Compared to 8 years ago, the average sales price of a home increased 25% ($170,384 increase).
The number of homes sold in a year increased by 1 home compared to 8 years ago;
12 homes sold in 2012, 13 homes sold in 2019.
East End A
Christiansted East to Coakley Bay
Compared to 8 years ago, the average sales price of a home decreased 29% ($246,337 decrease).
Four times as many homes sold in 2019 (40) compared to 8 years ago, when 10 homes sold.
Company
Christiansted West to the East Side of Judiths Fancy
Compared to 8 years ago, the average sales price of a home increased 50% ($101,260) increase.
The number of homes sold in a year nearly doubled,
from 15 home sales in 2012 to 26 home sales in 2019.
Queen
Constitution Hill West to La Reine, includes southwest
Judiths Fancy
Compared to 8 years ago, the average sales price of a home increased 24%
($58,515 increase).
The number of homes sold in a year has doubled since 2012, from 22 homes sold in 2012 to 44 home sales in 2019.
Northside A & B
North Shore from North Judiths Fancy to Hamms Bluff
Compared to 8 years ago, the average sales price of a home increased 44% ($199,853 increase).
The number of homes sold in a year increased by one home;
13 homes sales closed in 2012, 14 homes sales closed in 2019.
King
South Shore from La Reine West to UVI
Compared to 8 years ago, the average sales price of a home increased 64%
($70,850 increase).
Seven times as many homes closed in 2019 (14), compared to 2012 (2 home sales).
Prince
South Shore from UVI West to Williams Delight
Compared to 8 years ago, the average sales price of a home decreased 17%
($43,321 decrease).
Nearly 4 times as many homes sold in 2019 (19) compared to
2012 (5 home sales).
West End
South Shore, South from Mahogany Road,
East to Williams Delight
Compared to 8 years ago, the average sales price of a home increased 42%
($84,672 increase).
Twice as many homes sold during 2019 (22 home sales) than during 2012
(10 home sales).
Observations
Average home sales prices in three areas of the island consistently exceed the
island wide “average” home sales price:
· East End B
· East End A
· Northside A & B
Average home sales prices in two areas of the island are consistently much lower than the island wide “average” home sales price:
· King
· Prince
Center island and west end average home sales prices are about “average”:
· Company
· Queen
· West End
More homes sold in all quarters during 2019, when compared to 2012.
Compared to 2018, the island wide average home sale price increased 23%.
These quarters experienced increased average home sales prices:
· East End B
· East End A
· Queen
· Northside A & B
· King
· West End
Compared to 2012, these quarters had higher average home sales prices:
· East End B
· Company
· Queen
· Northside A & B
· King
· West End
Compared to 2012, these quarters had lower average home sales prices:
· East End A
· Prince
Information is from MLS and deemed to be reliable, but is not guaranteed.
Prepared by:
Julie San Martin
Team Manager
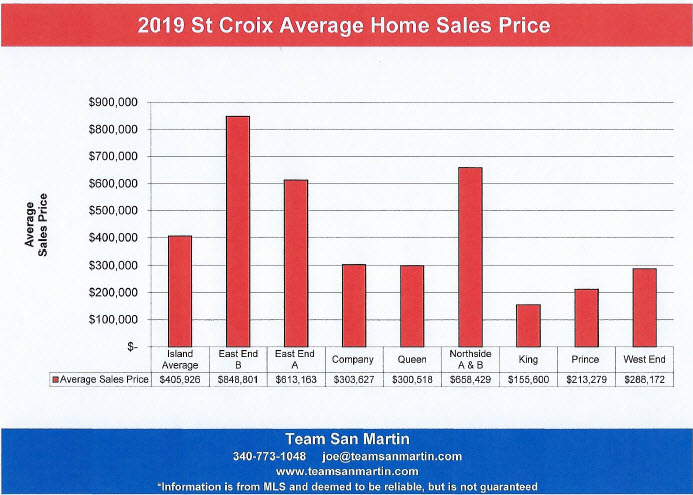
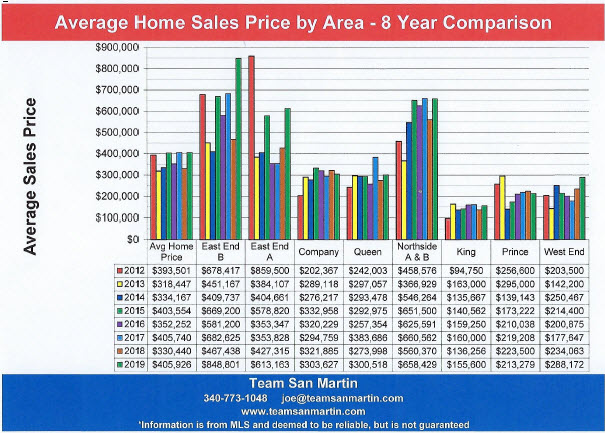
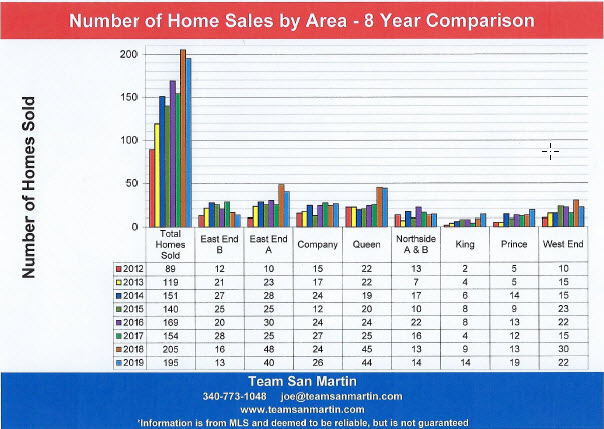
December 2019
Inventory Level Trends
Current Annual supply represents the number of years it will take at the current rate of sales to sell all the properties listed in a specific area (Quarter) of St Croix.
[Active Listings + Pending Listings] /
Number of Listings Sold During the Previous 12 Months
For example:
In November 2019, there were 32 active and 4 pending home sales in East End B, with 13 home sales in the previous 12 months, for a 2.8 year supply of homes for sale
[32 + 4] / 13 = 2.8 Years or 34 months
East End B
Far East End
Residential
Compared to 8 years ago, home inventory is identical;
average sales price is 16% ($141,492) lower; from $888,908 to $747,416.
Compared to last year, average time on the market increased by 1 year;
average sales price increased 56% (from $478,385 to $747,416)
Condominium
Compared to 8 years ago, condominium inventory decreased by 22 months (from 2.6 years to 0.8 years); average sales price decreased by 3%
(from $370,846 to $360,038)
Compared to last year, average time on the market increased by about 1 month;
average sales price increased by 49% (from $241,246 to $360,038)
Vacant Land
Compared to 8 years ago, land inventory decreased by 5 years,
from 8.2 years to 3.2 years;
average sales price decreased 12% (from $79,929 to $70,163)
Compared to last year, land inventory decreased by 5 years;
average sales price decreased 3% (from $72,308 to $70,163)
East End A
Christiansted East to Coakley Bay
Residential
Compared to 8 years ago, home inventory decreased by nearly 2 years,
from 2.8 years to under 1 year;
average home sale price has doubled; from $307,597 to $615,527.
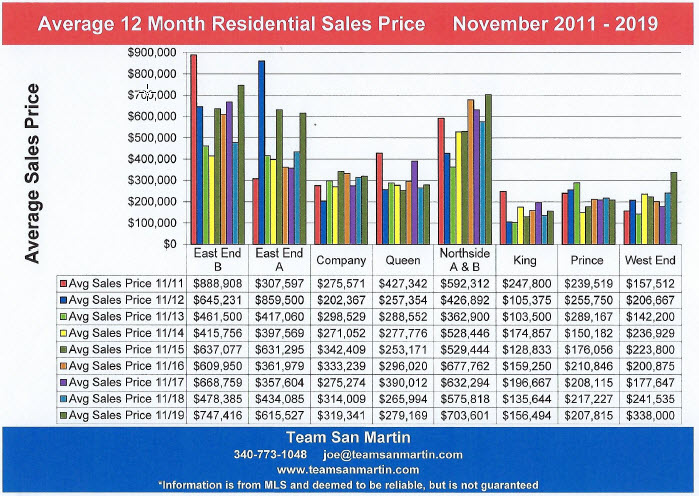
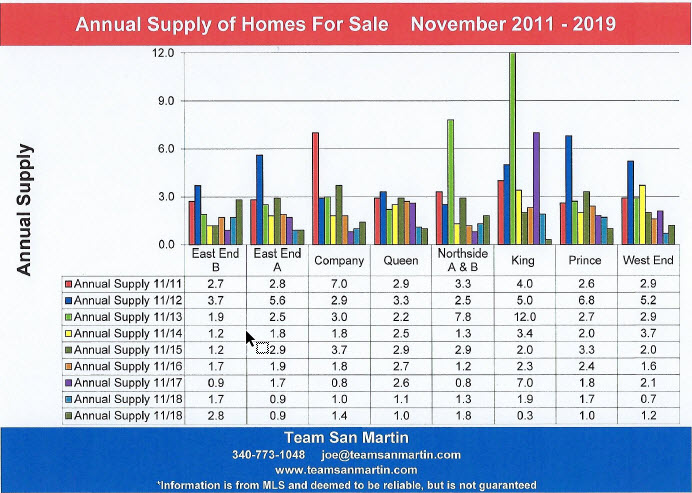
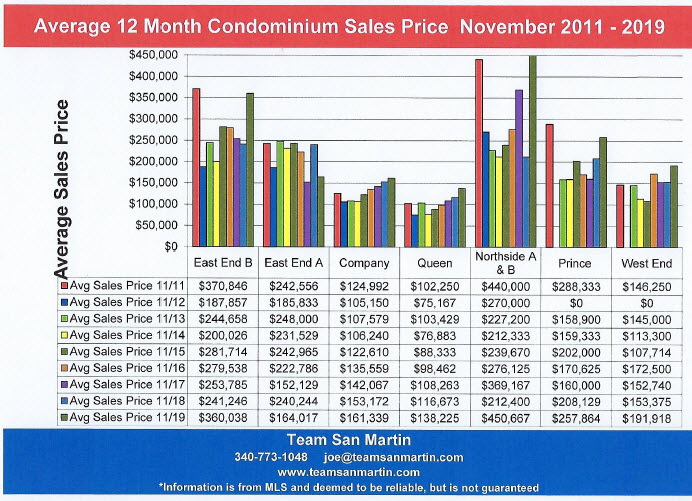
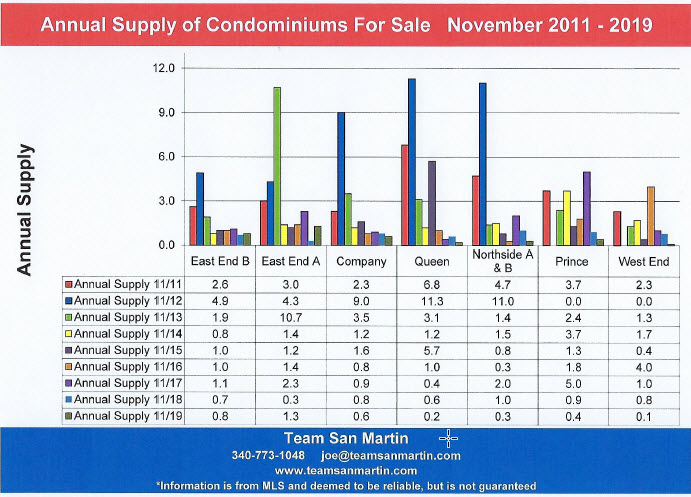
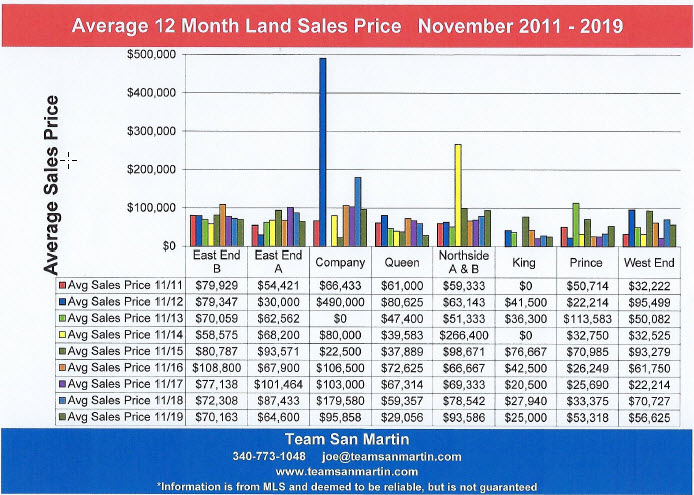
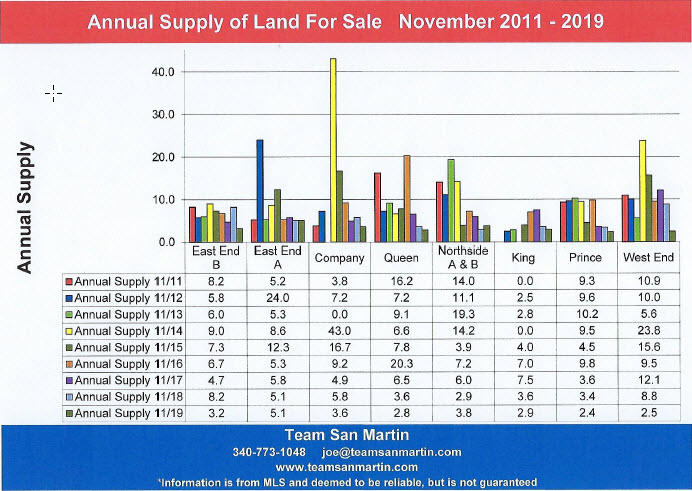
Information is from MLS and deemed to be reliable, but is not guaranteed.
Prepared by:
Julie San Martin
Team Manager
November 2019
Which St Croix Price Ranges are Selling?
First 10 months of 2014 through 2019
Residential
2014
134 home sales closed January through October; there were 308 homes for sale
2.3 sellers for every buyer
2015
111 home sales closed January through October; there were 273 homes for sale
2.5 sellers for every buyer
2016
143 home sales closed January through October; there were 240 homes for sale
1.7 sellers for every buyer
2017
130 home sales closed January through October; there were 200 homes for sale
1.5 sellers for every buyer
2018
166 home sales closed January through October; there were 143 homes for sale
0.86 sellers for every buyer
2019
162 home sales closed January through October; there were 218 homes for sale
1.3 sellers for every buyer
Condominium
2014
101 condominium sales closed January - October; there were 154 condos for sale
1.5 sellers for every buyer
2015
88 condominium sales closed January - October; there were 127 condos for sale
1.4 sellers for every buyer
2016
106 condominium sales closed January - October; there were 79 condos for sale
0.75 sellers for every buyer
2017
92 condominium sales closed January - October; there were 81 condos for sale
0.88 sellers for every buyer
2018
94 condominium sales closed January - October; there were 47 condos for sale
0.5 sellers for every buyer
2019
116 condominium sales closed January - October; there were 73 condos for sale
0.6 sellers for every buyer
Vacant Land
37 land sales closed January through October; there were 522 lots for sale
14.1 sellers for every buyer
2015
62 land sales closed January through October; there were 490 lots for sale
7.9 sellers for every buyer
2016
64 land sales closed January through October; there were 551 lots for sale
8.6 sellers for every buyer
2017
75 land sales closed January through October; there were 486 lots for sale
6.5 sellers for every buyer
2018
90 land sales closed January through October; there were 445 lots for sale
4.9 sellers for every buyer
2019
118 land sales closed January through October; there were 511 lots for sale
4.3 sellers for every buyer
SALES BY PRICE RANGE
Residential
|
2019 % of Sales |
2019 Sales |
2018 % of Sales |
2018 Sales |
2017 % of Sales |
2017 Sales |
2016 % of Sales |
2016 Sales |
2015 % of Sales |
2015 Sales |
2014 % of Sales |
2014 Sales |
Sales Price |
|
36% |
59 |
40% |
66 |
41% |
53 |
41% |
58 |
41% |
45 |
31% |
42 |
Under $200K |
|
28% |
46 |
28% |
46 |
25% |
32 |
31% |
45 |
31% |
34 |
36% |
48 |
$200K - $400K |
|
15% |
25 |
19% |
31 |
15% |
18 |
14% |
20 |
13% |
14 |
18% |
24 |
$400K - $600K |
|
9% |
14 |
8% |
13 |
8% |
11 |
6% |
8 |
9% |
10 |
10% |
14 |
$600K - $800K |
|
6% |
10 |
3% |
5 |
5% |
7 |
5% |
7 |
3% |
3 |
3% |
4 |
$800K - $1 Million |
|
5% |
8 |
3% |
5 |
7% |
9 |
3% |
5 |
5% |
5 |
1% |
2 |
Over $1 Million |
Condominium
|
2019 % of Sales |
2019 Sales |
2018 % of Sales |
2018 Sales |
2017 % of Sales |
2017 Sales |
2016 % of Sales |
2016 Sales |
2015 % of Sales |
2015 Sales |
2014 % of Sales |
2014 Sales |
Sales Price |
|
19% |
22 |
14% |
13 |
28% |
26 |
26% |
28 |
23% |
20 |
38% |
38 |
Under $100K |
|
37% |
43 |
46% |
43 |
49% |
45 |
40% |
42 |
45% |
39 |
43% |
43 |
$100K - $200K |
|
22% |
26 |
24% |
23 |
15% |
14 |
19% |
20 |
17% |
15 |
13% |
13 |
$200K - $300K |
|
18% |
21 |
15% |
14 |
6% |
6 |
13% |
14 |
13% |
11 |
6% |
6 |
$300K - $500K |
|
3% |
4 |
1% |
1 |
1% |
1 |
2% |
2 |
4% |
3 |
1% |
1 |
Over $500K |
Vacant Land
|
2019 % of Sales |
2019 Sales |
2018 % of Sales |
2018 Sales |
2017 % of Sales |
2017 Sales |
2016 % of Sales |
2016 Sales |
2015 % of Sales |
2015 Sales |
2014 % of Sales |
2014 Sales |
Sales Price |
|
62% |
73 |
64% |
58 |
62% |
62 |
48% |
31 |
52% |
32 |
68% |
25 |
Under $50K |
|
20% |
24 |
18% |
16 |
10% |
10 |
30% |
19 |
23% |
14 |
22% |
8 |
$50K - $100K |
|
17% |
20 |
16% |
14 |
|
0 |
20% |
13 |
21% |
13 |
8% |
3 |
$100K - $300K |
|
1% |
1 |
2% |
2 |
3% |
3 |
2% |
1 |
5% |
3 |
3% |
1 |
Over $300K |
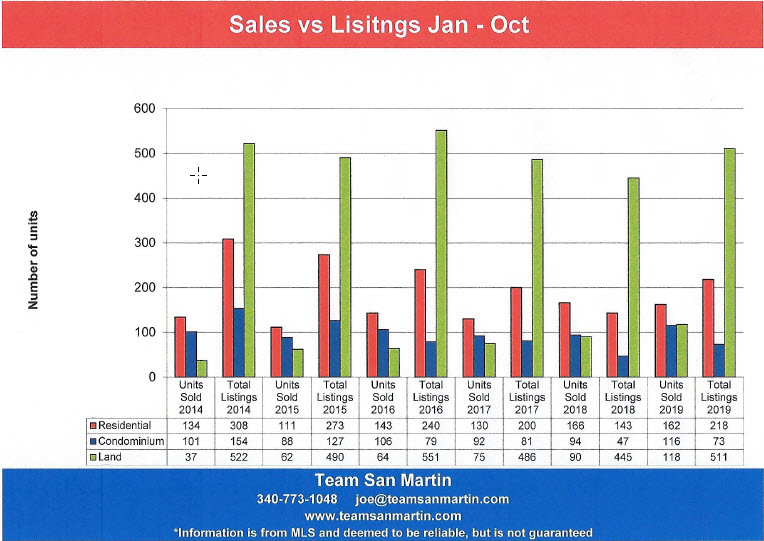
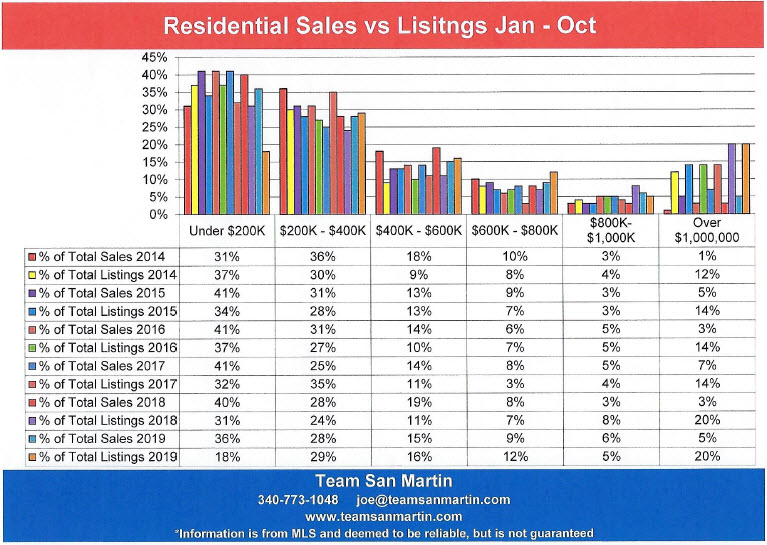
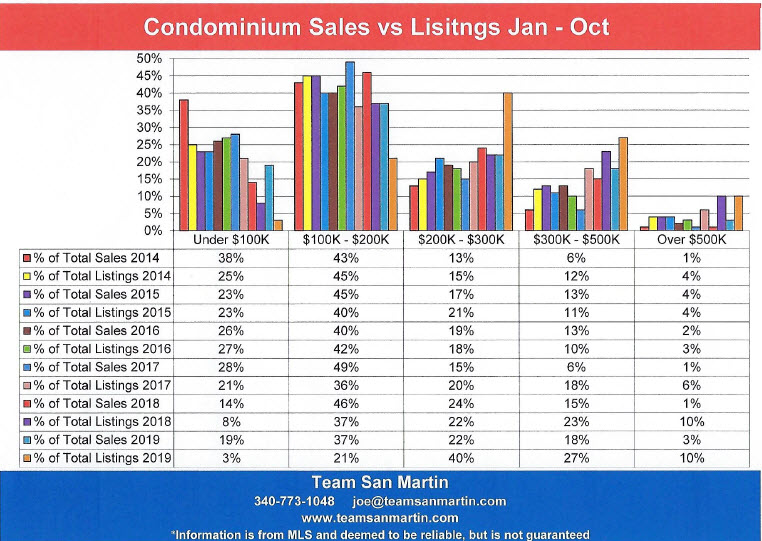
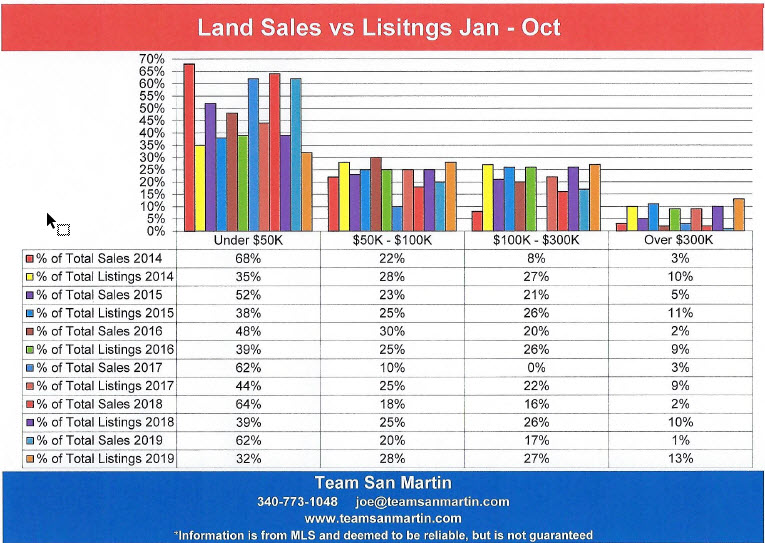
Information is from MLS and deemed to be reliable, but is not guaranteed.
Prepared by:
Julie San Martin
Team Manager
October 2019
Eleven Year Comparison
St Croix Real Estate Inventory Levels
TOTAL INVENTORY
Residential
44% lower (117 homes) than eleven years ago.
Highest inventory during this period was 9/15/12 with 336 homes on the market
Lowest inventory during this period was last year (9/15/18) with only
136 homes for sale.
Condominium
GIGANTIC decrease over the eleven year period!
Eleven years ago, there were four times as many condominiums on the market (236) as were for sale on 9/15/18 (53).
Vacant Land
18% lower (104 lots) than eleven years ago.
Land inventory slowly declined over the ten year period and is now beginning to increase.
INVENTORY BY PRICE RANGE
Residential
Under $200,000 listings (18%) increased 5% as percentage of total inventory, compared to eleven years ago. Compared to last year, this segment decreased by 13%; a significant adjustment.
$200,000 to $400,000 listings (27%) have remained relatively constant over the 11 year period, varying from 24% of inventory (9/15/218) to 34% of inventory (9/15/14).
$400,000 to $600 listings (15%) have remained constant at about 15% of total inventory over the eleven year period. Highest was 20% (9/15/10) and lowest was 10% (9/15/14).
$600,000 to $800,000 listings more than doubled since last year, from 6% of total inventory (9/15/218) to 13% of total inventory for the current period.
$800,000 to $1,000,000 listings (6%) remain relatively constant over the ten year period, varying form a high of 9% (2010) to a low of 3% (2012) of total inventory.
Listings over $1,000,000 (21%) are at their highest level of the 11 year period. Lowest level was 9/15/13 at just 11% of total inventory.
Condominium
Under $100,000 listings are currently only 4% of total condo listings, down from a high of 29% (9/15/13).
$100,000 to $200,000 listings (26%) decreased by 13% of total inventory since last year. On 9/15/16, this price range represented 46% of the total condominium inventory.
$200,000 to $300,000 listings are at 37% of total inventory, the highest percentage of the 11 year period.
$300,000 to $500,000 listings, at 23% of inventory, are approaching the highest level (24%) of 9/15/10. Lowest level was just 7% on 9/15/13.
Listings over $500,000 represent about 10% of the total condominium market, the highest level of the 11 year period. Lowest level was 9/15/16 at just 3% of total inventory.
Vacant Land
Under $50,000 listings are 10% higher than 11 years ago, at 31%. The highest percentage of inventory (44%) was in 9/15/17.
$50,000 to $100,000 listings have remained relatively constant, now representing 28% of inventory. Highest level was 34% in 2011, lowest was 25% (2015, 2017, and 2018).
$100,000 to $300,000 listings are 5% lower than 11 years ago, currently at 28%. Lowest percentage was 9/15/17, at 22% of total land inventory.
Listings over $300,000 are 3% lower than 11 years ago at 13% of total land market. Lowest levels were 2013, 2016, and 2017; this segment of the market decreased to 9% of total land listings.
Information is from MLS and deemed to be reliable, but is not guaranteed.
Prepared by:
Julie San Martin
Team Manager
September 2019
A Tale of Two Islands
St Croix and St Thomas Real Estate Sales
Seven Year Comparison Year to Date
Number of Sales
Residential
Residential sales on St Thomas increased 85% (39 homes) over the seven year period. On St Croix, the number of homes sold increased 63% (52 homes) over the seven year period.
|
% increase (decrease) |
St Croix |
% increase (decrease) |
St Thomas |
Number of Homes Sold |
|
|
82 |
|
46 |
Jan – Aug 2013 |
|
+39% |
114 |
+46% |
67 |
Jan – Aug 2014 |
|
(-25%) |
85 |
(-19%) |
54 |
Jan – Aug 2015 |
|
+38% |
117 |
+37% |
74 |
Jan – Aug 2016 |
|
+5% |
123 |
+4% |
77 |
Jan – Aug 2017 |
|
+3% |
127 |
+9% |
84 |
Jan – Aug 2018 |
|
+6% |
134 |
+1% |
85 |
Jan – Aug 2019 |
Condominium
Condominium sales increased 81% on both islands over the seven year period.
|
% increase (decrease) |
St Croix |
% increase (decrease) |
St Thomas |
Number of Condos Sold |
|
|
54 |
|
52 |
Jan – Aug 2013 |
|
+52% |
82 |
+35% |
70 |
Jan – Aug 2014 |
|
(-16%) |
69 |
(-6%) |
66 |
Jan – Aug 2015 |
|
+16% |
80 |
+38% |
91 |
Jan – Aug 2016 |
|
+11% |
89 |
+7% |
98 |
Jan – Aug 2017 |
|
(-19%) |
72 |
(-28%) |
71 |
Jan – Aug 2018 |
|
+36% |
98 |
+32% |
94 |
Jan – Aug 2019 |
Vacant Land
Vacant land sales on St Thomas increased 76% (15 lots) over the seven year period. On St Croix, land sales increased 134% (55 lots) over the seven year period.
|
% increase (decrease) |
St Croix |
% increase (decrease) |
St Thomas |
Number of Lots Sold |
|
|
41 |
|
21 |
Jan – Aug 2013 |
|
(-27%) |
30 |
+43% |
30 |
Jan – Aug 2014 |
|
+57% |
47 |
+27% |
38 |
Jan – Aug 2015 |
|
+15% |
54 |
(-29%) |
27 |
Jan – Aug 2016 |
|
+30% |
70 |
+59% |
43 |
Jan – Aug 2017 |
|
(-12%) |
62 |
(-33%) |
27 |
Jan – Aug 2018 |
|
+55% |
96 |
+37% |
37 |
Jan – Aug 2019 |
Residential
Average Sales Price
The average St Thomas residential sales price is nearly identical to the average home sale price of seven years ago. On St Croix, the average home sales price increased 40% ($115,341) over the seven year period
|
% increase (decrease) |
St Croix |
% increase (decrease) |
St Thomas |
Average Home Sales Price |
|
|
$287,762 |
|
$665,130 |
Jan – Aug 2013 |
|
+16% |
$332,572 |
+16% |
$772,334 |
Jan – Aug 2014 |
|
+28% |
$426,719 |
(-11%) |
$689,658 |
Jan – Aug 2015 |
|
(-18%) |
$350,076 |
(-14%) |
$594,317 |
Jan – Aug 2016 |
|
+12% |
$393,754 |
(-2%) |
$583,676 |
Jan – Aug 2017 |
|
(-32%) |
$342,041 |
(-10%) |
$524,735 |
Jan – Aug 2018 |
|
+18% |
$403,103 |
+27% |
$666,577 |
Jan – Aug 2019 |
St Thomas Home Sales Prices
|
|
Lowest |
Highest |
|
Jan – Aug 2013 |
$100,000 |
$3,300,000 |
|
Jan – Aug 2014 |
$34,000 |
$4,400,000 |
|
Jan – Aug 2015 |
$85,000 |
$6,000,000 |
|
Jan – Aug 2016 |
$49,000 |
$2,990,000 |
|
Jan – Aug 2017 |
$9,000 |
$3,200,000 |
|
Jan – Aug 2018 |
$55,000 |
$3,150,000 |
|
Jan – Aug 2019 |
$40,000 |
$5,650,000 |
St Croix Home Sales Prices
|
|
Lowest |
Highest |
|
Jan – Aug 2013 |
$35,000 |
$800,000 |
|
Jan – Aug 2014 |
$35,000 |
$1,680,000 |
|
Jan – Aug 2015 |
$31,000 |
$6,250,000 |
|
Jan – Aug 2016 |
$40,000 |
$2,500,000 |
|
Jan – Aug 2017 |
$17,000 |
$2,212,500 |
|
Jan – Aug 2018 |
$37,500 |
$1,600,000 |
|
Jan – Aug 2019 |
$35,000 |
$2,975,000 |
Median sales price is the midpoint - half of all homes sold for more than this price, half sold for less.
For St Thomas, the median home sales price is $110,000 lower than seven years ago. On St Croix, the median home sales price increased $10,500 over the seven year period; it is essentially unchanged and $124,500 lower than St Thomas.
Median Home Sales Price
|
% increase (decrease) |
St Croix |
% increase (decrease) |
St Thomas |
Median Home Sales Price |
|
|
$270,000 |
|
$515,000 |
Jan – Aug 2013 |
|
+11% |
$299,000 |
(-5%) |
$490,000 |
Jan – Aug 2014 |
|
(-15%) |
$255,000 |
No change |
$492,000 |
Jan – Aug 2015 |
|
(-14%) |
$220,000 |
No change |
$492,500 |
Jan – Aug 2016 |
|
+27% |
$280,000 |
(-18%) |
$405,000 |
Jan – Aug 2017 |
|
No change |
$279,000 |
(-6%) |
$380,000 |
Jan – Aug 2018 |
|
No change |
$280,500 |
+6% |
$405,000 |
Jan – Aug 2019 |
Condominium
Average Sales Price
The average condominium sales price is little changed from last year on both islands. Over the 7 year period, average condo sales price increased by 12% on St Thomas and 22% on St Croix.
|
% increase (decrease) |
St Croix |
% increase (decrease) |
St Thomas |
Average condo Sales Price |
|
|
$169,563 |
|
$223,604 |
Jan – Aug 2013 |
|
(-8%) |
$155,356 |
(-2%) |
$219,512 |
Jan – Aug 2014 |
|
+30% |
$202,402 |
+3% |
$227,064 |
Jan – Aug 2015 |
|
(-17%) |
$168,023 |
+21% |
$274,901 |
Jan – Aug 2016 |
|
(-2%) |
$164,630 |
(-7%) |
$254,416 |
Jan – Aug 2017 |
|
+23% |
$203,095 |
(-1%) |
$252,387 |
Jan – Aug 2018 |
|
+2% |
$207,834 |
(-1%) |
$250,208 |
Jan – Aug 2019 |
St Thomas Condominium Sales Prices lowest vs highest
|
|
Lowest |
Highest |
|
Jan – Aug 2013 |
$38,000 |
$550,000 |
|
Jan – Aug 2014 |
$39,000 |
$770,000 |
|
Jan – Aug 2015 |
$55,000 |
$940,000 |
|
Jan – Aug 2016 |
$30,000 |
$1,690,000 |
|
Jan – Aug 2017 |
$24,000 |
$665,000 |
|
Jan – Aug 2018 |
$53,000 |
$780,000 |
|
Jan – Aug 2019 |
$72,000 |
$600,000 |
St Croix Condominium Sales Prices lowest vs highest
|
|
Lowest |
Highest |
|
Jan – Aug 2013 |
$40,000 |
$545,000 |
|
Jan – Aug 2014 |
$30,000 |
$775,000 |
|
Jan – Aug 2015 |
$22,500 |
$1,150,000 |
|
Jan – Aug 2016 |
$22,500 |
$700,000 |
|
Jan – Aug 2017 |
$33,000 |
$570,000 |
|
Jan – Aug 2018 |
$34,000 |
$570,000 |
|
Jan – Aug 2019 |
$41,000 |
$650,000 |
Over the seven year period, the median condominium sales price increased $51,250 on St Thomas and $40,500 on St Croix.
Median Condominium Sales Price
|
% increase (decrease) |
St Croix |
% increase (decrease) |
St Thomas |
Median Condo Sales Price |
|
|
$144,500 |
|
$173,750 |
Jan – Aug 2013 |
|
(-18%) |
$119,125 |
(-5%) |
$165,000 |
Jan – Aug 2014 |
|
+26% |
$150,000 |
+9% |
$180,000 |
Jan – Aug 2015 |
|
(-10%) |
$135,000 |
+19% |
$215,000 |
Jan – Aug 2016 |
|
+7% |
$145,000 |
+2% |
$220,000 |
Jan – Aug 2017 |
|
+17% |
$170,000 |
(-10%) |
$198,562 |
Jan – Aug 2018 |
|
+9% |
$185,000 |
+13% |
$225,000 |
Jan – Aug 2019 |
Vacant Land
Average Sales Price
The average St Thomas land sales price increased by nearly 60% over the seven year period.
On St Croix, average land sale price increased by about 23% over the 7 year period
|
% increase (decrease) |
St Croix |
% increase (decrease) |
St Thomas |
Average lot Sales Price |
|
|
$43,425 |
|
$108,357 |
Jan – Aug 2013 |
|
+85% |
$80,162 |
+16% |
$126,172 |
Jan – Aug 2014 |
|
(-3%) |
$78,055 |
(-26%) |
$91,737 |
Jan – Aug 2015 |
|
(-2%) |
$76,518 |
+97% |
$181,144 |
Jan – Aug 2016 |
|
(-7%) |
$71,529 |
+24% |
$225,455 |
Jan – Aug 2017 |
|
(-6%) |
$67,655 |
(-51%) |
$110,830 |
Jan – Aug 2018 |
|
(-21%) |
$53,597 |
+55% |
$172,270 |
Jan – Aug 2019 |
St Thomas Land Sales Prices
|
|
Lowest |
Highest |
|
Jan – Aug 2013 |
$35,000 |
$250,000 |
|
Jan – Aug 2014 |
$15,000 |
$900,000 |
|
Jan – Aug 2015 |
$20,000 |
$370,000 |
|
Jan – Aug 2016 |
$8,000 |
$900,000 |
|
Jan – Aug 2017 |
$20,000 |
$2,100,000 |
|
Jan – Aug 2018 |
$30,000 |
$600,000 |
|
Jan – Aug 2019 |
$35,000 |
$990.000 |
St Croix Land Sales Prices
|
|
Lowest |
Highest |
|
Jan – Aug 2013 |
$10,000 |
$120,000 |
|
Jan – Aug 2014 |
$8,000 |
$370,000 |
|
Jan – Aug 2015 |
$13,000 |
$348,000 |
|
Jan – Aug 2016 |
$16,000 |
$335,000 |
|
Jan – Aug 2017 |
$12,000 |
$500,000 |
|
Jan – Aug 2018 |
$15,000 |
$350,000 |
|
Jan – Aug 2019 |
$14,000 |
$275,000 |
Median Land Sales Price
On both islands, the median lot sales price is nearly the same as 7 years ago.
|
% increase (decrease) |
St Croix |
% increase (decrease) |
St Thomas |
Median Lot Sales Price |
|
|
$34,500 |
|
$84,500 |
Jan – Aug 2013 |
|
+14% |
$39,500 |
+1% |
$85,000 |
Jan – Aug 2014 |
|
+1% |
$40,000 |
(-35%) |
$55,000 |
Jan – Aug 2015 |
|
+64% |
$65,500 |
+78% |
$98,000 |
Jan – Aug 2016 |
|
(-43%) |
$37,250 |
(-13%) |
$85,000 |
Jan – Aug 2017 |
|
+7% |
$40,000 |
(-6%) |
$80,000 |
Jan – Aug 2018 |
|
No change |
$40,000 |
No change |
$80,000 |
Jan – Aug 2019 |
Total Market (Millions)
The 2019 St Thomas and St Croix total residential markets were nearly the same, as they have been for the past 5 years.
Residential
|
% increase (decrease) |
St Croix |
% increase (decrease) |
St Thomas |
Number of Homes Sold |
|
|
$23.6 |
|
$30.6 |
Jan – Aug 2013 |
|
+61% |
$37.9 |
+69% |
$51.7 |
Jan – Aug 2014 |
|
(-4%) |
$36.3 |
(-28%) |
$37.2 |
Jan – Aug 2015 |
|
+13% |
$41.0 |
+18% |
$44.0 |
Jan – Aug 2016 |
|
+18% |
$48.4 |
+2% |
$44.9 |
Jan – Aug 2017 |
|
(-10%) |
$43.4 |
(-2%) |
$44.1 |
Jan – Aug 2018 |
|
+24% |
$54.0 |
+29% |
$56.7 |
Jan – Aug 2019 |
The St Thomas total condominium market recovered to the 2016 / 2017 levels. On St Croix, 2019 was by far the highest level of condominium sales in 7 years.
Condominium
|
% increase (decrease) |
St Croix |
% increase (decrease) |
St Thomas |
Number of Condos Sold |
|
|
$9.2 |
|
$11.6 |
Jan – Aug 2013 |
|
+38% |
$12.7 |
+33% |
$15.4 |
Jan – Aug 2014 |
|
+10% |
$14.0 |
(-3%) |
$15.0 |
Jan – Aug 2015 |
|
(-4%) |
$13.4 |
+67% |
$25.0 |
Jan – Aug 2016 |
|
+9% |
$14.6 |
No change |
$24.9 |
Jan – Aug 2017 |
|
No change |
$14.6 |
(-38%) |
$17.9 |
Jan – Aug 2018 |
|
+40% |
$20.4 |
+31% |
$23.5 |
Jan – Aug 2019 |
The St Thomas and St Croix total land market were nearly identical for this period; the St Thomas total land market more than doubled since last year, the St Croix total land market was the highest in 7 years.
Vacant Land
|
% increase (decrease) |
St Croix |
% increase (decrease) |
St Thomas |
Number of Lots Sold |
|
|
$1.8 |
|
$2.3 |
Jan – Aug 2013 |
|
+33% |
$2.4 |
+65% |
$3.8 |
Jan – Aug 2014 |
|
+54% |
$3.7 |
(-8%) |
$3.5 |
Jan – Aug 2015 |
|
+11% |
$4.1 |
+40% |
$4.9 |
Jan – Aug 2016 |
|
+24% |
$5.1 |
+102% |
$9.9 |
Jan – Aug 2017 |
|
(-18%) |
$4.2 |
(-70%) |
$3.0 |
Jan – Aug 2018 |
|
+45% |
$6.1 |
+113% |
$6.4 |
Jan – Aug 2019 |
Information is from MLS and deemed to be reliable, but is not guaranteed.
Prepared by:
Julie San Martin
Team Manager
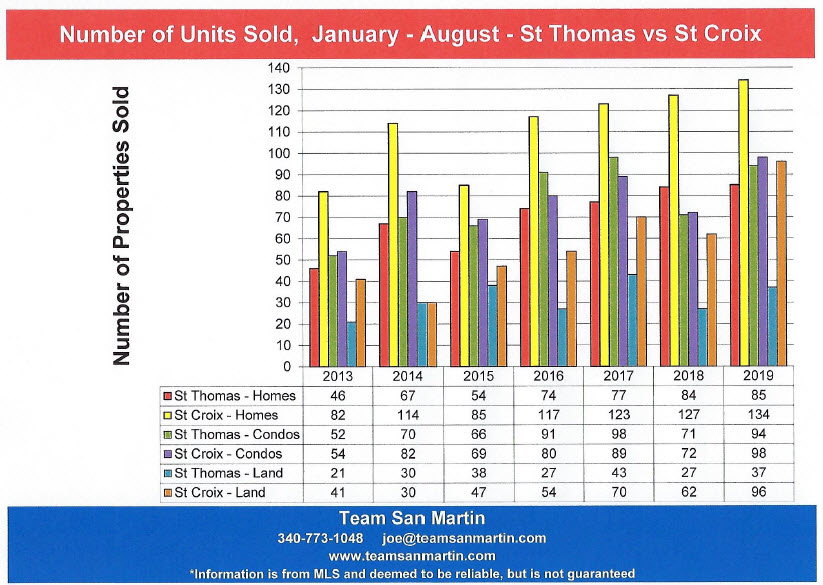
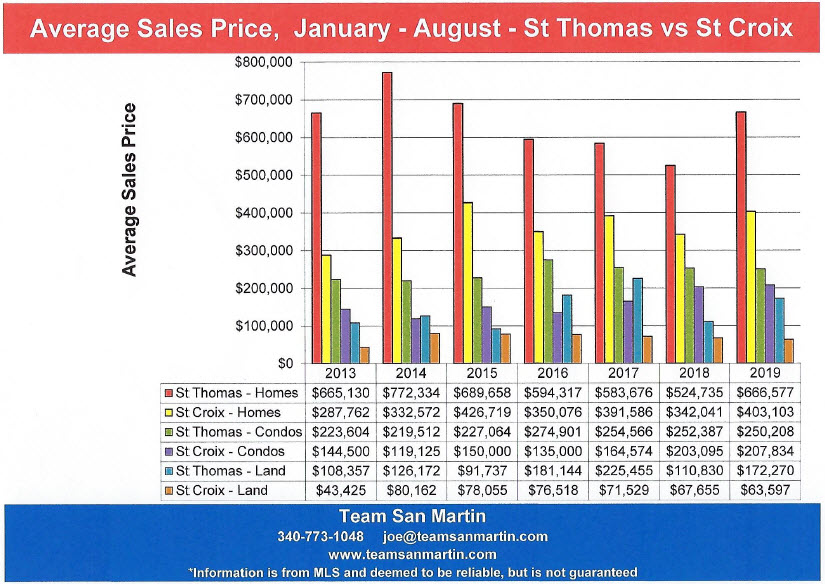
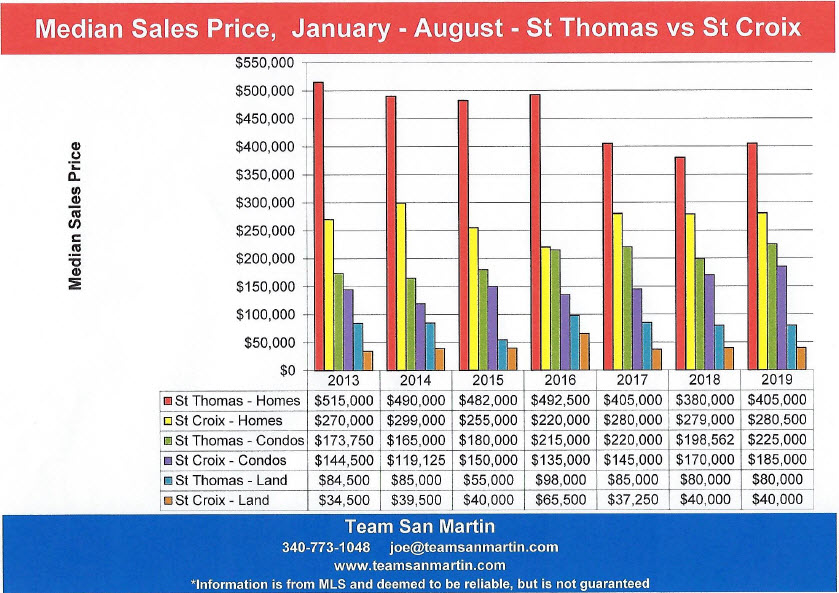
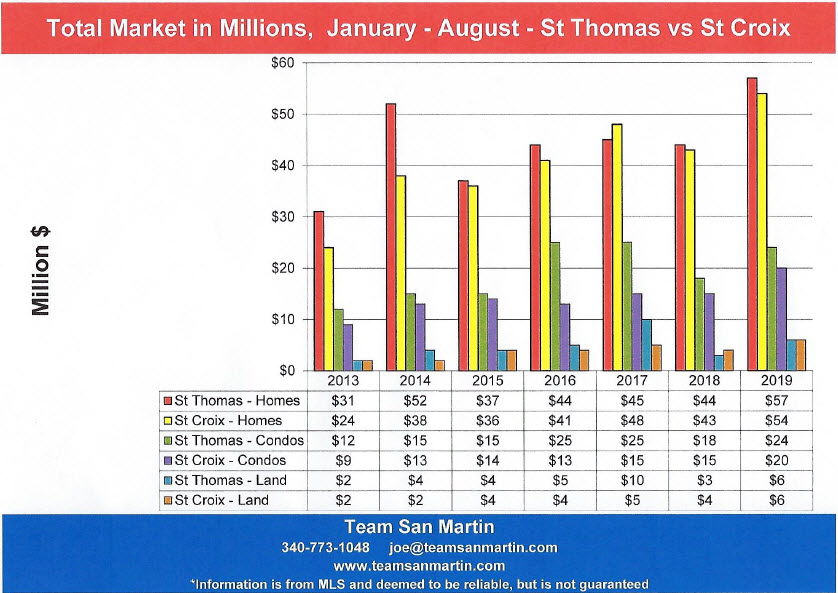
August 2019
Sales Price and Marketing Time on St Croix
“Annual Supply” represents the number of years it will take at the current annual rate of sales to sell all the properties for sale
in a specific area.
East End B
Far East End
Inventory
Seven years ago (July 2012), there was a 4.7 year supply of homes and a 4.3 year supply of condominiums on the market.
Inventory has decreased for both homes and condominiums,
There is now a 2.8 year supply of homes and an 8 month supply of condominiums in this quarter.
Average Sales Price
Compared to seven years ago, average home sales price increased by 15%, from $575,667 in 2012 to $662,850 for 2019, while average condominium sales price decreased 24%, from $382,500 in 2012 to $290,625 for 2019.
East End A
Christiansted east to Coakley Bay
Inventory
Seven years ago (July 2012), there was a 4.2 year supply of homes and a 4.8 year supply of condominiums on the market.
Inventory has decreased for both homes and condominiums.
There is now an 11 month supply of homes and a 5 month supply of condominiums in this quarter.
Average Sales Price
Average residential sale price ($517,241) is 7% higher than seven years ago ($481,712)
Condominium average sale price ($197,346) is 3% lower than seven years ago ($204,667)
Company
Christiansted west to east side of Judiths Fancy
Inventory
Seven years ago (July 2012), there was a 3.7 year supply of homes and a 5.9 year supply of condominiums on the market.
Residential inventory decreased by nearly 3 years, to a 10 month supply of homes.
Condominium inventory sell off was dramatic, from a 5.9 year supply of units seven years ago to a current 6 month supply of condominiums for sale.
Average Sales Price
Homes and condominiums both experienced average sales price increases, compared to seven years ago.
Average home sale price increased the most ($154,275), from $191,269 in 2012 to $345,544 for the 12 months ending July 2019.
Average condo sale price increased $48,885, from $106,250 seven years ago to $155,136 for the 12 months ending July 2019.
Queen
Constitution Hill west to La Reine, includes southwest Judiths Fancy
Inventory
Seven years ago (July 2012), there was a 3.1 year supply of homes and an 8.3 year supply of condominiums on the market.
Home inventory has decreased by more than 2 years, to a 1 year supply, over the seven year period.
Condominium inventory decreased by more than 7 years over this period, to an 11 month supply for the 12 months ending July 2019.
Average Sales Price
Average residential sale price decreased slightly ($6,496) over the seven year period, from $291,289 in 2012 to $284,793 for the 12 months ending July 2019.
Average condo sale price increased by $61,657 over the seven year period, from
$75,125 in 2012 to $136,782 from the 12 months ending July 2019.
Northside A & B
North shore from north Judiths Fancy west to Hamms Bluff
Inventory
Seven years ago (July 2012), there was a 4.6 year supply of homes and a 6.5 year supply of condominiums on the market.
Residential inventory decreased by more than 3 years, to a 1 year supply of homes.
The condominium supply decreased by more than 6 years, to a 5 month supply of condominiums in this quarter.
Average Sales Price
Average home sale price ($681,863) increased by $222,753, compared to seven years ago ($459,110
Average condominium sale price increased by about $39,875 over the seven year period, from $345,000 for the 12 months ending July 2012 to $384,875 for the 12 months ending July 2019.
King
South shore from La Reine west to UVI
Inventory
Seven years ago (July 2012), there was a 3.8 year supply of homes;
there are no condominiums in King Quarter.
Residential inventory decreased by more than 3 years, compared to seven years ago, to 6 months of inventory for the 12 months ending July 2019.
Average Sales Price
Average home sale price decreased $45,882 over the seven year period, from $207,400 for the 12 months ending July 2012 to $161,118 for the 12 months ending July 2019.
Prince
South shore from UVI west to Williams Delight
Inventory
Seven years ago (July 2012), there was a 5.8 year supply of homes and an 11.0 year supply of condominiums on the market.
Residential inventory decreased by 5 years, to a 10 month supply of homes.
Condominium inventory decreased by more than 11 years, to an 8 month supply of condominiums.
Average Sales Price
Homes saw a sales price increase of $22,685 when compared to seven years ago, from $208,430 for the 12 months ending July 2012 to $231,115 for the 12 months ending July 2019.
Condominiums experienced a $193,733 decrease in average sale price over the seven year period, from $415,000 for the 12 months ending July 2012 to $231,115 for the 12 months ending July 2019.
West End
South from Mahogany Road, East to Williams Delight
Inventory
Seven years ago (July 2012), there was a 4.6 year supply of homes and a 7.0 year supply of condominiums on the market.
Over the seven year period, residential inventory decreased by nearly 3 years, to a 10 month supply of homes for the 12 months ending July 2019.
Condominium inventory decreased by nearly 7 years, to a 2 month supply of condominiums.
Average Sales Price
Average home sale price increased $77,161 over the seven year period, from $164,300 for the 12 months ending July 2012 to $241,461 for the 12 months ending July 2019.
Average condominium sale price increased $134,806 (!) over the seven year period, from $62,500 for the 12 months ending July 2012 to $197,306 for the 12 months ending July 2019.
Conclusion
Over the eight year period, average home sale prices were highest, usually more than double those of other quarters, in these quarters:
· Northside A & B
· East End B
· East End A
Over the eight year period, the average condominium sale price increased by about $33,000.
These quarters did not experienced an increase in average condo sales price:
· East End B
· East End A
· Prince
Residential and condominium inventories decreased to a year or less island wide over the past eight years, with the exception of East End B, which has a residential inventory of nearly 3 years.
Information is from MLS and deemed to be reliable, but is not guaranteed.
Prepared by:
Julie San Martin
Team Manager
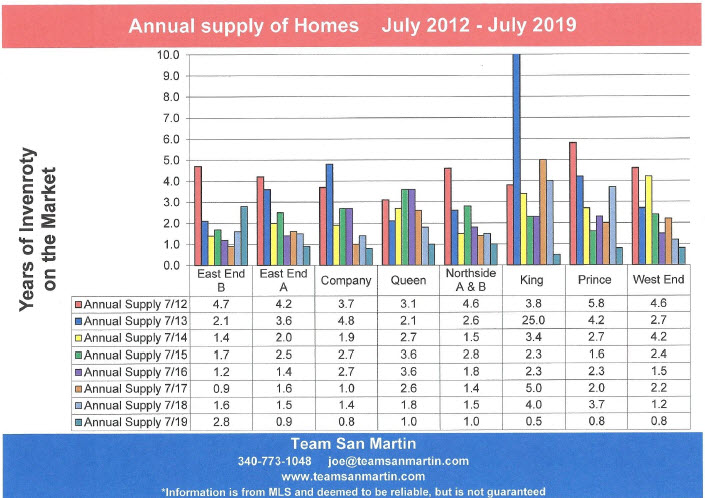
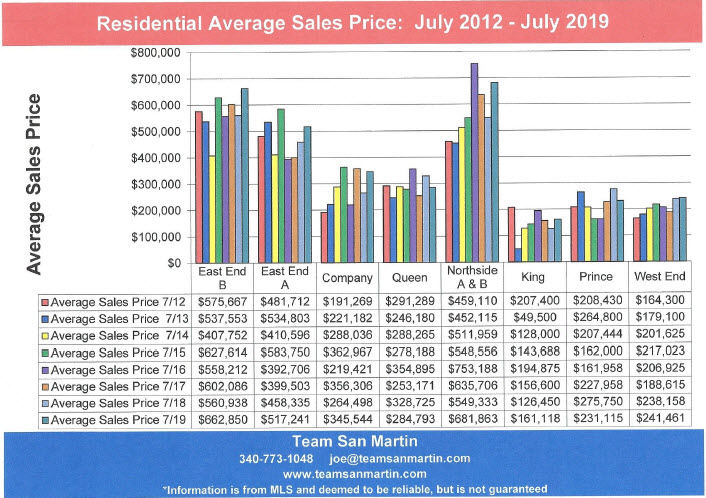
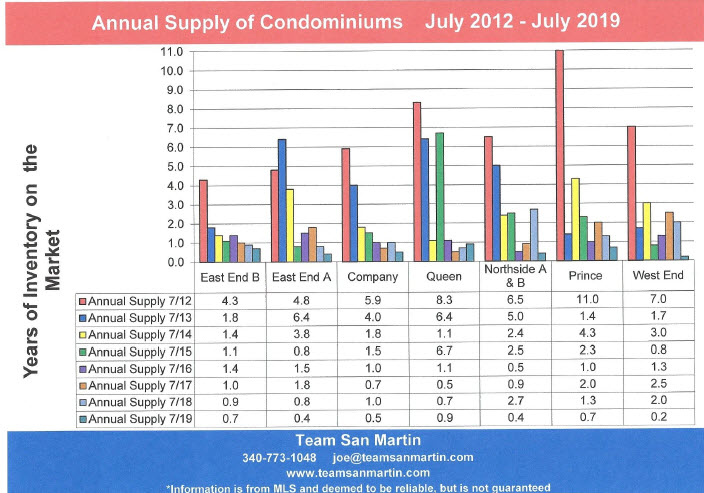
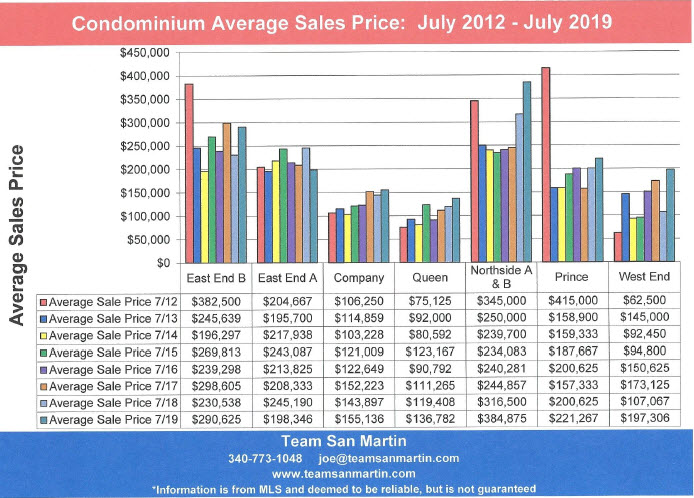
July 2019
14 year look at the St Croix Real Estate Market for the 12 month period ending 30 June
The last real estate boom on St Croix was 14 years ago –
The 2005 / 2006 period
Total number of properties sold
· Residential – More homes sold during this period than any other period during the 14 year look back! At 231 home sales, the past 12 months exceed the height of the market (2005/2006) by 30 homes!
· Condominiums – Excellent sales activity (139 condos sold), exceeded only by 2016/2017 (142 condo sales) and 2005/2006 (220 condo sales).
· Land – Land sales are increasing. At 152 land sales, this is the highest number of lots sold since 2008/2009.
Average sales price
· Residential – Average home sale price has decreased. At $359,384 for the current period, only the three year period of 2012/2015 produced lower average home sale prices. The lowest was 2013/2014 with a $336,195 average home sale price.
· Condominiums – Average condominium sales price for this 12 month period ($205,401) exceeded 8 of the previous 14 years. Highest average condominium sales price was $238,359 for the period 2007/2008.
· Land – Average lot sales price ($64,651) was lower than any of the previous 14 years except for the 2017/2018 period with a $63,069 average sales price.
Total Market
Number of properties sold x Average sales price
· Residential – The total residential market ($83 million) was the highest since the boom of 2005/2006 ($93.6 million)!
· Condominiums – The total condominium market ($28.5 million) was the highest since the boom of 2005/2006 ($40.1 million)!
· Land – This total land market ($9.8 million) was the highest since the 2008/2009 period ($18.0 million) but still way below the height of this market in 2005/2006 ($45.6 million).
Conclusion
Compared to 14 years ago, total St Croix real estate sales have decreased by about 1/3 ($58 Million Dollars)
Compared to the previous 12 month period, total
St Croix real estate sales increased $47 million (39%) for the period of July 2018 through June 2019
Information is from MLS and deemed to be reliable, but is not guaranteed.
Prepared by:
Julie San Martin
Team Manager
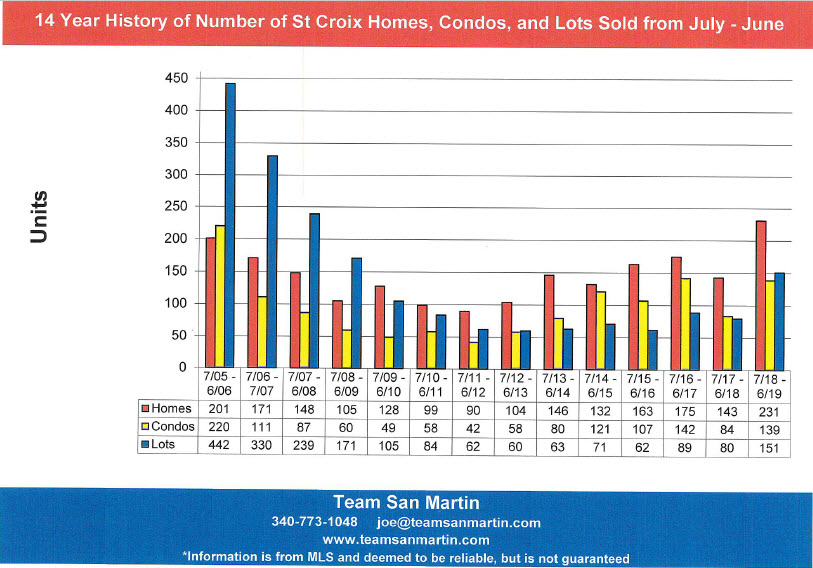
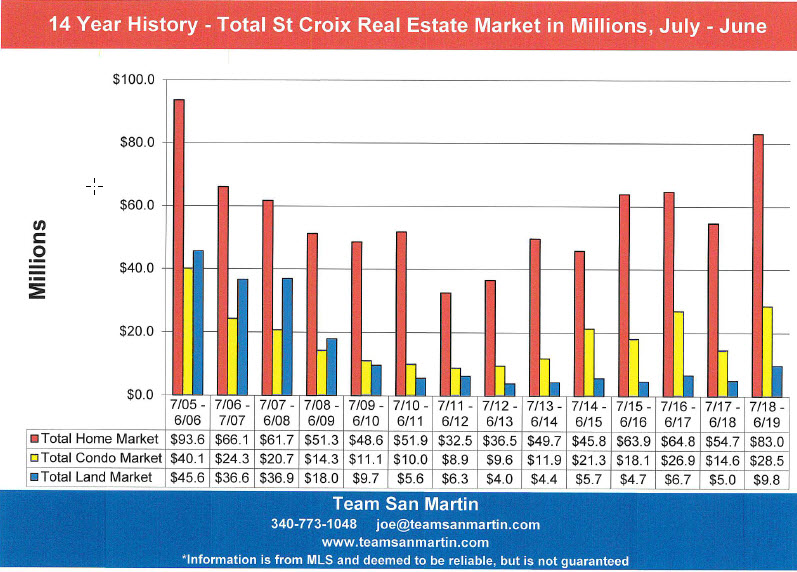
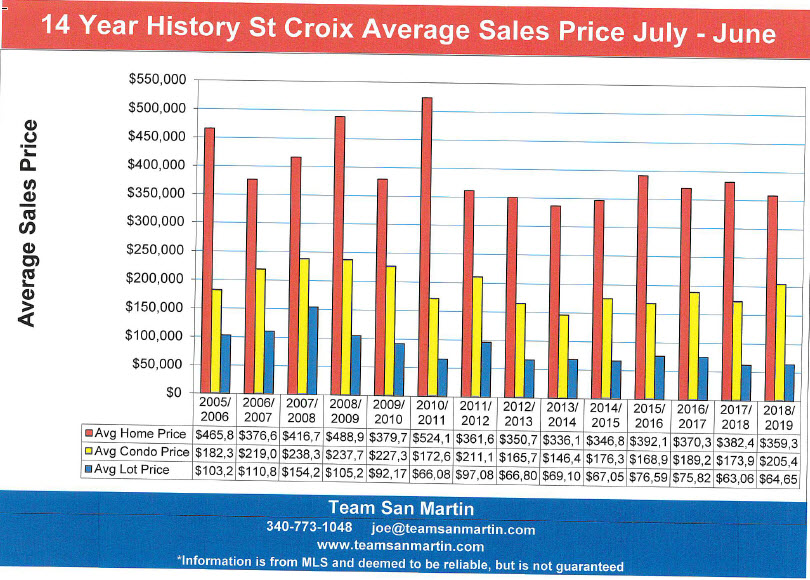
June 2019
Changes in the St Croix Real Estate Market
Inventory levels by price range reflect the seller’s expectations.
The attached graphs compare changes in asking prices over the past decade, using 15 May inventory levels.
Residential
· The lowest price range (under $200,000) has accounted for about one third of the St Croix residential inventory for the past 5 years. Last year saw a big decrease, from 33% of the inventory to just 17% of total, and much smaller, inventory. Homes sold for $200,000 or less accounted for 37% of St Croix residential sales over the past 12 months.
· The second tier ($200,000 to $400,000) has consistently comprised nearly one third of all homes for sale on St Croix over the previous 9 year period. This segment is now about one quarter of the inventory. 31% of St Croix home sales over the past 12 months were between $200,000 and $400,000.
· Homes listed for more than $400,000 account for 56% of the inventory, as they did 10 years ago. Homes listed for more than $1,000,000 increased to 23% of the inventory over the past 12 months; during this same period homes sales of $1,000,000 or more accounted for 3% (6 sales) of the total 235 homes sold.
Condominium
· The lowest price range (under $100,000) is now 11% and approaching the 2010 level of 9% of inventory, after more than tripling in 2014, when this price range represented 30% of condominium inventory.
· The second tier ($100,000 to $200,000) has consistently included between one-third and one-half the inventory over the 10 year period.
· Condominiums listed for more than $200,000 are nearly 60% of the inventory, almost a 20% increase over the 10 year period.
Land
· The lowest price range (under $50,000) nearly doubled over the 10 year period, from 20% of total inventory in 2010 to 35% of all lots for sale in 2019.
· The middle tier ($50,000 to $300,000) decreased by 15% over the 10 year period, as lot prices were reduced to reflect market conditions.
· Lots listed for more than $300,000 have remained constant at about 12% of the inventory over the 10 year period.
Information is from MLS and deemed to be reliable, but is not guaranteed.
Prepared by:
Julie San Martin
Team Manager
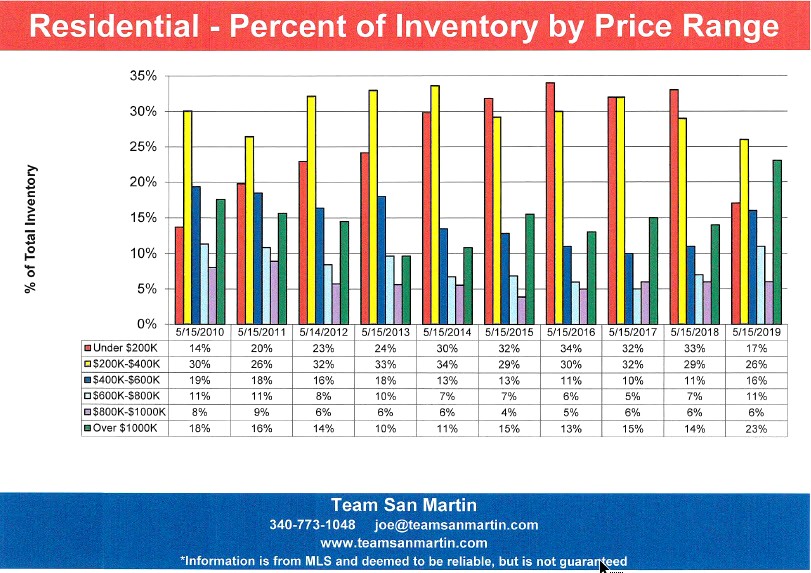
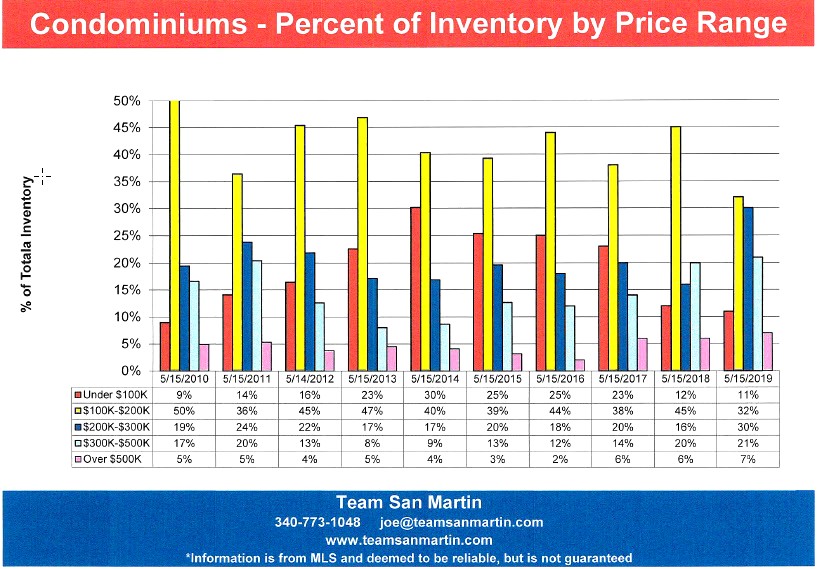
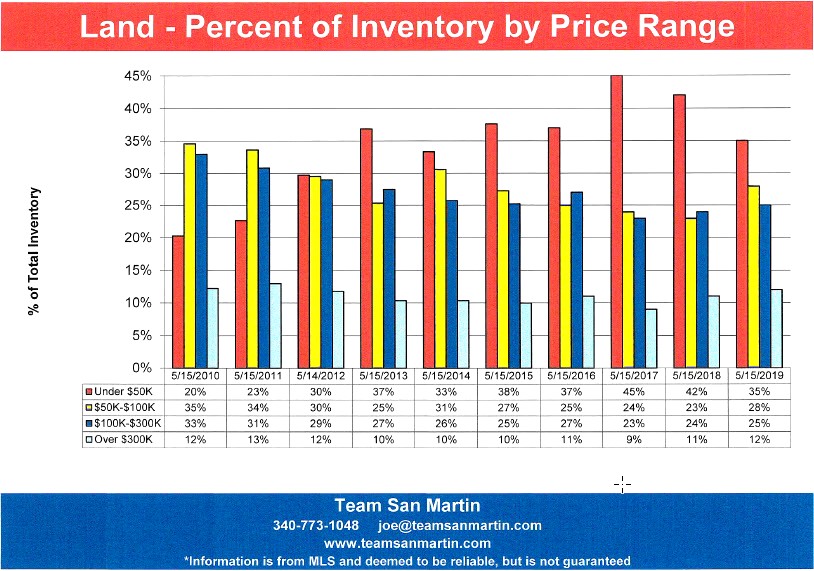
May 2019
Inventory Levels and Sales Projections
May Inventory Levels
9 Year Review
Residential
Residential inventory peaked in 2012 at 330 homes for sale and has steadily declined since then. Current inventory of 144 homes for sale is 56% lower (186 homes) than May 2012 residential inventory.
Condominium
Condominium inventory also peaked in 2012, at 230 condominiums for sale, and has steadily declined since then. Current inventory of 44 condos is less than one fifth of the May 2012 condominium inventory.
Land
Land inventory peaked in 2011 at 575 lots, steadily declining until 2014, then began to again increase. Current inventory of 492 lots is 86% of the 2011 inventory.
May Pending Sale Levels
9 Year Review
Residential
Residential pending sales peaked in May 2016, at 85 pending residential sales, and have been robust since, at nearly twice the level of earlier in the decade.
Condominium
The condominium inventory
has continuously declined since May 2012. Meanwhile the number of pending condo
sales has steadily increased and is currently at 86% of the inventory!
Land
Pending land sales remained relatively constant over the first 8 years. The 2019 figure of 48 pending land sales is the highest for the 9 year period.
2019 Sales Predictions
Using the assumption that the first 4 months of 2019 is a valid predictor for the entire year.
Residential
The first four months predict there will be exactly the same number of homes sold during 2019 (207) as were sold during 2018. This number represents a 25% increase in the number of home sales, compared to the 2014 through 2017 periods.
Condominium
The first four months predict there will be 141 condominium sales during 2019. With a current inventory of only 35 condominiums for sale, this is unlikely.
Land
Using the first 4 months sales as a predictor, 117 land sales are forecast for 2019. During 2018, 120 land sales closed, the highest number of land sales since 2009. The land market is definitely improving!
Information is from MLS and deemed to be reliable, but is not guaranteed.
Prepared by:
Julie San Martin
Team Manager
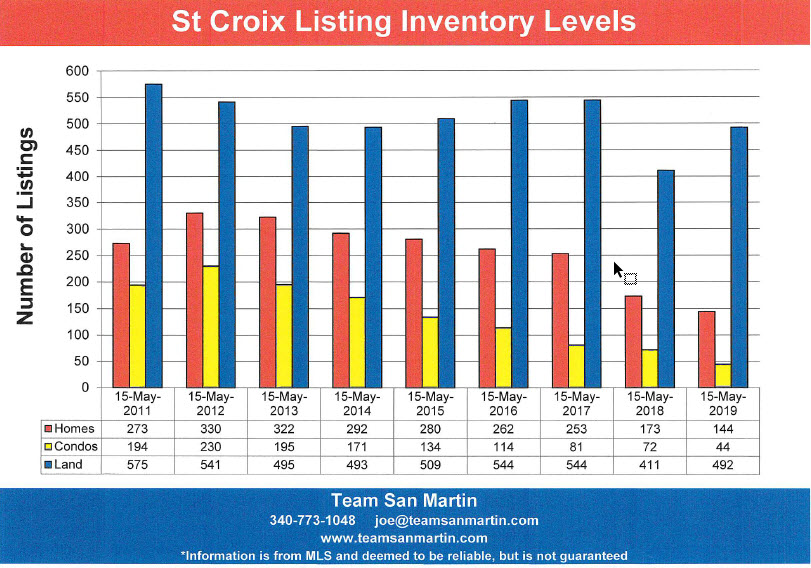
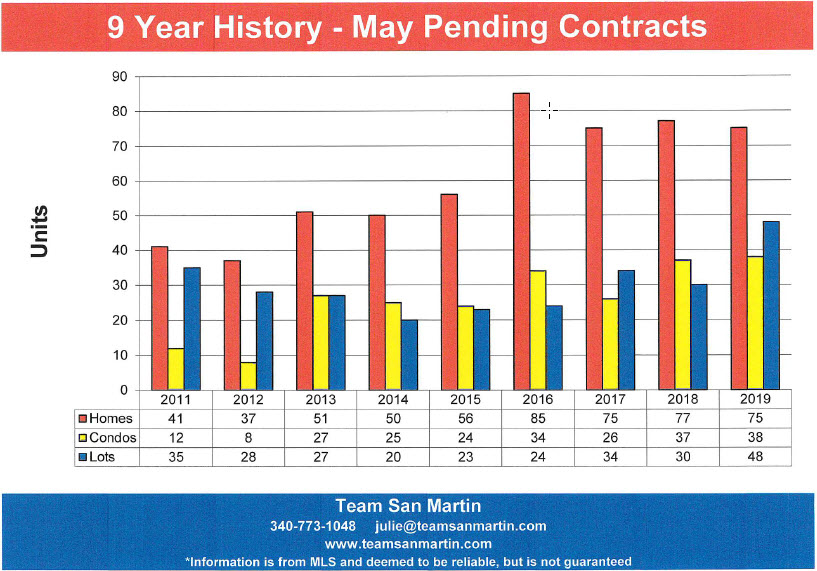
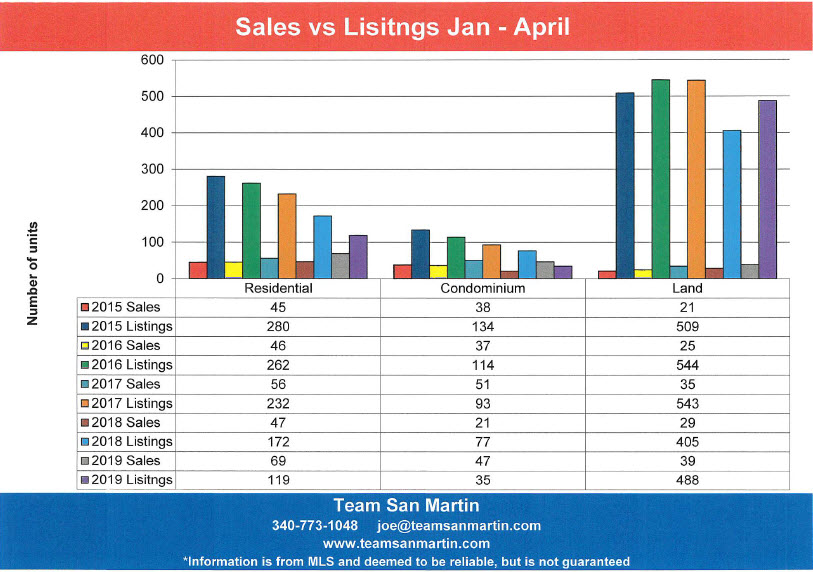
April 2019
1st Quarter Sales as Predictor for the full year
2019 is the 11th year of the St Croix real estate market “recovery” from the real estate boom years of 2006 through 2008. The two Category 5 hurricanes in September 2017 were not helpful.
The question is – what do the 1st quarter statistics predict about market prospects for the rest of the year?
First, a look at inventory trends over the
11 year period:
· Residential inventory peaked in 2012, at 340 homes for sale, and has continually declined each year since. Current residential inventory levels are at only 36% (121 homes) of the 2012 level, a significant decline.
· Condominium inventory peaked in 2010, with 265 condominiums on the market. The current level of 46 condominiums for sale is only 17% of the 2010 inventory.
· Land inventory also peaked in 2010, at 610 lots for sale. First quarter 2019 inventory is the only segment of the real estate market with increasing inventories, currently at 82% (501 lots) of the 2010 inventory levels.
Residential Sales & 2019 Predictions
With the exception of 2017 (Irma Maria Hurricanes), the actual number of homes sold annually has exceeded the prediction based on 1st quarter sales. However, it will be difficult to sell 204 homes when there are only 121 homes listed for sale and average days on the market of 10 months.
With the exception of 2009 through 2011, the 1st quarter average sales price was a fairly accurate predictor of the annual home sales price. The 2019, 1st quarter average sales price predicts a $100,000 increase in average homes sale price, from $329,272 for 2018 to $429,671 for 2019.
Here is the prediction for 2019 overall:
· Total number of homes sold will be fewer than predicted, around 120, representing about a 40% decreased from total number of homes sold during 2018.
· Average sales price will most likely be in the $400,000 range.
Condominium Sales & 2019 Predictions
This is a much smaller market, with just a few units built since the 1980s. It is more difficult to identify trends, because the sample is significantly smaller.
Beginning in 2014, there have been more than 100 condominium sales annually on St Croix. This level of sales will be difficult to sustain, with only 46 condominiums for sale and an average days on the market of 7 months.
1st quarter average sale price has, in most cases, overestimated the average annual condominium sales price.
Here is the prediction for 2019 overall:
· Total number of condominiums sold will be in the 80 condo range. Put another way, approximately twice as many condos as are currently listed for sale (46) should sell in 2019.
· Average sales price will most likely be in the $180,000 range.
Land Sales & 2019 Predictions
Both predicted and actual number of lots sold are trending in the right direction, at last! A sign of market recovery!
Since 2014, the average lot sales price has consistently been in the $70,000 range. With the exception of 2017 (Irma Maria), predications based on 1st quarter land sales prices for this period have been accurate.
Here is the prediction for 2019 overall:
· Total number of lots sold will be about 120, similar to 2018.
· The 2019 average lot sales price will be in the $70,000 range, similar to the previous 5 years.
Information is from MLS and deemed to be reliable, but is not guaranteed.
Prepared by:
Julie San Martin
Team Manager
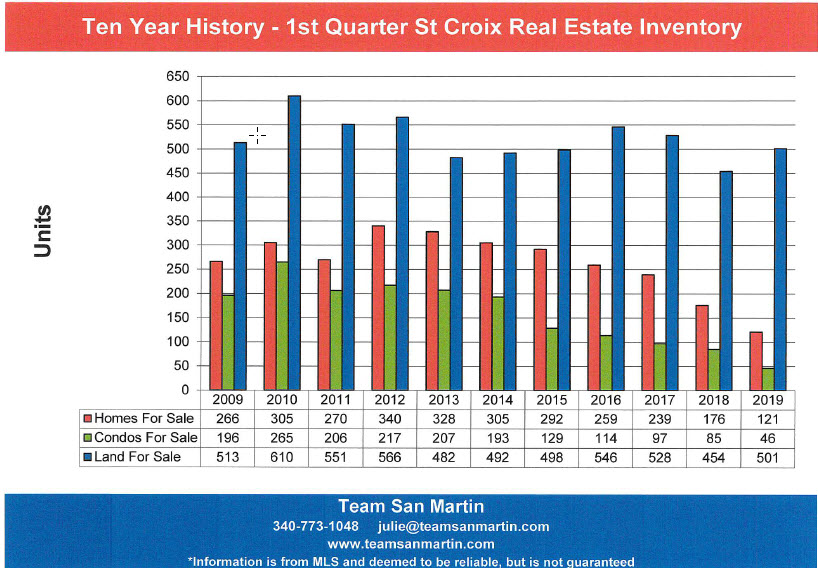
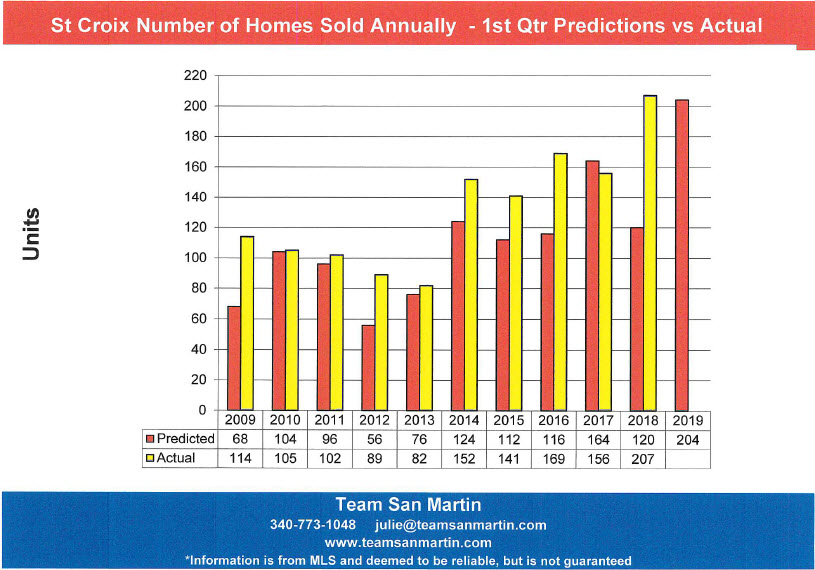
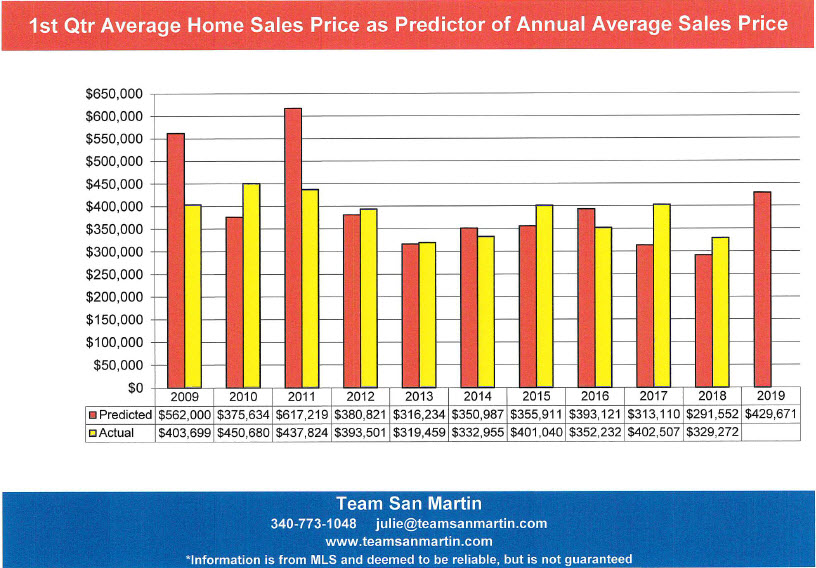
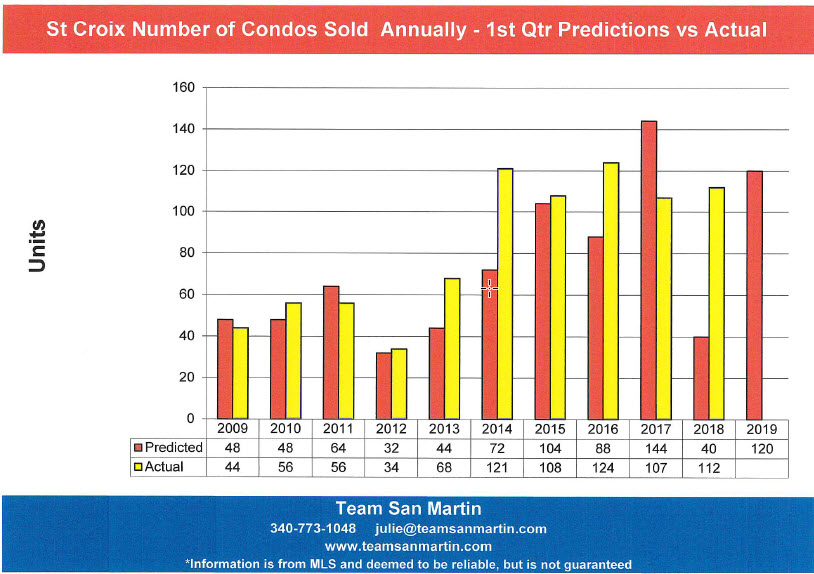
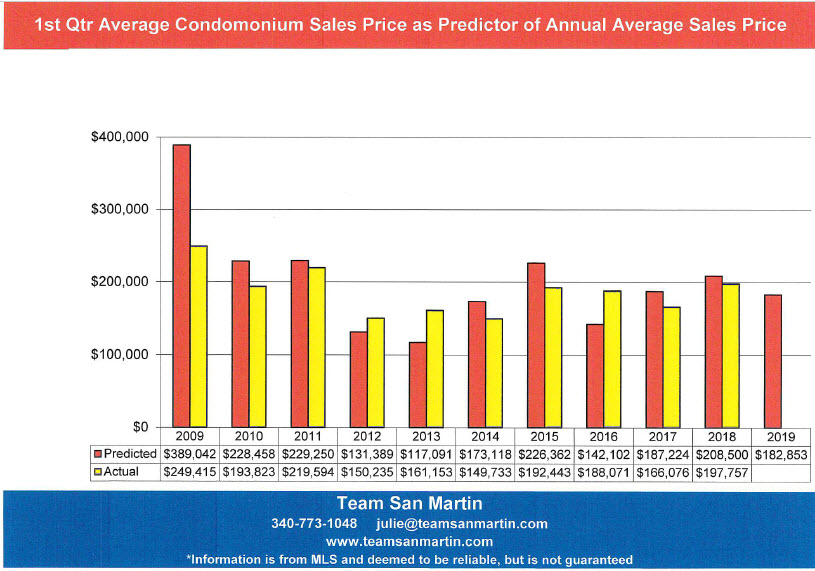
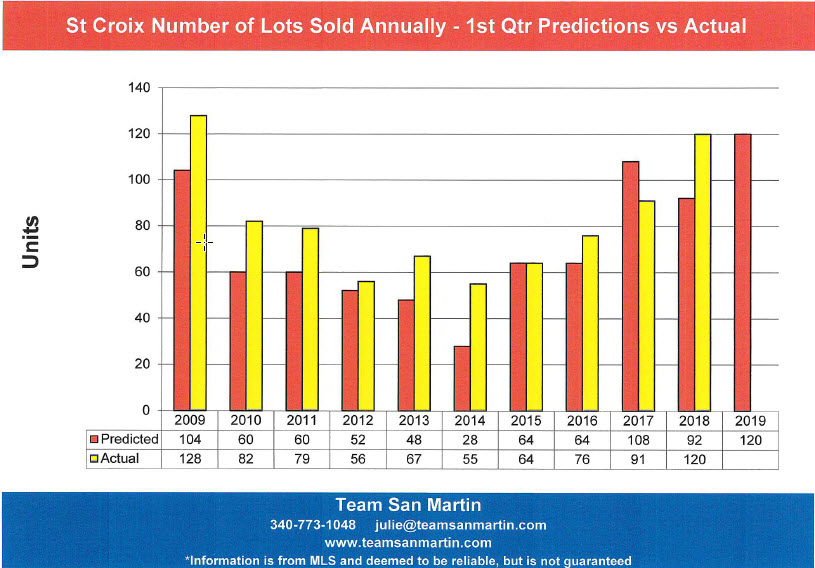
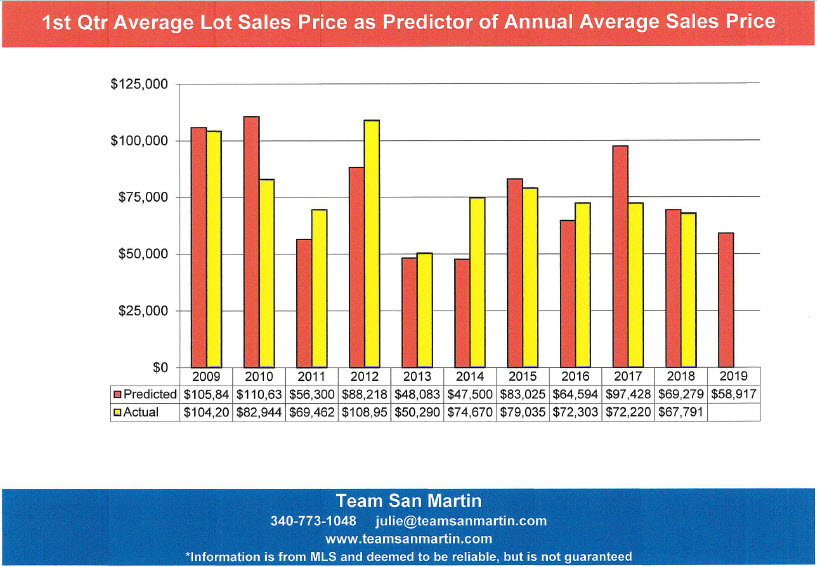
March 2019
Home Sales
St Thomas vs St Croix
A 16 Year Look
Total Number of Properties Sold
· Over the 16 year period, more homes sold every year on St Croix than on St Thomas.
· During 2018, more homes sold on both St Thomas (133) and St Croix (207) than had sold during any of the previous 15 years.
· Over the 16 year period, the fewest number of homes sold on St Croix (88) was during 2012, the fewest number of home sold on St Thomas (53) was during 2011.
· During 2018, 74 more homes were sold on St Croix, compared to St Thomas.
· Compared to 2017, 45 more homes were sold on St Thomas during 2018 and 51 more homes were sold on St Croix during 2018.
Average Sales Price
· At the beginning of this 16 year period (2003), average sales prices for St Thomas and St Croix were nearly identical, at an average of $415,823.
· For the past 15 years (since 2004), the annual average home sales price on St Thomas has exceeded that of St Croix.
· For 2018, the average St Thomas homes price was 28% higher, at $533,800, than the 2003 average sales price. The average annual home sales price on St Croix for 2018 was 21% lower, at $329,272, than the 2003 average sales price.
· For 2018, the average sale price of a home on St Croix ($329,272) was 62% of the averages sales price of a home on St Thomas ($533,800).
Total Market in Millions of Dollars
· This measurement is a combination of total homes sold multiplied by average sales price; it gives the best overview of annual market performance.
· During this 16 year period, the total St Thomas residential market exceeded the total St Croix market during six years: 2008, 2012, 2013, 2014, 2015, and 2018.
· During 2018, the total St Thomas residential market exceeded the total St Croix residential market by about $3 Million.
Information is from MLS and deemed to be reliable, but is not guaranteed.
Prepared by:
Julie San MartinTeam Manager
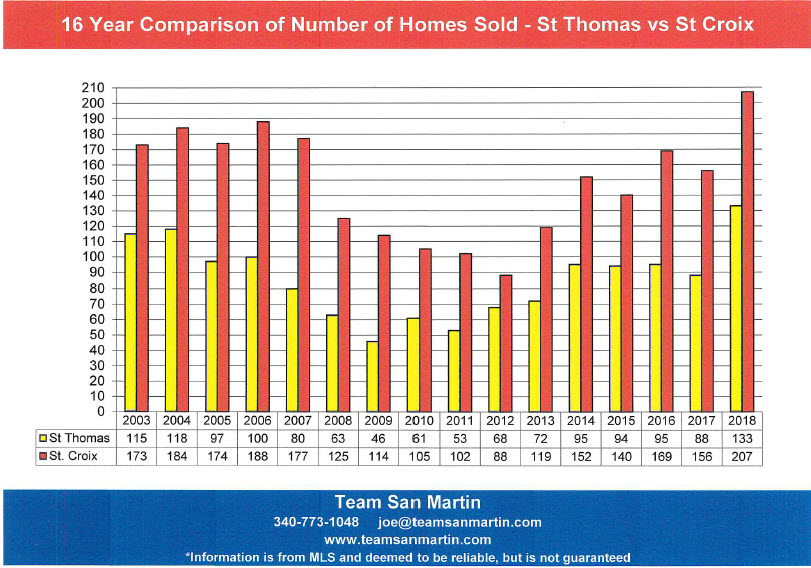
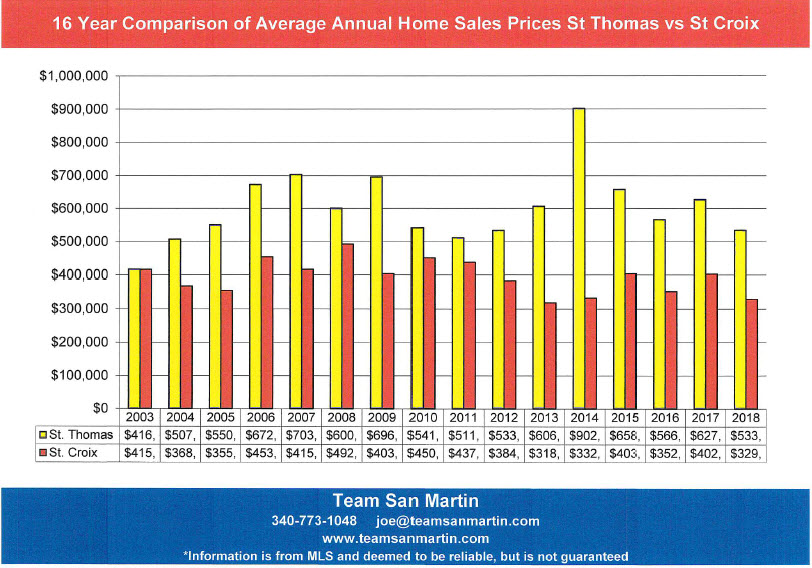
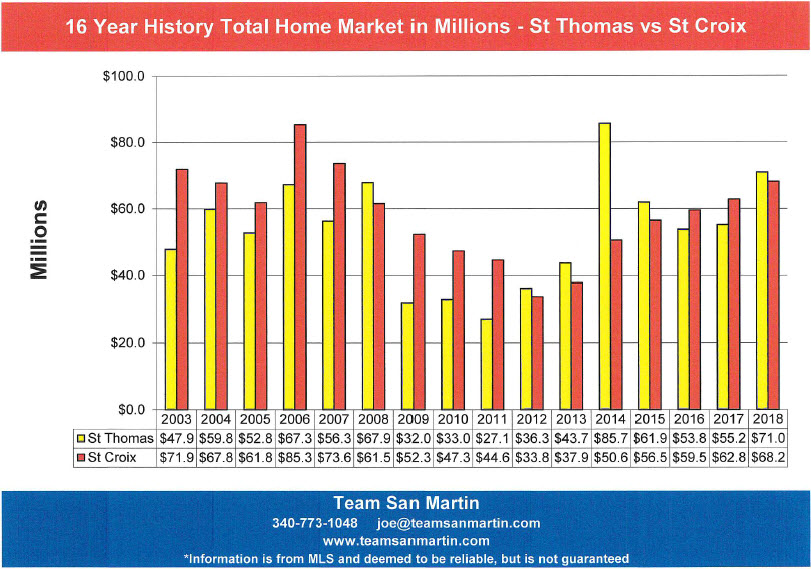
February 2019
The St Croix Real Estate Cycle
A 16 Year Look
Total Number of Properties Sold
· More homes sold on St Croix during 2018 than were sold during any of the previous 15 years! The next highest number of homes sold was 188 during 2006, the height of the real estate boom.
· During 2018, 111 condominiums sold on St Croix, very similar numbers to the previous 4 years. Nearly twice as many condos sold during 2005 (208 condos). The fewest condos sold in 2012, when only 34 condominiums sold.
· There were 119 lots sales in 2018, the highest number of lots sold on St Croix since 2009.
Average Sales Price
· The average 2018 home sales price ($329,559) was $83,880 lower than the 2003 average home sales price of $413,439. The only lower average home sales price during the 16 year period was in 2013 ($319,459).
· The 2018 average condominium sales price ($196,971) is $52,148 higher than the average condo price in 2003 ($144,823). The 2018 average condo sale price is similar to the average condominium sales price for the previous three years.
· The average 2018 lot sales price ($68,045) is $23,270 lower than the average lot sale price for 2003 ($91,315). Over the 16 year period, only 2013 saw a lower average lot sales price ($50,290).
Total Market in Millions of Dollars
· The 2018 total residential market ($67.9 million) was about $5 million higher than the 2017 total residential market ($62.8 million) and about $4 million lower than the total 2003 residential market ($71.9 million).
· The 2018 total condominium market ($21.9 million) was $4.2 million higher than the total 2017 condominium market ($17.7 million) and $1.6 million higher than the total 2003 condo market of $20.3 million.
· The 2018 total land market ($8.1 million) exceed the previous year by $1.6 million. But the total land market is still $9 million below our total land market of 16 years ago ($17.1 million) and $33.2 million below the height of the market during this 16 year period (2006 with a total land market of $41.3 million).
Information is from MLS and deemed to be reliable, but is not guaranteed.
Prepared by:
Julie San Martin
Team Manager
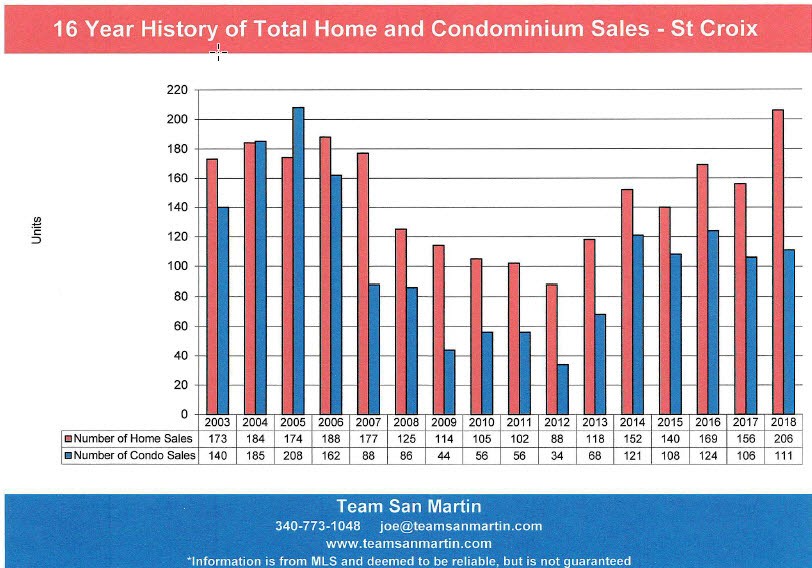
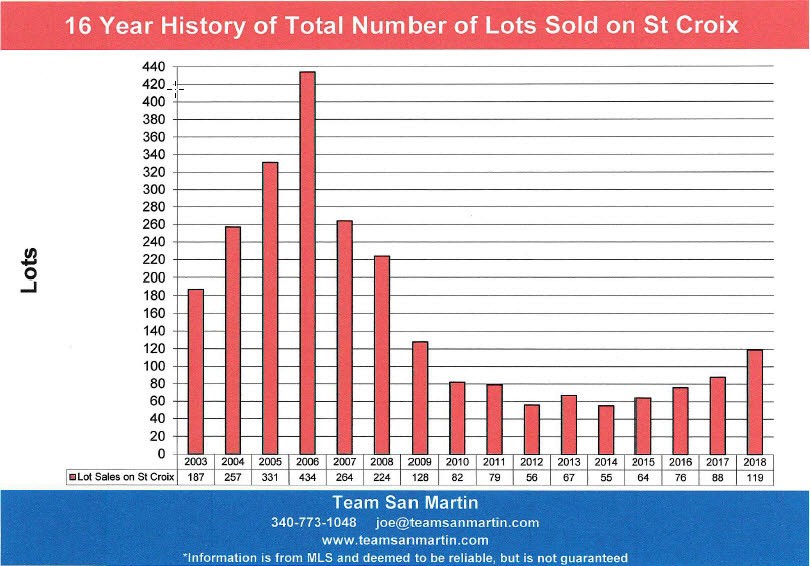
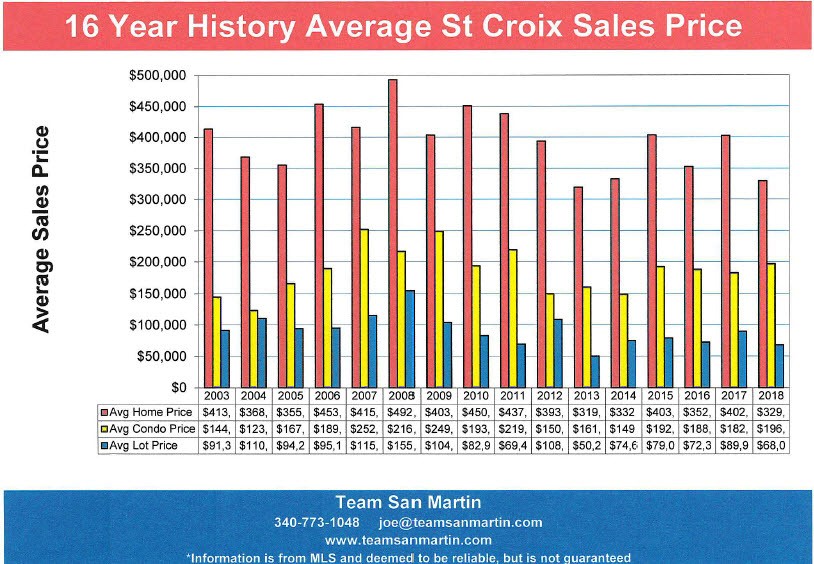
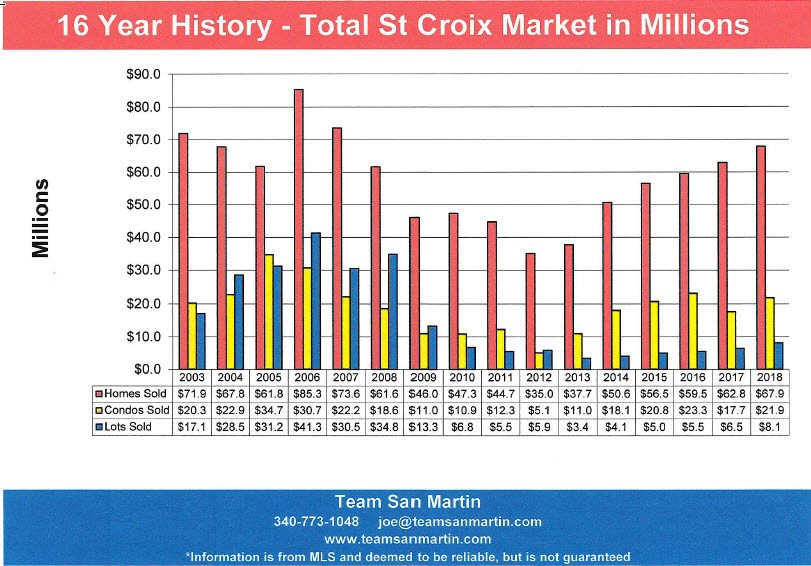
January 2019
7 Year St Croix Home Sales Price Trends
The average sales price of a home on St Croix decreased by $63,061 over the 7 year period; this is a 16% decrease.
Total number of homes sold increased 130% (116 homes) since 2012.
All areas of the island did not perform the same.
East End B
Far East End
Compared to 7 years ago, the average sales price of a home decreased 31% ($210,979).
The number of homes sold in a year increased by 4 homes compared to 7 years ago;
12 homes sold in 2012, 16 homes sold in 2018.
East End A
Christiansted East to Coakley Bay
Compared to 7 years ago, the average sales price of a home decreased 50% ($432,185) from $859,500 for 2012 to $427,315 for 2018.
Nearly 5 times as many homes sold in 2018 (48) compared to 7 years ago, when 10 homes sold.
Company
Christiansted West to the East Side of Judiths Fancy
Compared to 7 years ago, the average sales price of a home increased 59% ($119,518), from $202,367 for 2012 to $321,885 for 2018.
The number of homes sold in a year increased by 9 homes,
from 15 home sales in 2012 to 24 home sales in 2018.
Queen
Constitution Hill West to La Reine, includes southwest
Judiths Fancy
Compared to 7 years ago, the average sales price of a home increased 13% ($31,995) from $242,003 for 2012 to $273,998 for 2018.
The number of homes sold in a year has doubled since 2012, from 22 homes sold in 2012 to 45 home sales in 2018.
Northside A & B
North Shore from North Judiths Fancy to Hamms Bluff
Compared to 7 years ago, the average sales price of a home increased 22% ($101,794), from $458,576 for 2012 to $560,370 for 2018.
The number of homes sold in a year is unchanged from 2012; 13 homes sales closed in both 2012 and 2018.
King
South Shore from La Reine West to UVI
Compared to 7 years ago, the average sales price of a home increased 44% ($41,506), from $94,750 for 2012 to $136,256 for 2018.
More than 4 times as many homes closed in 2018 (9 home sales), compared to 2012 (2 home sales).
Prince
South Shore from UVI West to Williams Delight
Compared to 7 years ago, the average sales price of a home decreased 13% ($33,100), from $256,000 for 2012 to $223,500 for 2018.
More than twice as many homes sold during 2018 (13 home sales) as compared to
2012 (5 home sales).
West End
South Shore, South from Mahogany Road,
East to Williams Delight
Compared to 7 years ago, the average sales price of a home increased 15% ($30,563), from $203,500 for 2012 to $234,063 for 2018.
Three times as many homes sold during 2018 (30 home sales) than during 2012
(10 home sales).
Observations
Average home sales prices in three areas of the island consistently exceed the
island wide “average” home sales price:
· East End B
· East End A
· Northside A & B
Average home sales prices in three areas of the island are consistently much lower than the island wide “average” home sales price:
· King
· Prince
· West End
Center island average home sales prices are about “average”:
· Company
· Queen
More homes sold in all quarters during 20187, when compared to 2012, except for Northside A & B, where the same number of homes sold as did 7 years ago (13).
Compared to 2017, the island wide average home sale price decreased 16%.
These quarters experienced decreased average home sales prices:
· East End B
· Queen
· Northside A & B
· King
Compared to 2012, these quarters had higher average home sales prices:
· Company
· Queen
· Northside A & B
· King
· West End
Compared to 2012, these quarters had lower average home sales prices:
· East End B
· East End A
· Prince
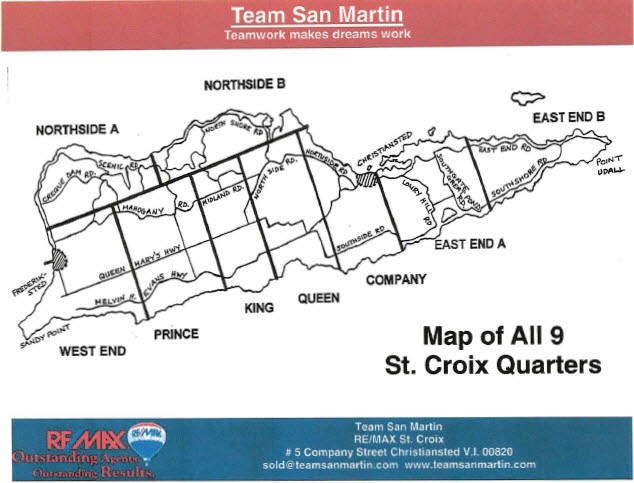
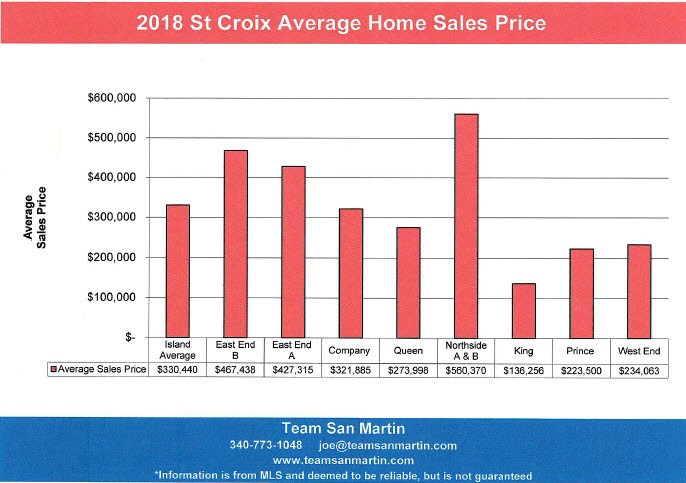
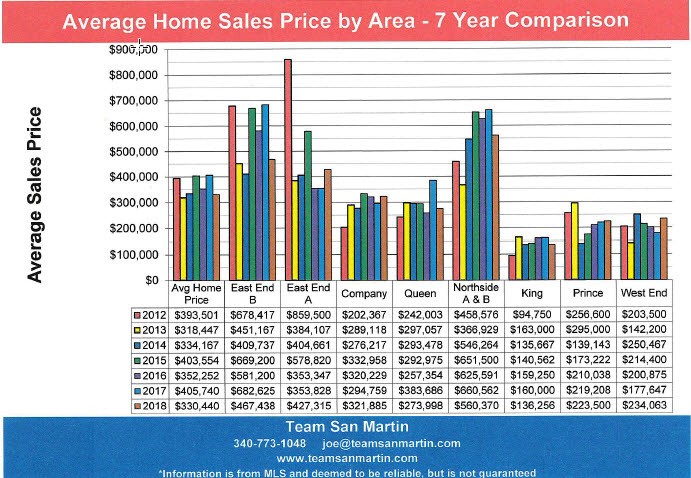
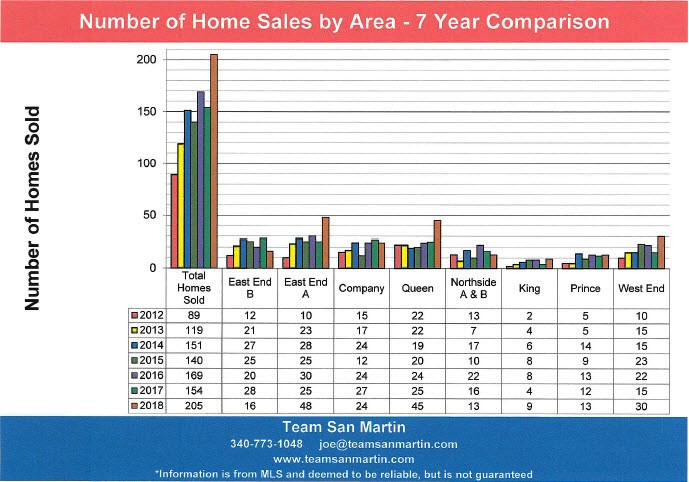
Information is from MLS and deemed to be reliable, but is not guaranteed.
Prepared by:
Julie San Martin
Team Manager
December 2108
Inventory Level Trends
Current Annual supply represents the number of years it will take at the current rate of sales to sell all the properties listed in a specific area (Quarter) of St Croix.
[Active Listings + Pending Listings] /
Number of Listings Sold During the Previous 12 Months
For example:
In November 2018, there were 23 active and 4 pending home sales in East End B, with 16 home sales in the previous 12 months, for a 1.7 year supply of homes for sale
[23 + 4] / 16 = 1.7 Years or 20 months
East End B
Far East End
Residential
Compared to 7 years ago, home inventory decreased by 1 year and average sales price is 46% ($410,533) lower
(from $888,908 to $478,385)
Compared to last year, average time on the market increased by 9.6 months; average sales price decreased 28% (from $668,759 to $478,385)
Condominium
Compared to 7 years ago, condominium inventory decreased by 23 months (from 2.6 years to 0.7 years); average sales price decreased by 35%
(from $370,846 to $241,246)
Compared to last year, average time on the market decreased by about 5 months;
average sales price decreased by 5% (from $253,785 to $241,246)
Vacant Land
Compared to 7 years ago, land inventory levels are unchanged at 8.2 years;
average sales price decreased 10% (from $79,929 to $72,308)
Compared to last year, land inventory increased by 3.5 years;
average sales price decreased 6% (from $77,138 to $72,308)
East End A
Christiansted East to Coakley Bay
Residential
Compared to 7 years ago, home inventory decreased by nearly 2 years;
average home sale price increased by 41% (from $307,597 to $434,085)
Compared to last year, residential inventory decreased by about 10 months;
average sales price increased 21% (from $357,604 to $434,085)
Condominium
Compared to 7 years ago, condominium inventory has decreased 2.7 years (from 3 years to 0.3 years);
average condominium sales price decreased 1% (from $242,556 to $240,244)
Compared to last year, condominium inventory increased by 2 years,
to less than a 4 month supply;
average sales price increased 58% (from $152,129 to $240,244)
Vacant Land
Compared to 7 years ago, land inventory is about the same at 5.1 years;
average lot sales price increased by 61% (from $54,421 to $87,433)
Compared to last year, land inventory decreased by 8 months;
average lot sales price decreased 14% (from $101,464 to $87,433)
Company
Christiansted West to the East Side of Judiths Fancy
Residential
Compared to 7 years ago, residential inventory decreased by 6 years;
average home sales price increased 14% (from $275,571 to $314,009)
Compared to last year, residential inventory decreased by 2 months;
average home sales price increased 14% (from $275,274 to $314,009)
Condominium
Compared to 7 years ago, condominium inventory decreased by 18 months (from 2.3 years to 0.8 years);
average sales price increased 22% (from $124,992 to $153,172)
Compared to last year, condominium inventory is unchanged at about 10 months; average sales price has increased 8% (from $142,067 to $153,172)
Vacant Land
Compared to 7 years ago, land inventory increased by 2 years
(from 3.8 years to 5.8 years);
average sales price increased 170% (from $66,433 to $179,580)
Compared to last year, land inventory increased by 11 months,
while average sales price increased 74% (from $103,000 to $179,580)
Queen
Constitution Hill West to La Reine, includes southwest
Judiths Fancy
Residential
Compared to 7 years ago, residential inventory decreased by 22 months
(from 2.9 years to 1.1 years);
average sales priced decreased 38% (from $427,342 to $265,994)
Compared to last year, residential inventory decreased by 1.5 years (17 months);
average sales price decreased 32% (from $390,012 to $265,994)
Condominium
Compared to 7 years ago, condominium inventory decreased by more than 6 years (from 6.8 years to 7 months);
average condominium sales price increased 14% (from $102,250 to $116,673)
Compared to last year, condominium inventory increased by 2 months;
average sales price increased 8% (from $108,263 to $116,673)
Vacant Land
Compared to 7 years ago, land inventory decreased by 12.5 years
(from 16.2 years to 3.6 years);
average lot sales price decreased 3% (from $61,000 to $59,357)
Compared to last year, land inventory decreased by nearly 3 years;
the average lot sales price decreased 12% (from $67,314 to $59,357)
Northside A & B
North Shore from North Judiths Fancy to Hamms Bluff
Residential
Compared to 7 years ago, residential inventory decreased by 2 years;
average home sales price decreased 3% (from $592,312 to $575,818)
Compared to last year, residential inventory increased by 6 months;
average home sales price decreased 9% (from $632,294 to $575,818)
Condominium
Compared to 7 years ago, condominium inventory decreased by 3.7 years (from 4.7 years to 1 year);
average sales price decreased 52% (from $440,000 to $212,400)
Compared to last year, condominium inventory decreased by 1 year;
average sales price decreased 42% (from $369,167 to $212,400)
Vacant Land
Compared to 7 years ago, land inventory decreased by 11 years
(from 14 years to 3 years);
average lot sales price increased 32% (from $59,333 to $78,542)
Compared to last year, land inventory decreased by 3 years;
average lot sales price increased 13% (from $69,333 to $78,542)
King
South Shore from La Reine West to UVI
Residential
Compared to 7 years ago, residential inventory decreased by 2 years
(from 4 years to 1.9 years);
average home sales price decreased 45% (from $247,800 to $135,644)
Compared to last year, residential inventory decreased by 5 years
(from 7 years to 1.9 years);
average residential sales price decreased 31% (from $196,667 to $135,644)
Condominium
There are no condominium complexes in King Quarter
Vacant Land
7 years ago, no land sales were reported in King Quarter during the 12 month period ending November 2011.
Compared to last year, land inventory decreased by 4 years
(from 7.5 years to 3.6 years);
average lot sales price increased 36% (from $20,500 to $27,940)
Prince
South Shore from UVI West to Williams Delight
Residential
Compared to 7 years ago, residential inventory by 1 year
(from 2.6 years to 1.7 years);
average residential sales price decreased 9% (from $239,519 to $217,227)
Compared to last year, residential inventory is unchanged at 1.7 years;
average residential sales price increased 4% (from $208,115 to $217,227)
Condominium
Compared to 7 years ago, condominium inventory decreased by 2.8 years (from 3.7 years to 0.9 years);
average condominium sales price decreased 28% (from $288,333 to $208,129)
Compared to last year, condominium inventory decreased by 4 years
(from 5 years to 0.9 years);
average condominium sale price increased 30% (from $160,000 to $208,129)
Vacant Land
Compared to 7 years ago, land inventory decreased by 6 years
(from 9.3 years to 3.4 years);
average lot sales price decreased 34% (from $50,714 to $33,375)
Compared to last year, land inventory is unchanged at 3.4 years;
average lot sales price increased 30% (from $25,690 to $33,375)
West End
South Shore, South from Mahogany Road,
East to Williams Delight
Residential
Compared to 7 years ago, residential inventory decreased by more than 2 years
(from 2.9 years to 0.7 years);
average home sale price increased 53% (from $157,512 to $241,535)
Compared to last year, residential inventory decreased by 17 months
(from 2.1 years to 0.7 years);
average home sale price increased 36% (from $177,647 to $241,535)
Condominium
Compared to 7 years ago, condominium inventory decreased by 1.5 years (from 2.3 years to 0.8 years);
average condominium sale price increased 5% (from $146,250 to $153,375)
Compared to last year, condominium inventory increased by 2 months;
average condominium sales price is unchanged at $153,375.
Vacant Land
Compared to 7 years ago, land inventory decreased 2 years
(from 10.9 years to 8.8years);
average lot sales price increased 119% (from $32,222 to $70,727)
Compared to last year, land inventory increased by 3.3 years
(from 12.1 years to 8.8 years);
average lot sales price increased 118% (from $22,214 to $70,727)
Information is from MLS and deemed to be reliable, but is not guaranteed.
Prepared by:
Julie San Martin
Team Manager
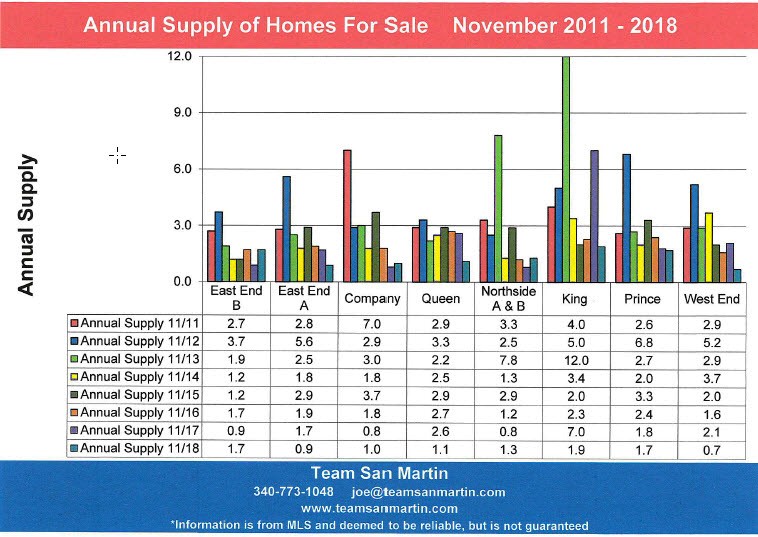
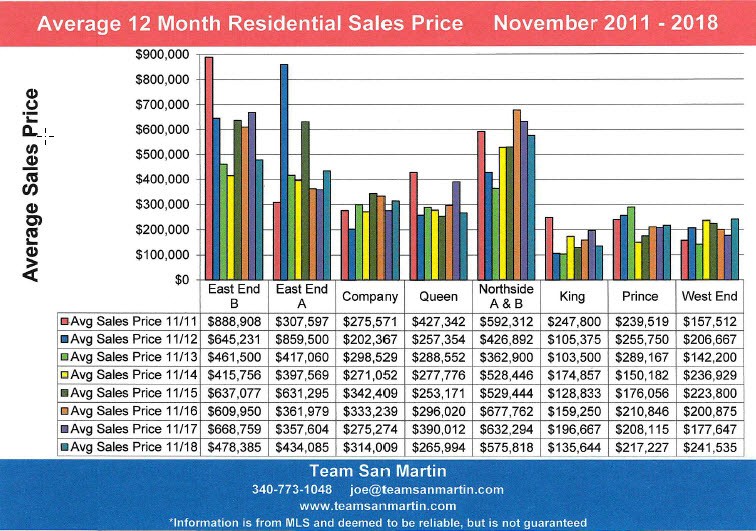
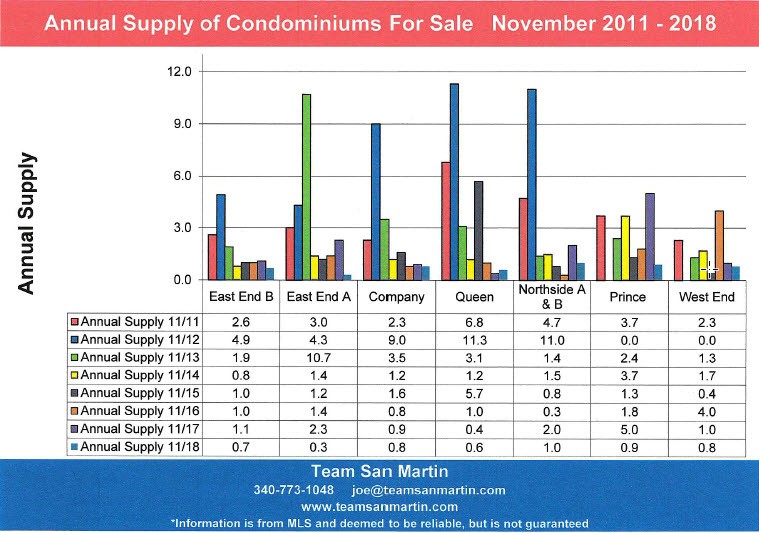
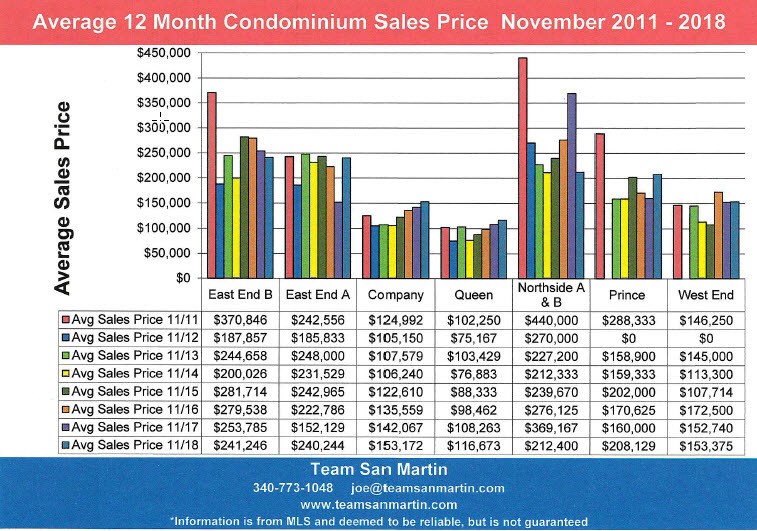
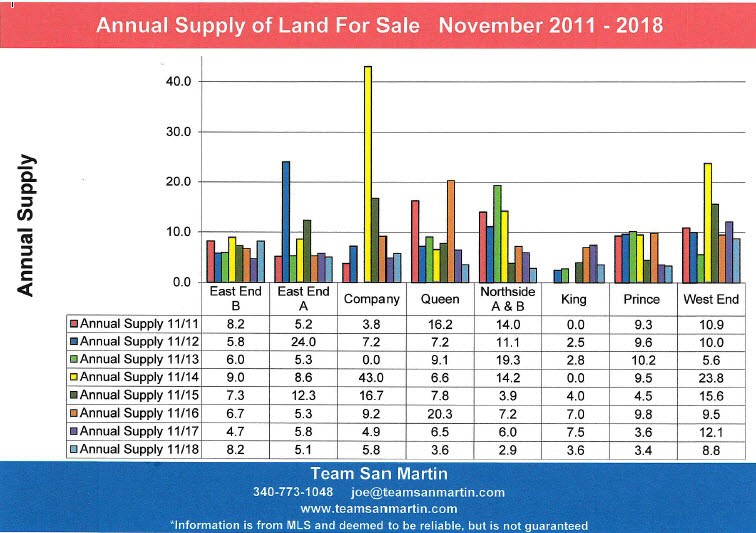
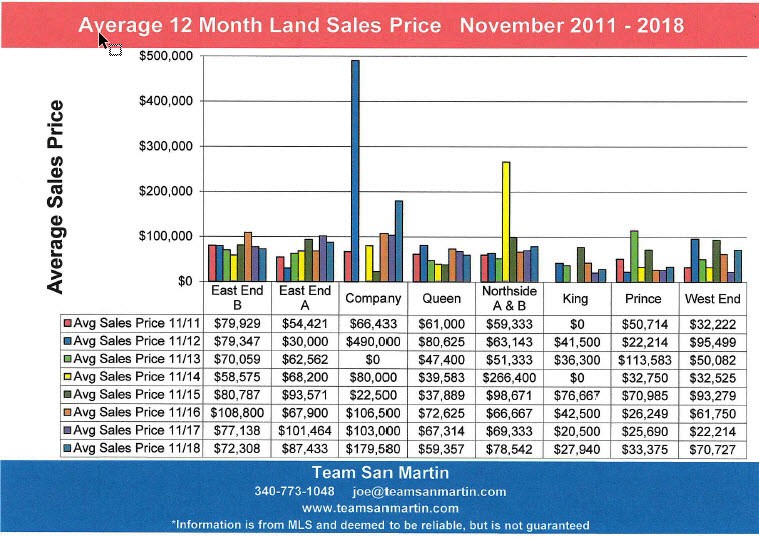
November 2018
Which St Croix Price Ranges are Selling?
First 10 months of 2014, 2105, 2016, 2017, and 2018
Residential
2014
134 home sales closed January through October; there were 308 homes for sale
2.3 sellers for every buyer
2015
111 home sales closed January through October; there were 273 homes for sale
2.5 sellers for every buyer
2016
143 home sales closed January through October; there were 240 homes for sale
1.7 sellers for every buyer
2017
130 home sales closed January through October; there were 200 homes for sale
1.5 sellers for every buyer
2018
166 home sales closed January through October; there were 143 homes for sale
0.86 sellers for every buyer
Condominium
2014
101 condominium sales closed January - October; there were 154 condos for sale
1.5 sellers for every buyer
2015
88 condominium sales closed January - October; there were 127 condos for sale
1.4 sellers for every buyer
2016
106 condominium sales closed January - October; there were 79 condos for sale
0.75 sellers for every buyer
2017
92 condominium sales closed January - October; there were 81 condos for sale
0.88 sellers for every buyer
2018
94 condominium sales closed January - October; there were 47 condos for sale
0.5 sellers for every buyer
Vacant Land
37 land sales closed January through October; there were 522 lots for sale
14.1 sellers for every buyer
2015
62 land sales closed January through October; there were 490 lots for sale
7.9 sellers for every buyer
2016
64 land sales closed January through October; there were 551 lots for sale
8.6 sellers for every buyer
2017
75 land sales closed January through October; there were 486 lots for sale
6.5 sellers for every buyer
2018
90 land sales closed January through October; there were 445 lots for sale
4.9 sellers for every buyer
SALES BY PRICE RANGE
Residential
|
2017 % of Sales |
2017 Sales |
2017 % of Sales |
2017 Sales |
2016 % of Sales |
2016 Sales |
2015 % of Sales |
2015 Sales |
2014 % of Sales |
2014 Sales |
Sales Price |
|
40% |
66 |
41% |
53 |
41% |
58 |
41% |
45 |
31% |
42 |
Under $200K |
|
28% |
46 |
25% |
32 |
31% |
45 |
31% |
34 |
36% |
48 |
$200K - $400K |
|
19% |
31 |
15% |
18 |
14% |
20 |
13% |
14 |
18% |
24 |
$400K - $600K |
|
8% |
13 |
8% |
11 |
6% |
8 |
9% |
10 |
10% |
14 |
$600K - $800K |
|
3% |
5 |
5% |
7 |
5% |
7 |
3% |
3 |
3% |
4 |
$800K - $1 Million |
|
3% |
5 |
7% |
9 |
3% |
5 |
5% |
5 |
1% |
2 |
Over $1 Million |
Condominium
|
2018 % of Sales |
2018 Sales |
2017 % of Sales |
2017 Sales |
2016 % of Sales |
2016 Sales |
2015 % of Sales |
2015 Sales |
2014 % of Sales |
2014 Sales |
Sales Price |
|
14% |
13 |
28% |
26 |
26% |
28 |
23% |
20 |
38% |
38 |
Under $100K |
|
46% |
43 |
49% |
45 |
40% |
42 |
45% |
39 |
43% |
43 |
$100K - $200K |
|
24% |
23 |
15% |
14 |
19% |
20 |
17% |
15 |
13% |
13 |
$200K - $300K |
|
15% |
14 |
6% |
6 |
13% |
14 |
13% |
11 |
6% |
6 |
$300K - $500K |
|
1% |
1 |
1% |
1 |
2% |
2 |
4% |
3 |
1% |
1 |
Over $500K |
Vacant Land
|
2018 % of Sales |
2018 Sales |
2017 % of Sales |
2017 Sales |
2016 % of Sales |
2016 Sales |
2015 % of Sales |
2015 Sales |
2014 % of Sales |
2014 Sales |
Sales Price |
|
64% |
58 |
62% |
62 |
48% |
31 |
52% |
32 |
68% |
25 |
Under $50K |
|
18% |
16 |
10% |
10 |
30% |
19 |
23% |
14 |
22% |
8 |
$50K - $100K |
|
16% |
14 |
|
0 |
20% |
13 |
21% |
13 |
8% |
3 |
$100K - $300K |
|
2% |
2 |
3% |
3 |
2% |
1 |
5% |
3 |
3% |
1 |
Over $300K |
Information is from MLS and deemed to be reliable, but is not guaranteed.
Prepared by:
Julie San Martin
Team Manager


October 2018
Ten Year Comparison
St Croix Real Estate Inventory Levels
TOTAL INVENTORY
Residential
49% lower (129 homes) than ten years ago.
Highest inventory during this period was 9/15/12 with 336 homes on the market
(200 more homes for sale than on 9/15/18)
Condominium
GIGANTIC decrease over the ten year period!
Ten years ago, there were five times as many condominiums on the market (236) as were for sale on 9/15/18 (46)
Vacant Land
23% lower (135 lots) than ten years ago.
Land inventory has slowly declined over the ten year period;
now at its lowest level, with 440 lots for sale on 9/15/18
INVENTORY BY PRICE RANGE
Residential
Under $200,000 listings have more than doubled (from 13% to 31%) as percentage of total inventory, compared to ten years ago.
$200,000 to $400,000 listings decreased by 5%, from 29% of inventory ten years ago to currently 24% of total inventory.
$400,000 to $600 listings have remained constant at about 15% of total inventory over the ten year period.
$600,000 to $800,000 listings have declined from 15% of total inventory to just 6% over the ten year period.
$800,000 to $1,000,000 listings remain unchanged over the ten year period at about 8% of total inventory.
Listings over $1,000,000 also have remained unchanged at about 19% of total inventory, with a decline to just 11% of total inventory in 2011.
Condominium
Under $100,000 listings are again 11% of total condo listings, as they were ten years ago. In 2013, this price range accounted for 29% of all condo listings.
$100,000 to $200,000 listings have decreased by 8% of total inventory, to about 39%, compared to ten years ago (47%).
$200,000 to $300,000 listings have increased by 4% as percentage of total inventory, at about 21%, compared to ten years ago (7%).
$300,000 to $500,000 listings have also increased by about 3%, from 17% to 20%, compared to ten years ago.
Listings over $500,000 again represent about 9% of the total condominium market, as they did ten years ago. In 2016, this segment of the market was only 3% of total condominium market.
Vacant Land
Under $50,000 listings have nearly doubled (from 21% to 40%) as percentage of total inventory, compared to ten years ago.
$50,000 to $100,000 listings have decreased by 5% as percentage of total inventory, from 30% to 25%, compared to ten years ago.
$100,000 to $300,000 listings have decreased by 7%, from 33% to 26%, compared to ten years ago.
Listings over $300,000 have decreased by 6% of the total inventory over the ten year period, from 16% on 9/15/09 to 10% on 9/15/18.
Information is from MLS and deemed to be reliable, but is not guaranteed.
Prepared by:
Julie San Martin
Team Manager
September 2018
A Tale of Two Islands
St Croix and St Thomas Real Estate Sales
Six Year Comparison Year to Date
2017 Data reflects the market prior to Irma Maria
2018 Data reflects our market after the storms
Number of Sales
Residential
Residential sales after the storm were robust. St Croix showed a slight increase in number of sales. St Thomas sales were nearly twice as numerous, compared to six years ago.
|
% increase (decrease) |
St Croix |
% increase (decrease) |
St Thomas |
Number of Homes Sold |
|
|
82 |
|
46 |
Jan – Aug 2013 |
|
+39% |
114 |
+46% |
67 |
Jan – Aug 2014 |
|
(-25%) |
85 |
(-19%) |
54 |
Jan – Aug 2015 |
|
+38% |
117 |
+37% |
74 |
Jan – Aug 2016 |
|
+5% |
123 |
+4% |
77 |
Jan – Aug 2017 |
|
+3% |
127 |
+9% |
84 |
Jan – Aug 2018 |
Condominium
Condominium sales were more affected by Irma Maria than residential sales. Compared to six years ago, condominium sales on both islands increased significantly.
|
% increase (decrease) |
St Croix |
% increase (decrease) |
St Thomas |
Number of Condos Sold |
|
|
54 |
|
52 |
Jan – Aug 2013 |
|
+52% |
82 |
+35% |
70 |
Jan – Aug 2014 |
|
(-16%) |
69 |
(-6%) |
66 |
Jan – Aug 2015 |
|
+16% |
80 |
+38% |
91 |
Jan – Aug 2016 |
|
+11% |
89 |
+7% |
98 |
Jan – Aug 2017 |
|
(-19%) |
72 |
(-28%) |
71 |
Jan – Aug 2018 |
Vacant Land
Vacant land sales declined significantly on St Thomas after the storms, St Croix land sales fared better.
|
% increase (decrease) |
St Croix |
% increase (decrease) |
St Thomas |
Number of Lots Sold |
|
|
41 |
|
21 |
Jan – Aug 2013 |
|
(-27%) |
30 |
+43% |
30 |
Jan – Aug 2014 |
|
+57% |
47 |
+27% |
38 |
Jan – Aug 2015 |
|
+15% |
54 |
(-29%) |
27 |
Jan – Aug 2016 |
|
+30% |
70 |
+59% |
43 |
Jan – Aug 2017 |
|
(-12%) |
62 |
(-33%) |
27 |
Jan – Aug 2018 |
Residential
Average Sales Price
Both islands experienced a decline in average sales price after the storms. Not unexpected, given the damage sustained.
|
% increase (decrease) |
St Croix |
% increase (decrease) |
St Thomas |
Average Home Sales Price |
|
|
$287,762 |
|
$665,130 |
Jan – Aug 2013 |
|
+16% |
$332,572 |
+16% |
$772,334 |
Jan – Aug 2014 |
|
+28% |
$426,719 |
(-11%) |
$689,658 |
Jan – Aug 2015 |
|
(-18%) |
$350,076 |
(-14%) |
$594,317 |
Jan – Aug 2016 |
|
+12% |
$393,754 |
(-2%) |
$583,676 |
Jan – Aug 2017 |
|
(-32%) |
$342,041 |
(-10%) |
$524,735 |
Jan – Aug 2018 |
St Thomas Home Sales Prices
|
|
Lowest |
Highest |
|
Jan – Aug 2013 |
$100,000 |
$3,300,000 |
|
Jan – Aug 2014 |
$34,000 |
$4,400,000 |
|
Jan – Aug 2015 |
$85,000 |
$6,000,000 |
|
Jan – Aug 2016 |
$49,000 |
$2,990,000 |
|
Jan – Aug 2017 |
$9,000 |
$3,200,000 |
|
Jan – Aug 2018 |
$55,000 |
$3,150,000 |
St Croix Home Sales Prices
|
|
Lowest |
Highest |
|
Jan – Aug 2013 |
$35,000 |
$800,000 |
|
Jan – Aug 2014 |
$35,000 |
$1,680,000 |
|
Jan – Aug 2015 |
$31,000 |
$6,250,000 |
|
Jan – Aug 2016 |
$40,000 |
$2,500,000 |
|
Jan – Aug 2017 |
$17,000 |
$2,212,500 |
|
Jan – Aug 2018 |
$37,500 |
$1,600,000 |
Median sales price is the midpoint - half of all homes sold for more than this price, half sold for less.
For St Thomas, the median sales price consistently decreased over the 6 year period. On St Croix, the median sales price remained at $280,000 for the last two years, after decreasing to just $220,000 for this period in 2016.
The St Croix median residential sales price is $100,000 lower than the current median residential sales price for St Thomas
Median Home Sales Price
|
% increase (decrease) |
St Croix |
% increase (decrease) |
St Thomas |
Median Home Sales Price |
|
|
$270,000 |
|
$515,000 |
Jan – Aug 2013 |
|
+11% |
$299,000 |
(-5%) |
$490,000 |
Jan – Aug 2014 |
|
(-15%) |
$255,000 |
No change |
$492,000 |
Jan – Aug 2015 |
|
(-14%) |
$220,000 |
No change |
$492,500 |
Jan – Aug 2016 |
|
+27% |
$280,000 |
(-18%) |
$405,000 |
Jan – Aug 2017 |
|
No change |
$279,000 |
(-6%) |
$380,000 |
Jan – Aug 2018 |
Average Sales Price
Condominium
St Croix average condominium sales prices increased significantly after the storms. St Thomas average condo sales price was nearly the same as before the storms,
|
% increase (decrease) |
St Croix |
% increase (decrease) |
St Thomas |
Average condo Sales Price |
|
|
$169,563 |
|
$223,604 |
Jan – Aug 2013 |
|
(-8%) |
$155,356 |
(-2%) |
$219,512 |
Jan – Aug 2014 |
|
+30% |
$202,402 |
+3% |
$227,064 |
Jan – Aug 2015 |
|
(-17%) |
$168,023 |
+21% |
$274,901 |
Jan – Aug 2016 |
|
(-2%) |
$164,630 |
(-7%) |
$254,416 |
Jan – Aug 2017 |
|
+23% |
$203,095 |
(-1%) |
$252,387 |
Jan – Aug 2018 |
St Thomas Condominium Sales Prices
|
|
Lowest |
Highest |
|
Jan – Aug 2013 |
$38,000 |
$550,000 |
|
Jan – Aug 2014 |
$39,000 |
$770,000 |
|
Jan – Aug 2015 |
$55,000 |
$940,000 |
|
Jan – Aug 2016 |
$30,000 |
$1,690,000 |
|
Jan – Aug 2017 |
$24,000 |
$665,000 |
|
Jan – Aug 2018 |
$320 |
$780,000 |
St Croix Condominium Sales Prices
|
|
Lowest |
Highest |
|
Jan – Aug 2013 |
$40,000 |
$545,000 |
|
Jan – Aug 2014 |
$30,000 |
$775,000 |
|
Jan – Aug 2015 |
$22,500 |
$1,150,000 |
|
Jan – Aug 2016 |
$22,500 |
$700,000 |
|
Jan – Aug 2017 |
$33,000 |
$570,000 |
|
Jan – Aug 2018 |
$34,000 |
$570,000 |
Over the six year period, the median condominium sales price on both St Thomas and St Croix increased about $25,000.
Median Condominium Sales Price
|
% increase (decrease) |
St Croix |
% increase (decrease) |
St Thomas |
Median Condo Sales Price |
|
|
$144,500 |
|
$173,750 |
Jan – Aug 2013 |
|
(-18%) |
$119,125 |
(-5%) |
$165,000 |
Jan – Aug 2014 |
|
+26% |
$150,000 |
+9% |
$180,000 |
Jan – Aug 2015 |
|
(-10%) |
$135,000 |
+19% |
$215,000 |
Jan – Aug 2016 |
|
+7% |
$145,000 |
+2% |
$220,000 |
Jan – Aug 2017 |
|
+17% |
$170,000 |
(-10%) |
$198,562 |
Jan – Aug 2018 |
Average Sales Price
Vacant Land
The average St Thomas land sales price is about the same as it was six years ago.
On St Croix, average land sale price increased by about $25,000.
|
% increase (decrease) |
St Croix |
% increase (decrease) |
St Thomas |
Average lot Sales Price |
|
|
$43,425 |
|
$108,357 |
Jan – Aug 2013 |
|
+85% |
$80,162 |
+16% |
$126,172 |
Jan – Aug 2014 |
|
(-3%) |
$78,055 |
(-26%) |
$91,737 |
Jan – Aug 2015 |
|
(-2%) |
$76,518 |
+97% |
$181,144 |
Jan – Aug 2016 |
|
(-7%) |
$71,529 |
+24% |
$225,455 |
Jan – Aug 2017 |
|
(-6%) |
$67,655 |
(-51%) |
$110,830 |
Jan – Aug 2018 |
St Thomas Land Sales Prices
|
|
Lowest |
Highest |
|
Jan – Aug 2013 |
$35,000 |
$250,000 |
|
Jan – Aug 2014 |
$15,000 |
$900,000 |
|
Jan – Aug 2015 |
$20,000 |
$370,000 |
|
Jan – Aug 2016 |
$8,000 |
$900,000 |
|
Jan – Aug 2017 |
$20,000 |
$2,100,000 |
|
Jan – Aug 2017 |
$30,000 |
$600,000 |
St Croix Land Sales Prices
|
|
Lowest |
Highest |
|
Jan – Aug 2013 |
$10,000 |
$120,000 |
|
Jan – Aug 2014 |
$8,000 |
$370,000 |
|
Jan – Aug 2015 |
$13,000 |
$348,000 |
|
Jan – Aug 2016 |
$16,000 |
$335,000 |
|
Jan – Aug 2017 |
$12,000 |
$500,000 |
|
Jan – Aug 2017 |
$1,200 |
$350,000 |
Median Land Sales Price
On both islands, the median lot sales price is nearly the same as 6 years ago.
|
% increase (decrease) |
St Croix |
% increase (decrease) |
St Thomas |
Median Lot Sales Price |
|
|
$34,500 |
|
$84,500 |
Jan – Aug 2013 |
|
+14% |
$39,500 |
+1% |
$85,000 |
Jan – Aug 2014 |
|
+1% |
$40,000 |
(-35%) |
$55,000 |
Jan – Aug 2015 |
|
+64% |
$65,500 |
+78% |
$98,000 |
Jan – Aug 2016 |
|
(-43%) |
$37,250 |
(-13%) |
$85,000 |
Jan – Aug 2017 |
|
+7% |
$40,000 |
(-6%) |
$80,000 |
Jan – Aug 2018 |
Total Market (Millions)
The 2018 St Thomas and St Croix total residential markets were nearly the same.
Residential
|
% increase (decrease) |
St Croix |
% increase (decrease) |
St Thomas |
Number of Homes Sold |
|
|
$23.6 |
|
$30.6 |
Jan – Aug 2013 |
|
+61% |
$37.9 |
+69% |
$51.7 |
Jan – Aug 2014 |
|
(-4%) |
$36.3 |
(-28%) |
$37.2 |
Jan – Aug 2015 |
|
+13% |
$41.0 |
+18% |
$44.0 |
Jan – Aug 2016 |
|
+18% |
$48.4 |
+2% |
$44.9 |
Jan – Aug 2017 |
|
(-10%) |
$43.4 |
(-2%) |
$44.1 |
Jan – Aug 2018 |
The St Thomas total condominium market declined by seven million dollars between 2017 and 2018. On St Croix there was no change in total condo market for this period.
Condominium
|
% increase (decrease) |
St Croix |
% increase (decrease) |
St Thomas |
Number of Condos Sold |
|
|
$9.2 |
|
$11.6 |
Jan – Aug 2013 |
|
+38% |
$12.7 |
+33% |
$15.4 |
Jan – Aug 2014 |
|
+10% |
$14.0 |
(-3%) |
$15.0 |
Jan – Aug 2015 |
|
(-4%) |
$13.4 |
+67% |
$25.0 |
Jan – Aug 2016 |
|
+9% |
$14.6 |
No change |
$24.9 |
Jan – Aug 2017 |
|
No change |
$14.6 |
(-38%) |
$17.9 |
Jan – Aug 2018 |
The St Thomas 2017 total land market was skewed by one large sale. For the first 8 months of 2018, the St Croix total land market exceeded that of St Thomas by $1 Million.
Vacant Land
|
% increase (decrease) |
St Croix |
% increase (decrease) |
St Thomas |
Number of Lots Sold |
|
|
$1.8 |
|
$2.3 |
Jan – Aug 2013 |
|
+33% |
$2.4 |
+65% |
$3.8 |
Jan – Aug 2014 |
|
+54% |
$3.7 |
(-8%) |
$3.5 |
Jan – Aug 2015 |
|
+11% |
$4.1 |
+40% |
$4.9 |
Jan – Aug 2016 |
|
+24% |
$5.1 |
+102% |
$9.9 |
Jan – Aug 2017 |
|
(-18%) |
$4.2 |
(-70%) |
$3.0 |
Jan – Aug 2018 |
Information is from MLS and deemed to be reliable, but is not guaranteed.
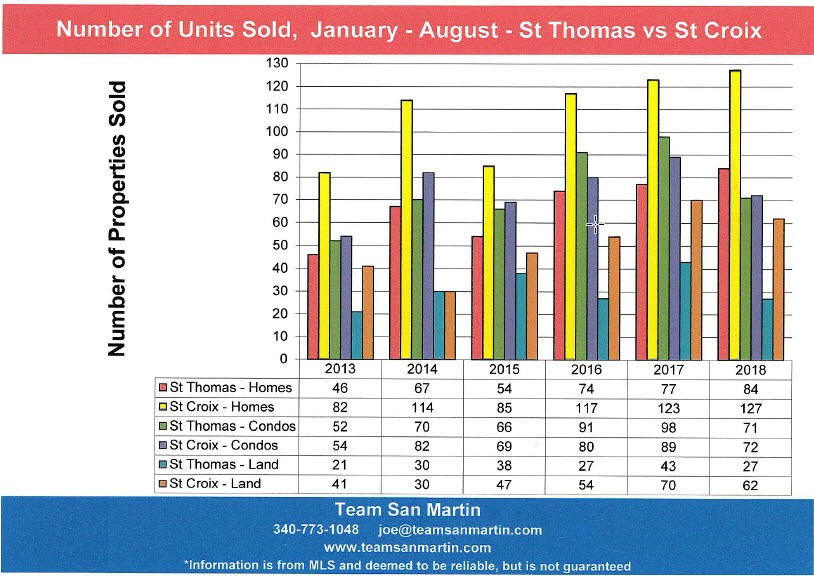
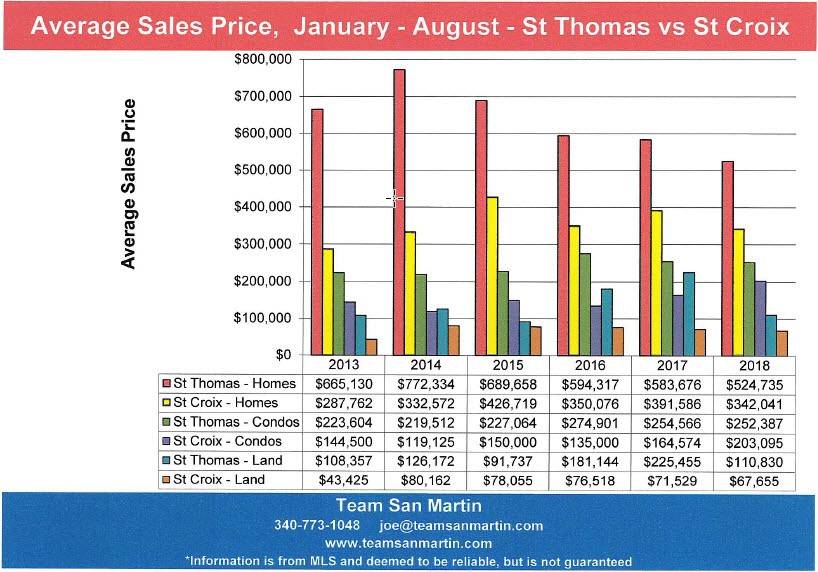
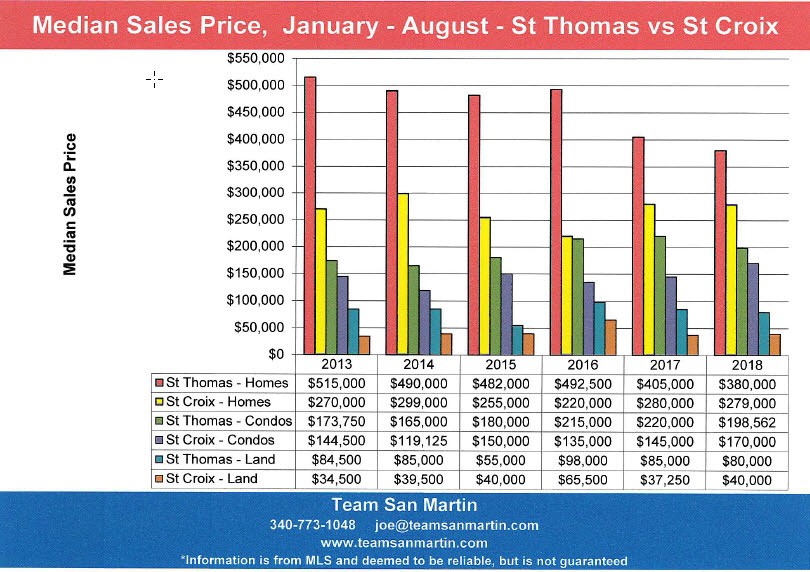
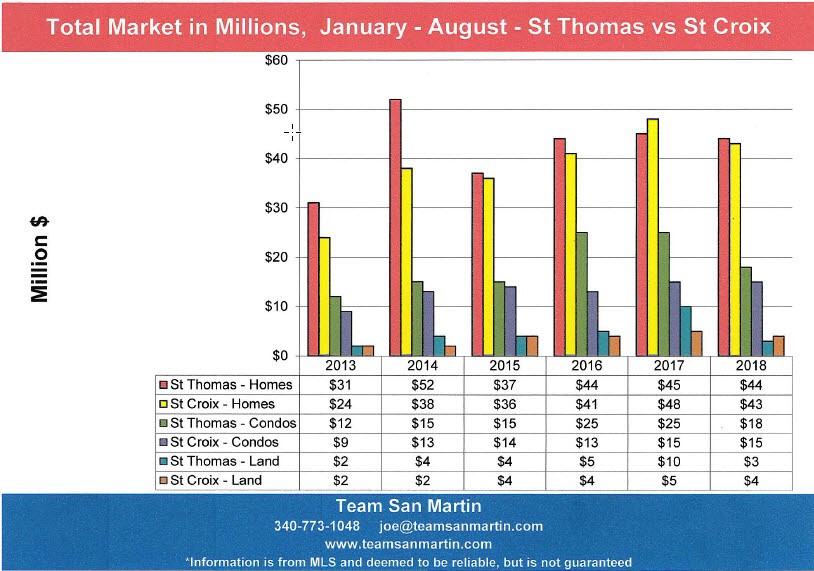
Prepared by:
Julie San Martin
Team Manager
August 2018
Sales Price and Marketing Time on St Croix
“Annual Supply” represents the number of years it will take at the current annual rate of sales to sell all the properties for sale
in a specific area.
East End B
Far East End
Inventory
Six years ago (July 2012), there was a 4.7 year supply of homes and a 4.3 year supply of condominiums on the market.
Inventory has decreased for both homes and condominiums,
There is now a 19 month supply of homes and an 11 month supply of condominiums in this quarter.
Average Sales Price
Compared to six years ago, both homes and condominiums have experienced a decrease in average sales price.
The average sales price of a home in this quarter ($560,938) is $15,000 less than it was six year ago ($575,667).
Condominiums experienced a larger decrease in average sales price ($152,000), from $383,500 for the 12 months ending July 2012 to $230,538 for the 12 months ending July 2018.
East End A
Christiansted east to Coakley Bay
Inventory
Six years ago (July 2012), there was a 4.2 year supply of homes and a 4.8 year supply of condominiums on the market.
Inventory has decreased for both homes and condominiums.
There is now an 18 month supply of homes and a 10 month supply of condominiums in this quarter.
Average Sales Price
Average residential sale price ($458,335) decreased about $22,000, compared to six years ago.
Condominium average sale price ($245,190) increased by about $40,000, when compared to six years ago ($204,667).
Company
Christiansted west to east side of Judiths Fancy
Inventory
Six years ago (July 2012), there was a 3.7 year supply of homes and a 5.9 year supply of condominiums on the market.
Residential inventory decreased by more than 2 years, to a 17 month supply of homes.
Condominium inventory sell off was dramatic, from a 5.9 year supply of units six years ago to a current 1 year supply of condominiums for sale.
Average Sales Price
Homes and condominiums both experienced average sales price increases, compared to six years ago.
Average home sale price increased the most ($72,000), from $191,269 in 2012 to $264,498 for the 12 months ending July 2018.
Average condo sale price increased $37,000, from $$101,250 six years ago to $143,896 for the 12 months ending July 2018.
Queen
Constitution Hill west to La Reine, includes southwest Judiths Fancy
Inventory
Six years ago (July 2012), there was a 3.1 year supply of homes and an 8.3 year supply of condominiums on the market.
Home inventory has decreased by 16 months, to 1.8 years, over the six year period.
Condominium inventory decreased by more than 7 years over this period, to an 8 month supply for the 12 months ending July 2018.
Average Sales Price
Decrease in inventory levels also resulted in an increase of average sale price over the six year period, for both homes and condos.
Average residential sale price increased by $37,000 over the six year period, from $291, 29 in 2012 to $328,725 from the 12 months ending July 2018.
Average condo sale price increased by $44,000 over the six year period, from
$75,125 in 2012 to $119,408 from the 12 months ending July 2018.
Northside A & B
North shore from north Judiths Fancy west to Hamms Bluff
Inventory
Six years ago (July 2012), there was a 4.6 year supply of homes and a 6.5 year supply of condominiums on the market.
Residential inventory decreased by 3 years, to a 1.5 year supply of homes.
The condominium supply decreased by nearly 4 years, to a 2.7 year supply of condominiums in this quarter.
Average Sales Price
Average home sale price ($549,333) increased by $90,000, compared to six years ago ($459,110). Current average sale price is, however, $210, 00 lower than the highest average sale price during the six year period, which was $753,188 for the 12 months ending July 2016.
Average condominium sale price decreased by about $30,000 over the six year period, from $345,000 for the 12 months ending July 2012 to $316,500 for the 12 months ending July 2018.
King
South shore from La Reine west to UVI
Located near the closed refinery, this is the worst performing segment of our market.
Inventory
Six years ago (July 2012), there was a 3.8 year supply of homes;
there are no condominiums in King Quarter.
Residential inventory increased slightly, to a 4 year supply of homes, compared to six years ago. For the 12 months ending July 2013, only one home sold in King Quarter.
Average Sales Price
Average home sale price decreased $81,000 over the six year period, from $207,400 for the 12 months ending July 2012 to $126,450 for the 12 months ending July 2018.
Prince
South shore from UVI west to Williams Delight
Inventory
Six years ago (July 2012), there was a 5.8 year supply of homes and an 11.0 year supply of condominiums on the market.
Residential inventory decreased by 2 years, to a 3.7 year supply of homes.
Condominium inventory decreased by nearly 11 years, to a 1.3 year supply of condominiums.
Average Sales Price
Homes saw a sale price increase of nearly $70,000 when compared the six years ago, from $208,430 for the 12 months ending July 2012 to $275,750 for the 12 months ending July 2018.
Condominiums experienced a $214,000 decrease in average sale price over the six year period, from $415,000 for the 12 months ending July 2012 to $200,625 for the 12 months ending July 2018.
West End
South from Mahogany Road, East to Williams Delight
Inventory
Six years ago (July 2012), there was a 4.6 year supply of homes and a 7.0 year supply of condominiums on the market.
Over the six year period, residential inventory decreased by 3.4 years, to a 1.2 year supply of homes for the 12 months ending July 2018.
Condominium inventory decreased by 5 years, to a 2 year supply of condominiums.
Average Sales Price
Average home sale price increased $74,000 over the six year period, from $164,300 for the 12 months ending July 2012 to $238,158 for the 12 months ending July 2018.
Average condominium sale price increased $45,000 over the six year period, from $62,500 for the 12 months ending July 2012 to $107,067 for the 12 months ending July 2018.
Conclusion
Over the seven year period, average home sale prices were highest, usually more than double those of other quarters, in these quarters:
· Northside A & B
· East End B
· East End A
Over the seven year period, the average condominium sale price decreased by about $35,000. These quarters experienced an increase in average sale condo sale price:
· East End A
· Company
· Queen
· West End
Residential and condominium inventories decreased island wide over the past seven years, with the exception of King Quarter, where residential inventory increased about 2 months.
Information is from MLS and deemed to be reliable, but is not guaranteed.
Prepared by:
Julie San Martin
Team Manager
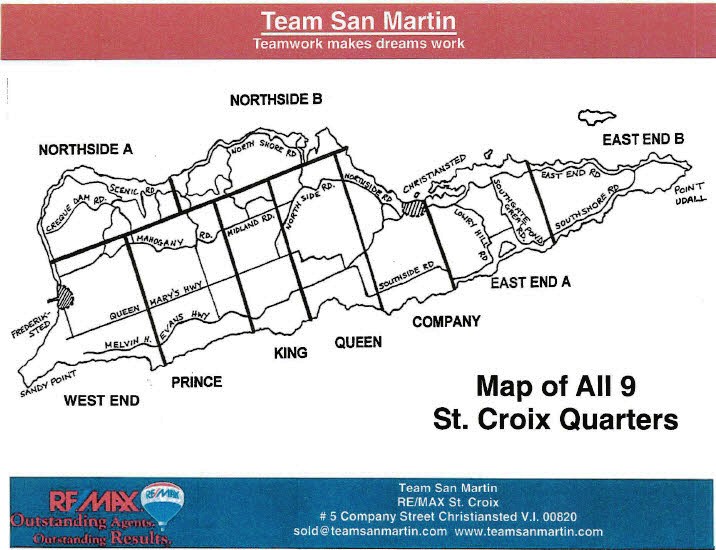
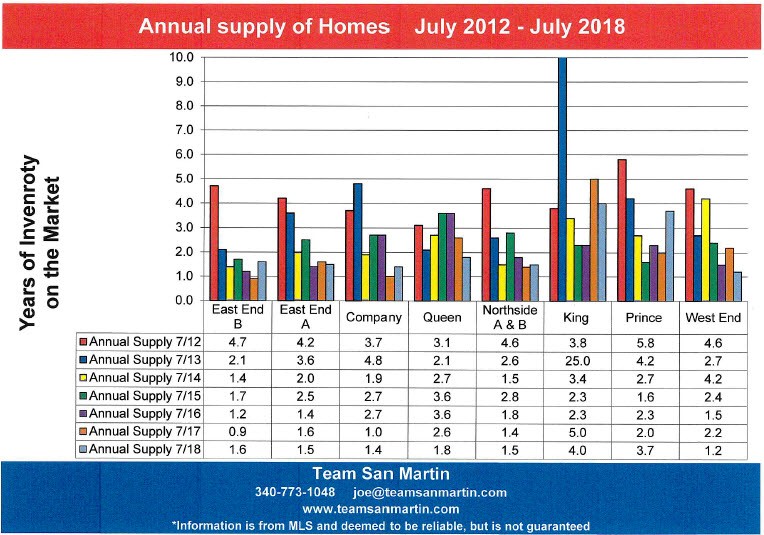
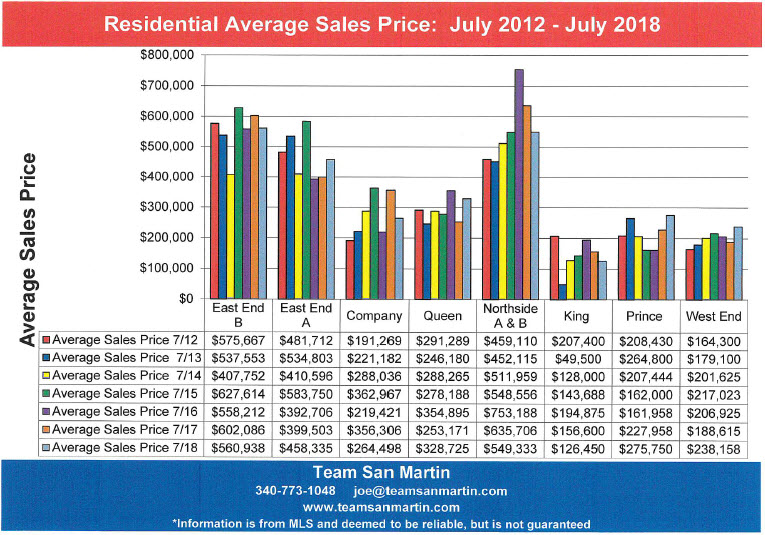
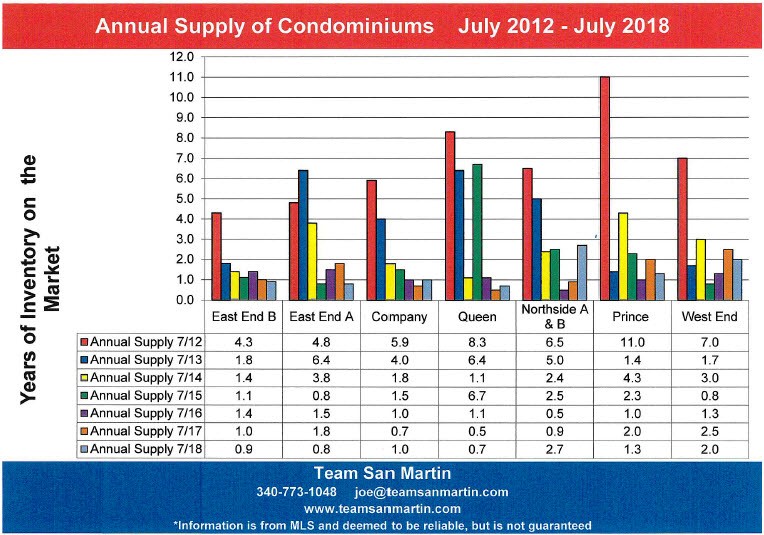
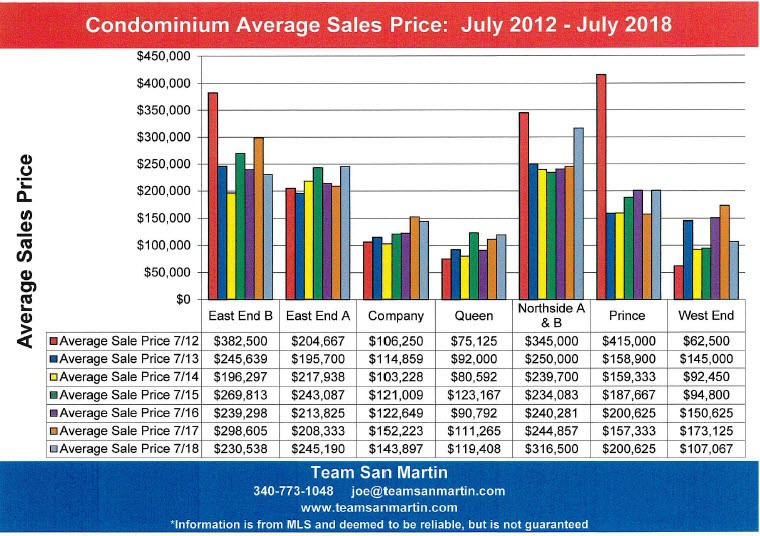
July 2018
13 year look at the St Croix Real Estate Market for the 12 month period ending 30 June
The last real estate boom on St Croix was 13 years ago –
The 2005 / 2006 period
Total number of properties sold
· Residential – Fewer homes sold in the past 12 months than were sold during the past 4 annual cycles. But there was that weather event - Irma / Maria, the likes of which we have not seen for 100 years!
· Condominiums – 40% fewer (84) condominiums sold than were sold during the previous 12 month period (142).
· Land – Land sales performed the best. During the current period, 80 lots sold compared to 89 for the previous 12 month period
Average sales price
· Residential – The one bright spot! The “average” sales price of a home on St Croix ($382,435) increased by $12,000 over the previous 12 month period ($370,340).
· Condominiums – Average condominium sales price for this 12 month period ($173,977) was about $15,000 less than the previous period ($189,240).
· Land – Average lot sales price ($63,069) also decreased, by about $11,000, for this 12 month period, when compared to the previous period ($75,822).
Total Market
Number of properties sold x Average sales price
· Residential – The total residential market ($54.7 million) was $10 million less than the previous 12 month period (($64.8 million).
· Condominiums – This 12 month period ($14.6 million) was $12 million less than the previous 12 months ($26.9). Many fewer condominiums sold, at a lower average sale price.
· Land – This total market experienced the smallest decrease ($1.7 million). The total market for July 2017 through June 2018 was $5 million. For the previous 12 month period, the total land market was $6.7 million.
Conclusion
Compared to 13 years ago, total St Croix real estate sales have decreased by $105 Million Dollars (59%)
Compared to the previous 12 month period, total
St Croix real estate sales have decreased by $24 million (24%) for the period of July 2017 through June 2018
Information is from MLS and deemed to be reliable, but is not guaranteed.
Prepared by:
Julie San Martin
Team Manager
June 2018
Changes in the St Croix Real Estate Market
Inventory levels by price range reflect the seller’s expectations.
The attached graphs compare changes in asking prices over the past nine years, using 15 May inventory levels.
Residential
· The lowest price range (under $200,000) has accounted for about one third of the St Croix residential inventory for the past 5 years. In 2010, this price range was only 14% of the inventory, increasing to about 25% for the next three years.
· The second tier ($200,000 to $400,000) has consistently comprised nearly one third of all homes for sale on St Croix over the 9 year period. Nearly two thirds of all homes for sale on St Croix are currently listed for $400,000 or less.
· Over the 9 year period, homes listed for more than $400,000 have decreased by 18%, from 56% of the inventory in 2010 to 38% of all homes for sale on St. Croix in May 2018.
Condominium
· The lowest price range (under $100,000) is now 12% and approaching the 2010 level of 9% of inventory, after more than tripling in 2014, when this price range represented 30% of condominium inventory.
· The second tier ($100,000 to $200,000) has consistently included between one-third and one-half the inventory over the 9 year period.
· Condominiums listed for more than $200,000 have consistently comprised about one third of the inventory over the 9 year period.
Land
· The lowest price range (under $50,000) has more than doubled over the 9 year period, from 20% of total inventory in 2010 to 42% of all lots for sale in 2018.
· The second tier ($50,000 to $100,000) has decreased from one third of the inventory to one quarter of all lots for sale over the 9 year period.
· Lots listed for more than $100,000 have decreased from approximately 45% of total inventory to about one third of all lots for sale over the 9 year period.
Information is from MLS and deemed to be reliable, but is not guaranteed.
Prepared by:
Julie San Martin
Team Manager
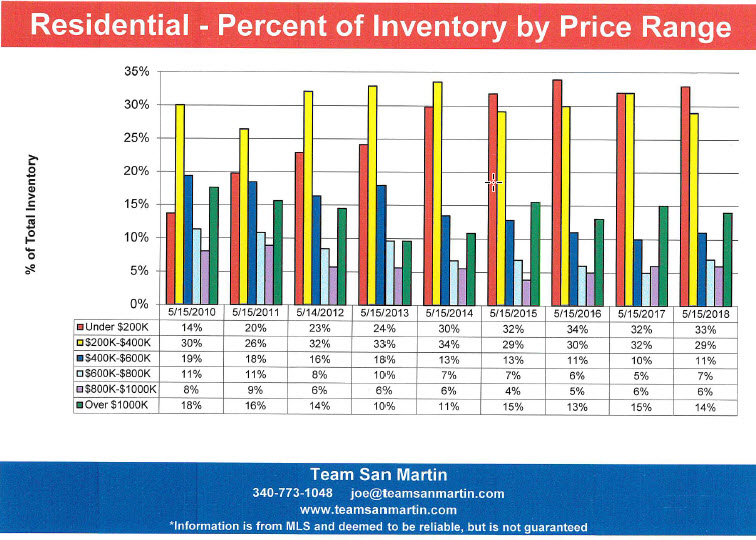
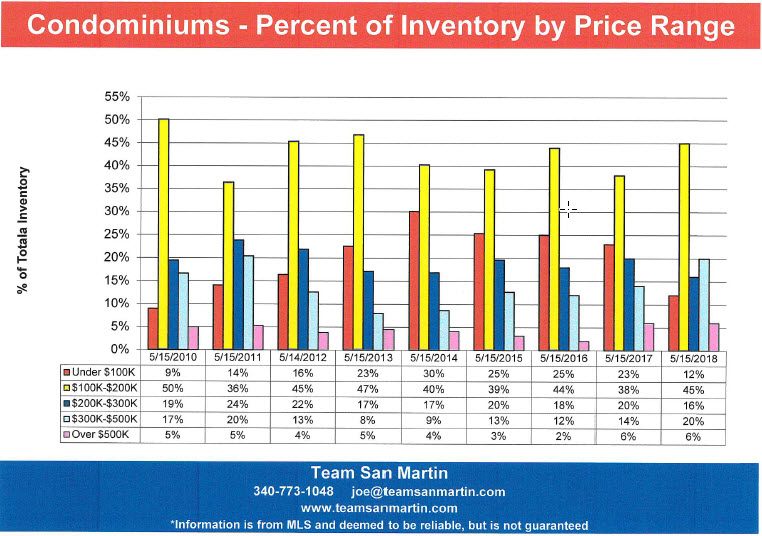
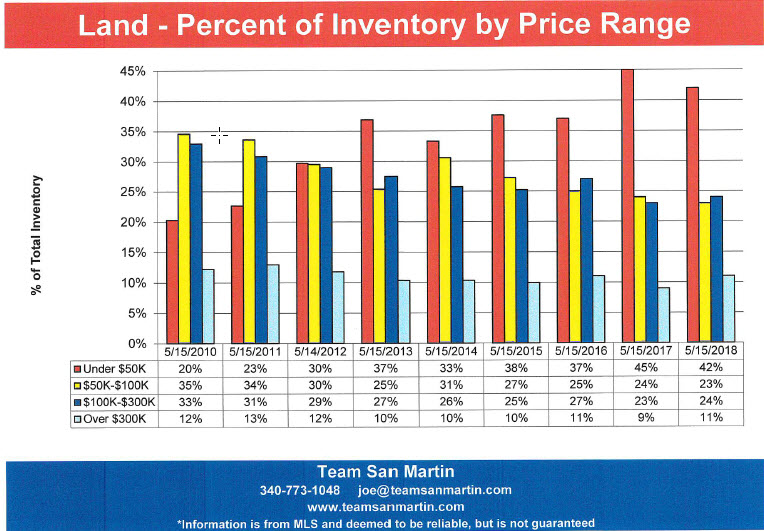
May 2018
Inventory Levels and Sales Projections
May Inventory Levels
8 Year Review
Residential
Residential inventory peaked in 2012 at 330 homes for sale and has steadily declined since then. Current inventory of 173 homes for sale is 37% lower (100 homes) than May 2012 residential inventory.
Condominium
Condominium inventory also peaked in 2012, at 230 condominiums for sale, and has steadily declined since then. Current inventory of 72 condos is less than one third of the May 2012 condominium inventory.
Land
Land inventory peaked in 2011, steadily declining until 2014 and is now at its lowest level of the 8 year period with 411 lots for sale, nearly 30% lower than 8 years ago.
May Pending Sale Levels
8 Year Review
Residential
Residential pending sales peaked in May 2016, at 85 pending residential sales, and have been robust since, at nearly twice the level of earlier in the decade.
Condominium
The
condominium inventory has continuously declined since May 2012. Meanwhile the
number of pending condo sales has steadily increased and is currently at 50% of
the inventory!
Land
Pending land sales have remained relatively constant over the 8 year period, but now represent a higher portion of the inventory, which has significantly declined.
2018 Sales Predictions
Using the assumption that the first 4 months of 2018 is a valid predictor for the entire year.
Residential
The first four months predict there will be approximately the same number of homes sold in 2018 as were sold during the previous 4 years. The average number of homes sold for years 2014 through 2017 was 154 homes annually; looks like a trend!
Condominium
The first four months predict there will be about half as many condominiums sold as were sold during the 2014 through 2017 period, which averaged 115 condos a year. This prediction might be accurate, due to the low condominium inventory?
Land
Land sales have nearly returned to 2011 levels! This is the segment of the St Croix real estate market showing the most improvement, but there is a lot of inventory to sell; the current rate of sales predicts about 20% of the inventory should sell during 2018.
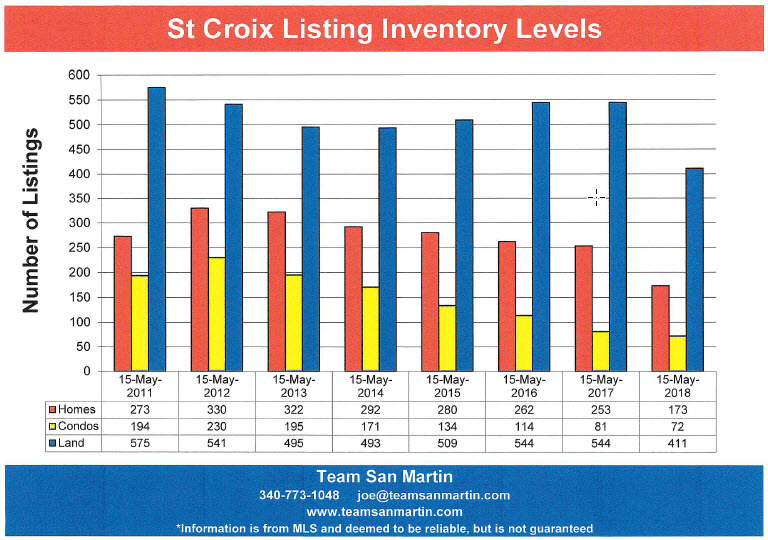
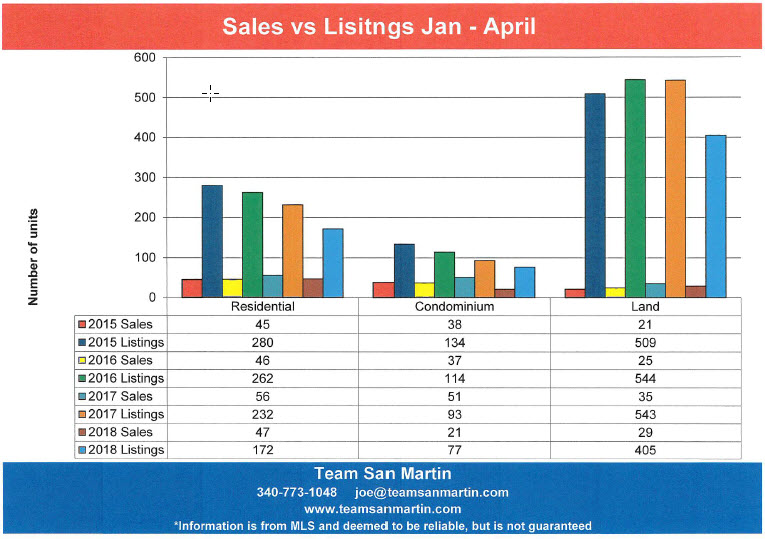
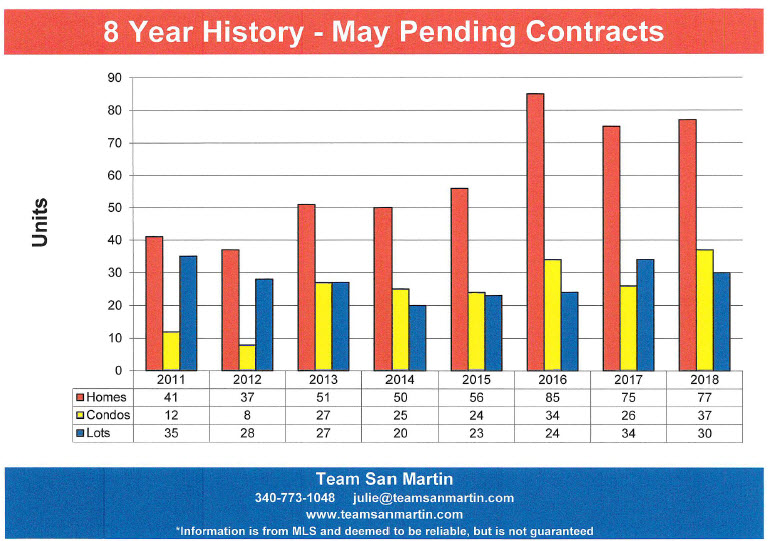
Information is from MLS and deemed to be reliable, but is not guaranteed.
Prepared by:
Julie San Martin
Team Manager
April 2018
1st Quarter Sales as Predictor for the full year
2018 is the 10th year of the St Croix real estate market “recovery” from the real estate boom years of 2006 through 2008. The two Category 5 hurricanes in September 2017 were not helpful.
The question is – what do the 1st quarter statistics predict about market prospects for the rest of the year?
First, a look at inventory trends over the
10 year period:
· Residential inventory peaked in 2012, at 340 homes for sale, and has continually declined each year since. Current residential inventory levels are at only 52% (176 homes) of the 2012 level, a significant decline.
· Condominium inventory peaked in 2010, with 265 condominiums on the market. The current level of 85 condominiums for sale is only 32% of the inventory 2010.
· Land inventory also peaked in 2010, at 610 lots for sale. First quarter 2018 inventory is again the lowest level of the 10 year period at 74% (454 lots) of the 2010 inventory levels.
Residential Sales & 2018 Predictions
From 2009 to 2016, the number of homes sold during the first quarter consistently under predicted the total number of sales for the year. The average of the under prediction over the 8 year period was 20%. 2017 was a trend reverser; sales predictions based on the number of 1st quarter homes sold was 5% higher than the actual number of home sold.
For the period 2012 through 2016, the average 1st quarter sales price was within 12% of the actual annual average sales price. The 2017 prediction, based on 1st quarter average home sales price, was 28% below the actual average 2017 home sales price of $402,507.
Here is the prediction for 2018 overall:
· Total number of homes sold will be as predicted, around 120, representing about a 20% decreased from total number of homes sold during 2017.
· Average sales price will most likely be in the $350,000 range, about the same as 2016.
Condominium Sales & 2018 Predictions
This is a much smaller market, with just a few units built since the 1980s. It is more difficult to identify trends, because the sample is significantly smaller.
For the period of 2012 through 2016, the 1st quarter condo sales have underestimated the annual total number of condos sold by about 13%. 2017 was a game changer; the predicted number of condos sold (144) was 26% higher than the actual number of condos sold (107).
1st quarter average sale price has, in most cases, overestimated the average annual condominium sales price.
Here is the prediction for 2018 overall:
· Total number of condominiums sold will be in the 80 condo range, even though only 10 condominiums sold during the 1st quarter. Put another way, all of the 85 condominiums currently listed for sale should sell.
· Average sales price will most likely be in the $180,000 range, about 85% of the 1st quarter average 2018 condominium sales price.
Land Sales & 2018 Predictions
Both predicted and actual number of lots sold are trending in the right direction, at last! A sign of market recovery!
For the past 4 years, 2014 through 2017, the average lot sales price has consistently been in the $70,000 range. Predications based on 1st quarter land sales prices for this period varied as much as $30,000 off the actual annual lot sales price; this statistic does not appear to be a good predictor for the rest of the year.
Here is the prediction for 2017 overall:
· Total number of lots sold will be about 100, similar to 2017 and the highest number of lots sold since 2009.
· The 2018 average lot sales price will be in the $70,000 range, similar to the previous 5 years. Land asking prices have adjusted downward.
Information is from MLS and deemed to be reliable, but is not guaranteed.
Prepared by:
Julie San Martin
Team Manager
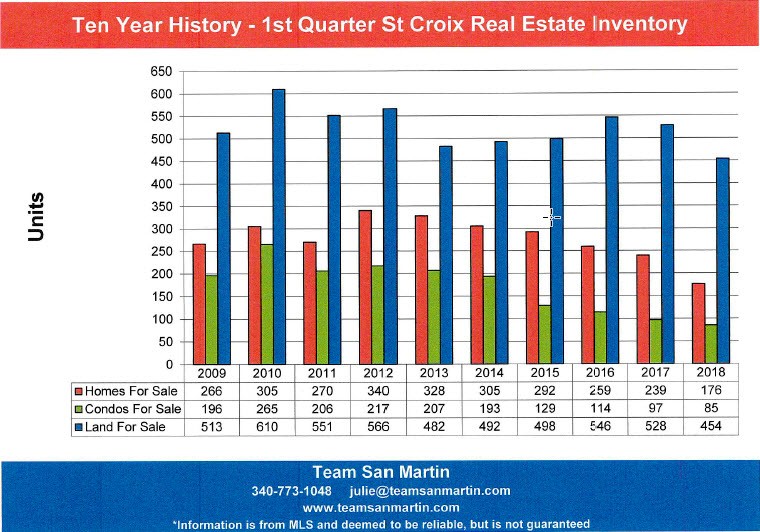
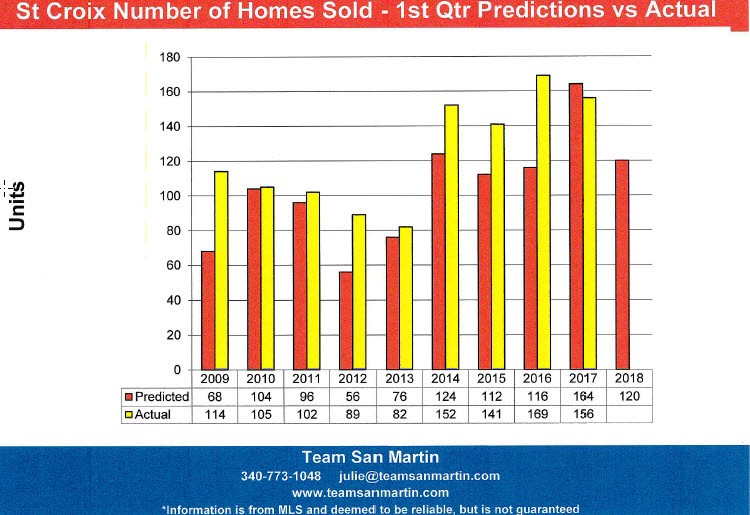
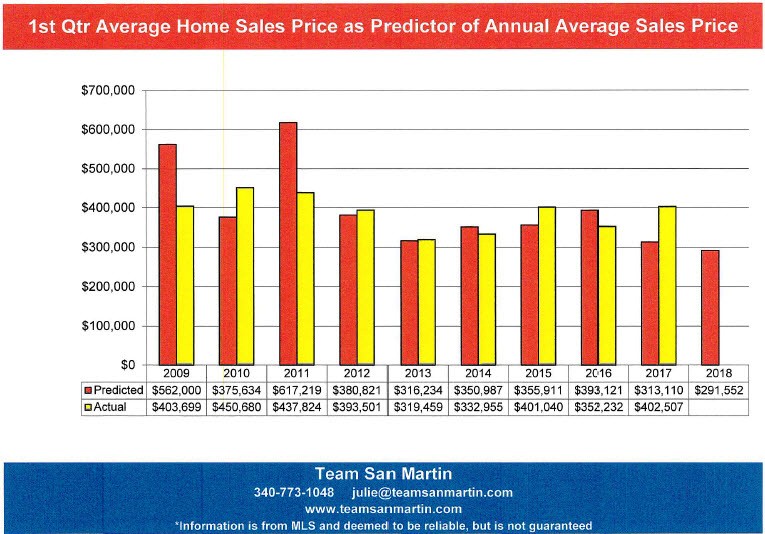
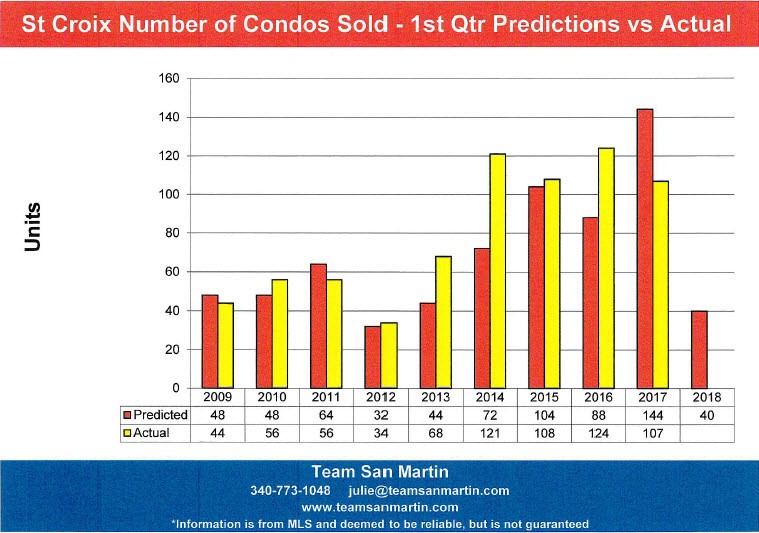
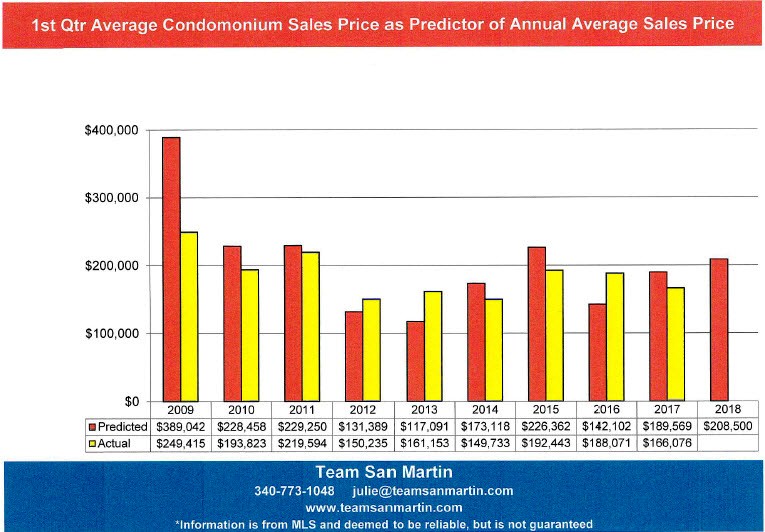
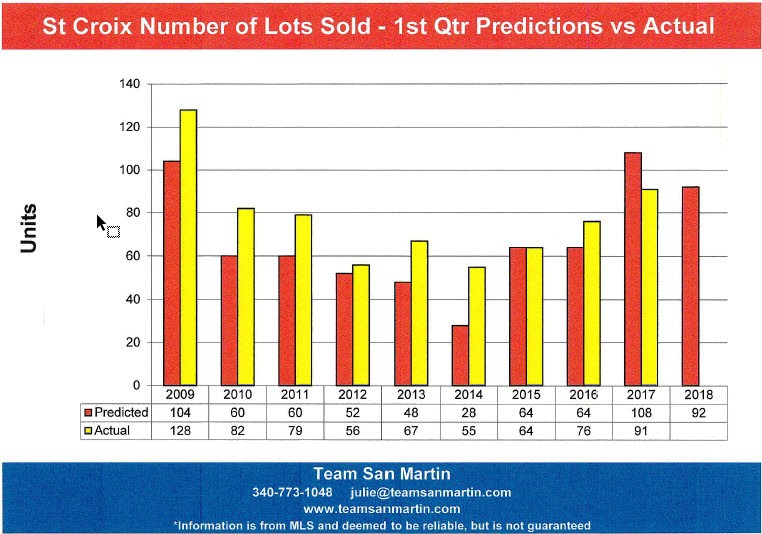
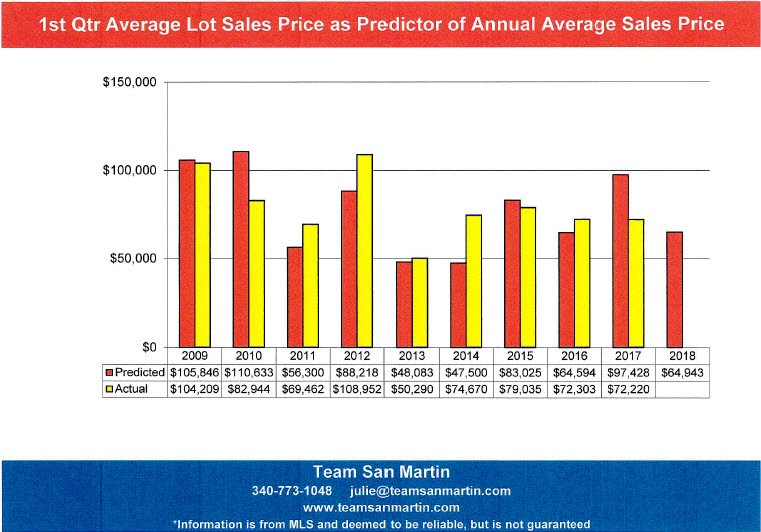
March 2018
Home Sales
St Thomas vs St Croix
A 15 Year Look
Total Number of Properties Sold
· Over the 15 year period, more homes sold every year on St Croix than on St Thomas.
· The number of homes sold on both St Thomas and St Croix declined slightly in 2017, when compared to 2016; not surprising.
· Over the 15 year period, St Croix has seen a high of 188 homes sold (2006) and a low of 88 homes sold (2012). During this same period, St Thomas saw a high of 118 homes sold (2004) and a low of only 46 homes sold (2009).
· Nearly twice as many homes were sold on St Croix during 2017 (156) as were sold on St Thomas (88).
· Compared to 2016, 7 fewer homes were sold on St Thomas and 13 fewer homes were sold on St Croix during 2017.
Average Sales Price
· At the beginning of this 15 year period (2003), average sales prices for St Thomas and St Croix were nearly identical, at an average of $415,823.
· From 2004 until the present (14 years) the annual average home sales price on St Thomas has exceeded that of St Croix.
· For 2017, the average St Thomas homes price was 51% higher, at $627,079, than the 2003 average sales price. The average annual home sales price on St Croix for 2017 was 3% lower, at $402,507, than the 2003 average sales price.
· The average sale price of a home on St Croix for 2017 ($402,507) was 64% of the averages sales price of a home on St Thomas ($627,079).
Total Market in Millions of Dollars
· This measurement is a combination of total homes sold multiplied by average sales price; it gives the best overview of annual market performance.
· During this 15 year period, the total St Thomas residential market exceeded the total St Croix market during four years: 2008, 2012, 2013, 2014, and 2015. For the past two years, 2016 and 2017, total St Croix residential market has exceeded the total St Thomas residential market by about $6 Million.
Information is from MLS and deemed to be reliable, but is not guaranteed.
Prepared by:
Julie San Martin
Team Manager
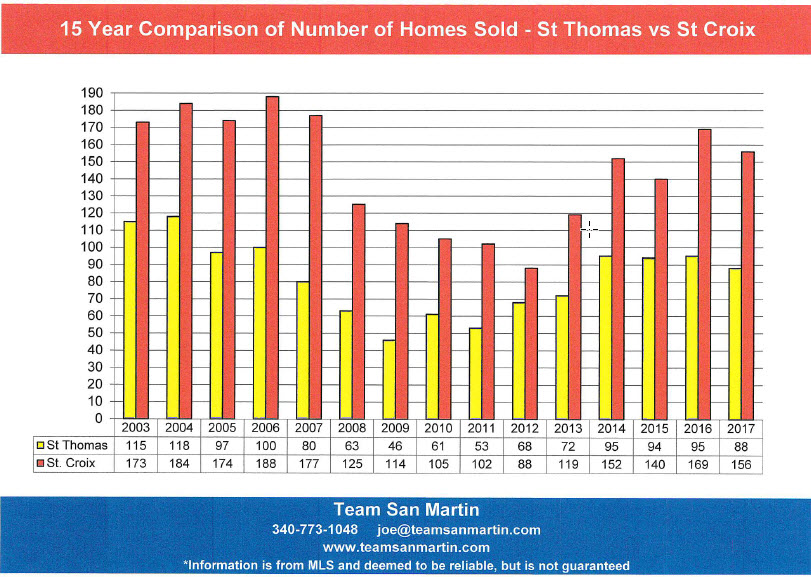
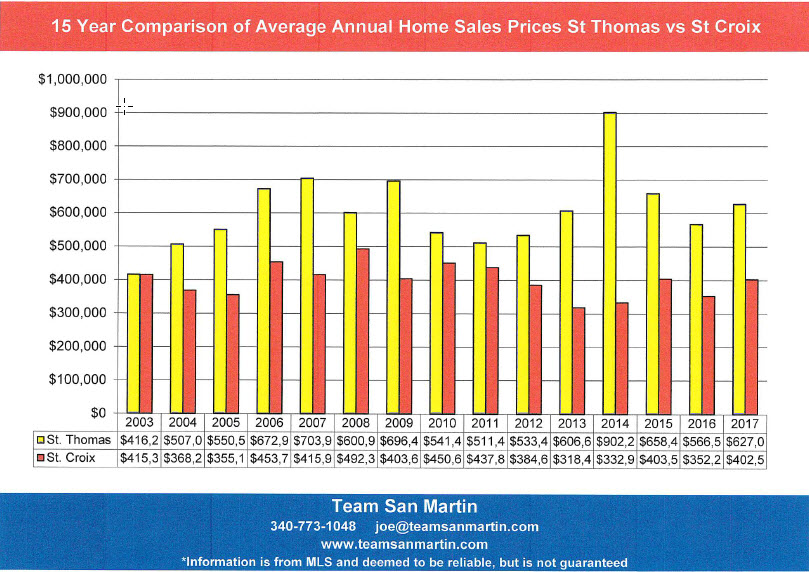
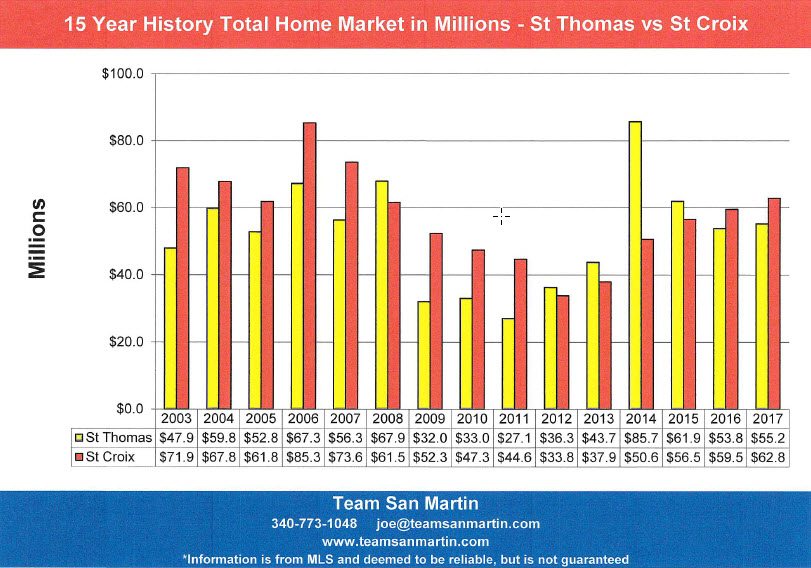
February 2018
The St Croix Real Estate Cycle
A 15 Year Look
Total Number of Properties Sold
· Fewer homes and condominiums sold in 2017 than were sold in 2016; not a big surprise, given the two major 2017 hurricanes. There was, however, a slight uptick in number of lot sales – 12 more lots were sold in 2017 than in 2016.
· The number of homes sold during 2017 (156) exceeds all years since 2008 (125 home sales) except 2016, when 169 homes sold.
· The number of condominiums sold during 2017 (106) exceeds the number of sales for the seven year period of 2007 through 2013, but falls short of the previous three years sales numbers (2014 – 2016).
· The number of lots sold during 2017 (88) exceeds all years since 2009, when 128 lots sold.
Average Sales Price
· The 2017 average home sales price ($402,507) exceeded the average 2016 average homes sale price by $50,000! However, the 2017 average home sales price is $10,000 lower than the average home sale price of 15 years ago ($413,439).
· The 2017 average condominium sales price ($182,412) is about $6,000 lower than the 2016 average condominium sales price. It is, however, nearly $40,000 higher than the average condominium sales price 15 years ago ($144,823).
· The average 2017 lot sales price ($89,914) is the highest average lot sales price since 2012 ($108,952).The 2017 average lot sale price is nearly identical to the 2013 average lot sales price of $91,315.
Total Market in Millions of Dollars
· The 2017 total residential market ($62.8 million) was about $3 million higher than the 2016 total residential market of $59.5 million. But the total residential market is still $9 million less than the total residential market of 15 years ago ($71.9 million).
· The 2017 total condominium market ($17.7 million) was $5.6 Million lower than the total 2016 condominium market ($23.3 million). The 2017 total condominium market was also $2.6 million below the total condominium market in 2003 ($20.3 million).
· The 2017 total land market ($6.5 million) exceed the previous year by $1 million. But the total land market is still more than $10 million below our total land market of 15 years ago ($17.1 million).
Information is from MLS and deemed to be reliable, but is not guaranteed.
Prepared by:
Julie San Martin
Team Manager
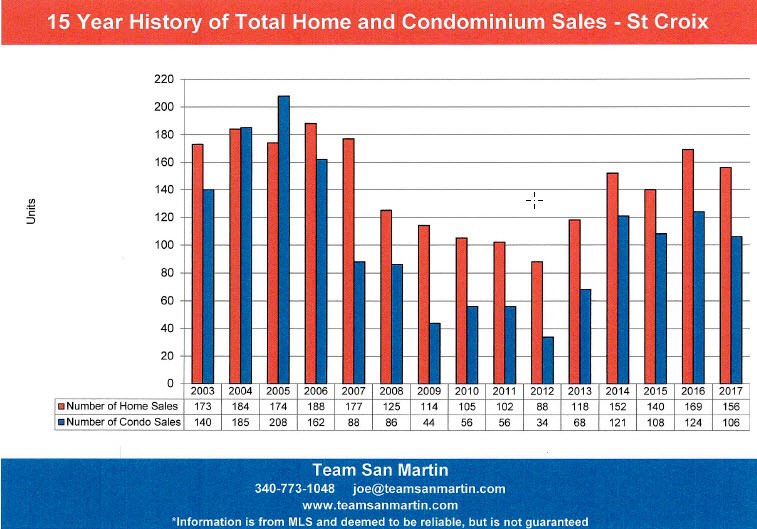
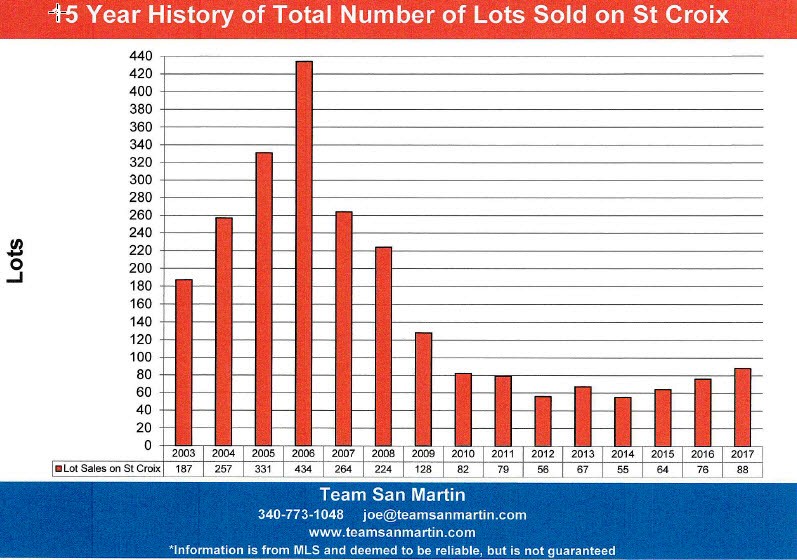
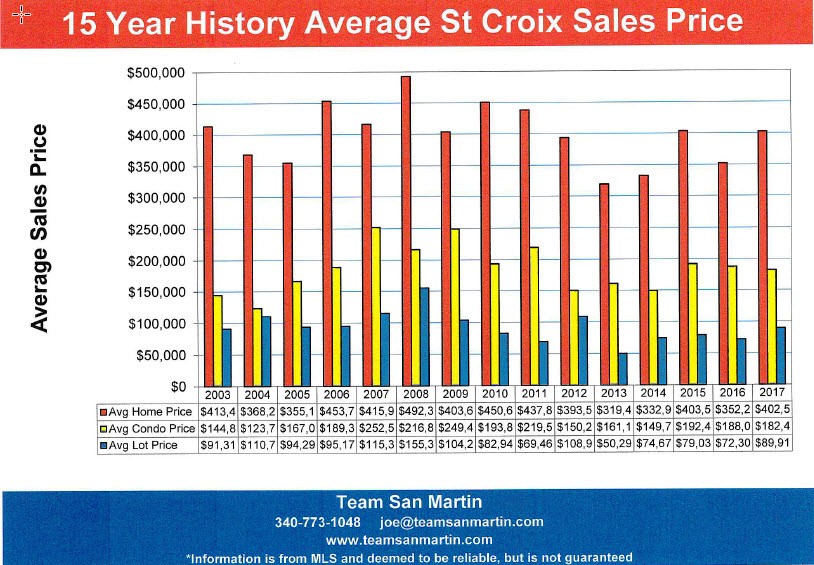
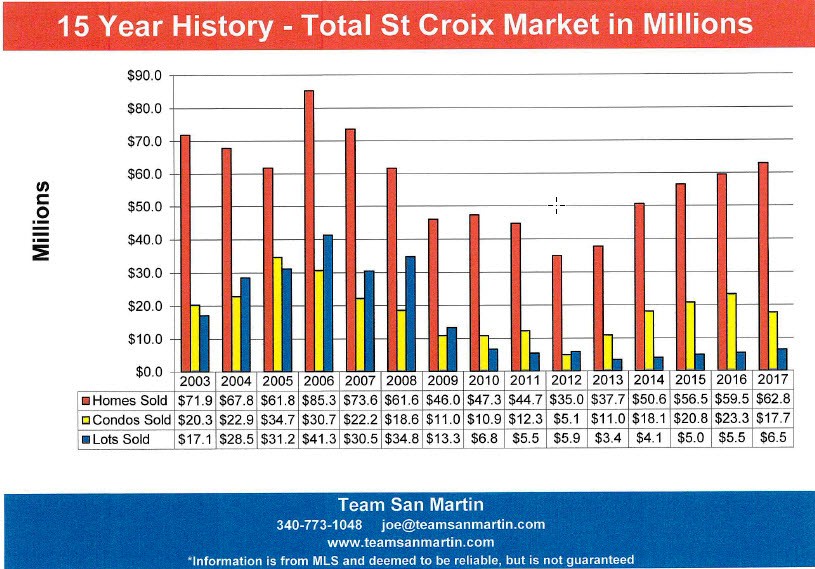
January 2018
Year Home Sales Price Trends
The average sales price of a home on St Croix increased by $12,239 over the 5 year period; this is a 3% increase
Total number of homes sold increased 73% (65 homes) since 2012.
All areas of the island did not perform the same.
East End B
Far East End
Compared to 6 years ago, the average sales price of a home increased 1% ($4,208).
The number of homes sold in a year has more than doubled;
12 homes sold in 2012 compared to 28 in 2017.
East End A
Christiansted East to Coakley Bay
Compared to 6 years ago, the average sales price of a home decreased 59% ($505,672) from $859,500 for 2012 to $353,828 for 2017.
The number of homes sold in a year more than doubled since 2012;
10 homes sold in 2012 compared to 25 in 2017.
Company
Christiansted West to the East Side of Judiths Fancy
Compared to 6 years ago, the average sales price of a home increased 46% ($92,392), from $202,367 for 2012 to $294,759 for 2017.
The number of homes sold in a year has almost doubled since 2012,
from 15 home sales in 2012 to 27 homes sales in 2017.
Queen
Constitution Hill West to La Reine, includes southwest
Judiths Fancy
Compared to 6 years ago, the average sales price of a home increased 58% ($141,683) from $242,003 for 2012 to $383,686 for 2017.
The number of homes sold in a year increased by 3 homes since 2012, from 22 homes sold in 2012 to 25 home sales in 2017.
Northside A & B
North Shore from North Judiths Fancy to Hamms Bluff
Compared to 6 years ago, the average sales price of a home increased 44% ($201,986), from $458,576 for 2012 to $660,562 for 2017.
The number of homes sold in a year increased by 3 homes since 2012, from 13 homes sales in 2012 to 16 sold during 2017.
King
South Shore from La Reine West to UVI
Compared to 6 years ago, the average sales price of a home increased 69% ($65,250), from $94,750 for 2012 to $160,000 for 2017.
Twice as many homes sold when compared to 6 years ago,
from 2 homes in 2012 to 4 homes in 2017.
Prince
South Shore from UVI West to Williams Delight
Compared to 6 years ago, the average sales price of a home decreased 15% ($37,392), from $256,000 for 2012 to $219,208 for 2017.
More than twice as many homes sold during 2017 (12 homes) as compared to
2012 (5 homes).
West End
South Shore, South from Mahogany Road,
East to Williams Delight
Compared to 6 years ago, the average sales price of a home decreased 13% ($25,853), from $203,500 for 2012 to $177,647 for 2017.
Five more homes sold during 2017 (15 homes) than during 2012 (10 homes).
Observations
Average home sales prices in these two quarters of the island consistently exceed the
island wide “average” home sales price:
· East End B
· Northside A & B
Average home sales prices in these three quarters of the island are consistently much lower than the island wide “average” home sales price:
· King
· Prince
· West End
Center island average home sales prices in these areas are about “average”:
· East End A
· Company
· Queen
More homes sold in all quarters during 2017, when compared to 2012.
Compared to 2016, the island wide average home sale price increased 15%.
All quarters saw increased average home sales prices with the exception of:
· Company
· West End
Compared to 2012, these quarters had higher average home sales prices:
· East End B
· Company
· Queen
· Northside A & B
· King
Compared to 2012, these quarters had lower average home sales prices:
· East End A
· Prince
· West End
Information is from MLS and deemed to be reliable, but is not guaranteed.
Prepared by:
Julie San Martin
Team Manager
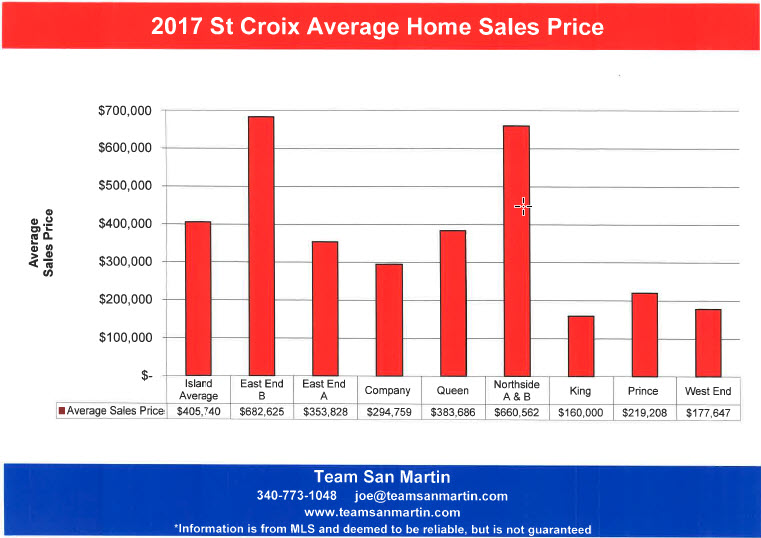
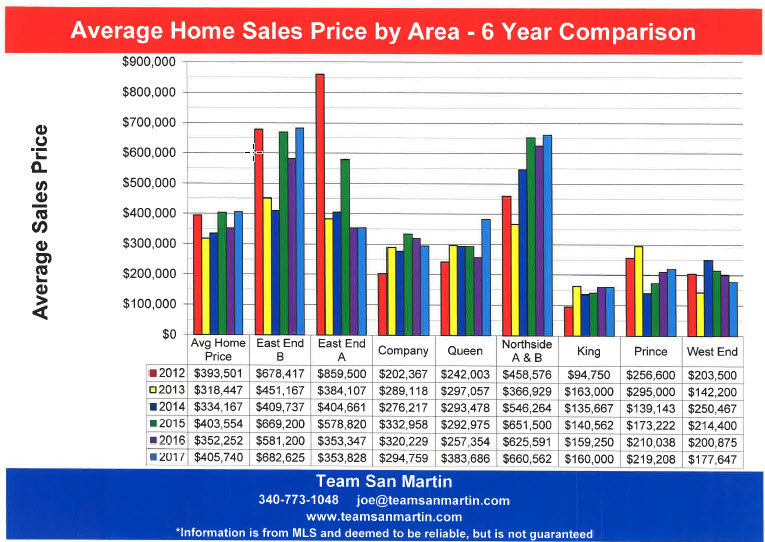
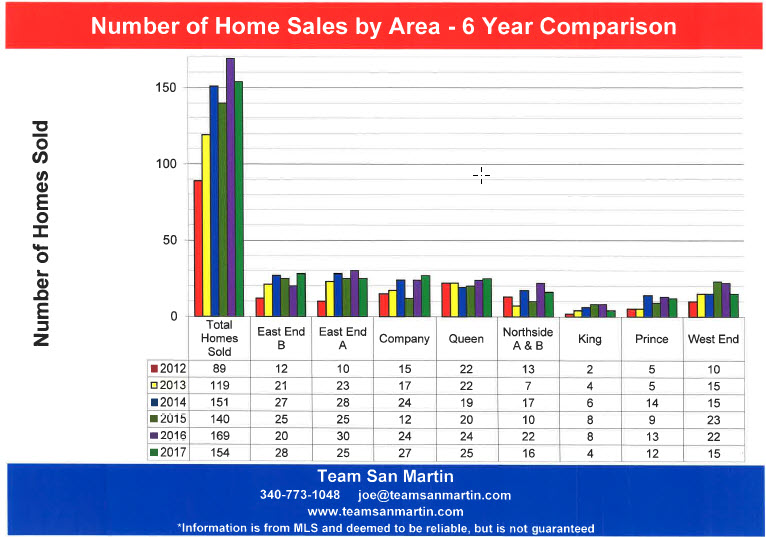
December 2017
Inventory Level Trends
Current Annual supply represents the number of years it will take at the current rate of sales to sell all the properties listed in a specific area (Quarter) of St Croix.
[Active Listings + Pending Listings] /
Number of Listings Sold During the Previous 12 Months
For example:
In November 2017, there were 20 active and 4 pending home sales in East End B, with 27 home sales in the previous 12 months, for a 0.9 year supply of homes for sale
[20 + 4] / 27 = 0.9 Years or 10.8 months
East End B
Far East End
Residential
Compared to 6 years ago, home inventory decreased by nearly 2 years and average sales price is about 25% ($220,149) lower
(from $888,908 to $668,759)
Compared to last year, average time on the market has decreased by 9.6 months; average sales price has increased by about 10% (from $609,950 to $668,759)
Condominium
Compared to 6 years ago, condominium inventory has decreased by 18 months (from 2.6 years to 1.1 years); average sales price decreased by 32%
(from $370,846 to $253,785)
Compared to last year, condominium inventory is unchanged at 1 year;
average sales price decreased by 9% (from $279,538 to $253,785)
Vacant Land
Compared to 6 years ago, land inventory decreased by 3.5 years
(from 8.2 years to 4.7 years); average sales price decreased by 4%
(from $79,929 to $77,138)
Compared to last year, land inventory decreased by 2 years;
average sales price decreased by 29% (from $108,800 to $77,138)
East End A
Christiansted East to Coakley Bay
Residential
Compared to 6 years ago, home inventory decreased by a year;
average home sale price increased by 16% (from $307,597 vs $357,604)
Compared to last year, residential inventory decreased by about 2 months;
average sales price decreased by 1% (from $361,979 to $357,604)
Condominium
Compared to 6 years ago, condominium inventory has decreased by 8 months (from 3 years to 2.3 years);
average condominium sales price decreased 37% (from $242,556 to $152,129)
Compared to last year, condominium inventory increased by a year
(from 1.4 years to 2.3 years); average sales price decreased by 32%
(from $222,786 to $152,129)
Vacant Land
Compared to 6 years ago, land inventory is about the same at 5.8 years;
average lot sales price increased by 86% (from $54,421 to $101,464)
Compared to last year, land inventory is unchanged;
average lot sales price increased by 49% (from $67,900 to $101,464)
Company
Christiansted West to the East Side of Judiths Fancy
Residential
Compared to 6 years ago, residential inventory decreased by more than 6 years (from 7 years to 0.8 years);
average home sales price is the same as 6 years ago ($275,274)
Compared to last year, residential inventory decreased by 1 year;
average home sales price decreased 17% (from $333,239 to $275,274)
Condominium
Compared to 6 years ago, condominium inventory decreased by 17 months (from 2.3 years to 0.9 years);
average sales price increased by 14% (from $124,992 to $142,067)
Compared to last year, condominium inventory is unchanged at about 10 months; average sales price has increased by 5% (from $135,559 to $142,067)
Vacant Land
Compared to 6 years ago, land inventory increased by 1 year
(from 3.8 years to 4.9 years);
average sales price increased by 55% (from $66,433 to $103,000)
Compared to last year, land inventory decreased by more than 4 years
(from 9.2 years to 4.9 years) while average sales price decreased 3%
(from $106,500 to $103,000)
Queen
Constitution Hill West to La Reine, includes southwest
Judiths Fancy
Residential
Compared to 6 years ago, residential inventory decreased by about 4 months
(from 2.9 years to 2.6 years);
average sales priced decreased by 9% (from $427,342 to $390,012)
Compared to last year, residential inventory is unchanged at 2.6 years;
average sales price increased by 17% (from $296,020 to $390,012)
Condominium
Compared to 6 years ago, condominium inventory has decreased by more than 6 years (from 6.8 years to 5 months);
average condominium sales price increased by 6% (from $102,250 to $108,263)
Compared to last year, condominium inventory decreased by 7 months;
average sales price increased by 10% (from $98,462 to $108,263)
Vacant Land
Compared to 6 years ago, land inventory decreased by nearly 10 years
(from 16.2 years to 6.5 years);
average lot sales price increased by 10% (from $61,000 to $67,314)
Compared to last year, land inventory decreased by nearly 14 years;
the average lot sales price decreased 7% (from $72,625 to $67,314)
Northside A & B
North Shore from North Judiths Fancy to Hamms Bluff
Residential
Compared to 6 years ago, residential inventory decreased by 2.5 years;
average home sales price increased by 7% (from $592,312 to $632,294)
Compared to last year, residential inventory decreased by about 5 months;
average home sales price decreased 7% (from $677,762 to $632,294)
Condominium
Compared to 6 years ago, condominium inventory decreased by 2.5 years (from 4.7 years to 2 years);
average sales price decreased 16% (from $440,000 to $369,167)
Compared to last year, condominium inventory increased by more than 20 months
(from 0.3 years to 2 years);
average sales price increased by 34% (from $276,125 to $369,167)
Vacant Land
Compared to 6 years ago, land inventory decreased by 8 years
(from 14 years to 6 years);
average lot sales price increased by 17% (from $59,333 to $69,333)
Compared to last year, land inventory decreased by 1.2 years
(from 7.2 years to 6 years);
average lot sales price increased by 4% (from $66,667 to $69,333)
King
South Shore from La Reine West to UVI
Residential
Compared to 6 years ago, residential inventory increased by 3 years
(from 4 years to 7 years);
average home sales price decreased by 20% (from $247,800 to $196,667)
Compared to last year, residential inventory increased by nearly 5 years
(from 2.3 years to 7 years);
average residential sales price increased by 23% (from $159,250 to $196,667)
Condominium
There are no condominium complexes in King Quarter
Vacant Land
6 years ago, no land sales were reported in King Quarter during the 12 month period ending November 2011.
Compared to last year, land inventory increased by 6 months
(from 7 years to 7.5 years);
average lot sales price decreased by 52% (from $42,500 to $20,500)
Prince
South Shore from UVI West to Williams Delight
Residential
Compared to 6 years ago, there is about 10 months less residential inventory
(from 2.6 years to 1.8 years);
average residential sales price decreased by 17% (from $239,519 to $208,115)
Compared to last year, residential inventory decreased by about 7 months
(from 2.4 years to 1.8 years);
average residential sales price decreased by 1% (from $210,846 to $208,115)
Condominium
Compared to 6 years ago, condominium inventory increased by 1.3 years (from 3.7 years to 5 years);
average condominium sales price decreased by 45% (from $288,333 to $160,000)
Compared to last year, condominium inventory increased 3.2 years
(from 1.8 years to 5 years);
average condominium sale price decreased by 6% (from $170,625 to $160,000)
Vacant Land
Compared to 6 years ago, land inventory decreased by 5.7 years
(from 9.3 years to 3.6 years);
average lot sales price decreased by 49% (from $50,714 to $25,690)
Compared to last year, land inventory decreased by 6.2 years
(from 9.8 years to 3.6 years);
average lot sales price decreased by 2% (from $26,249 to $25,690)
West End
South Shore, South from Mahogany Road,
East to Williams Delight
Residential
Compared to 6 years ago, residential inventory decreased by about 10 months
(from 2.9 years to 2.1 years);
average home sale price has increased by 13% (from $157,512 to $177,647)
Compared to last year, residential inventory increased by about 7 months
(from 1.6 years to 2.1 years);
average home sale price decreased 12% (from $200,875 to $177,647)
Condominium
Compared to 6 years ago, condominium inventory decreased by 1.3 years (from 2.3 years to 1 year);
average condominium sale price increased by 4% (from $146,250 to $152,740)
Compared to last year, condominium inventory decreased by 3 years;
average condominium sales price decreased by 12% (from $172,500 to $152,740)
Vacant Land
Compared to 6 years ago, land inventory increased by 1.2 years
(from 10.9 years to 12.1years);
average lot sales price decreased by 31% (from $32,222 to $22,214)
Compared to last year, land inventory increased by 2.6 years
(from 9.5 years to 12.1 years);
average lot sales price decreased by 64% (from $61,750 to $22,214)
Information is from MLS and deemed to be reliable, but is not guaranteed.
Prepared by:
Julie San Martin
Team Manager
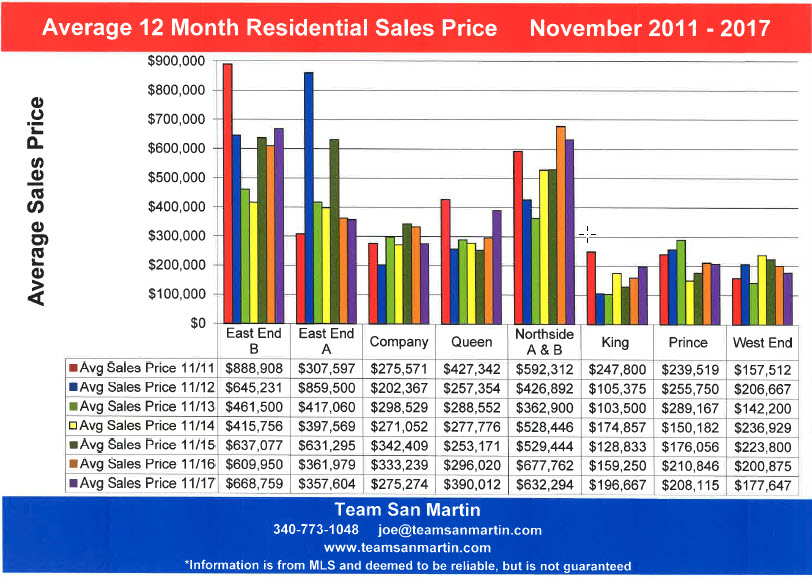
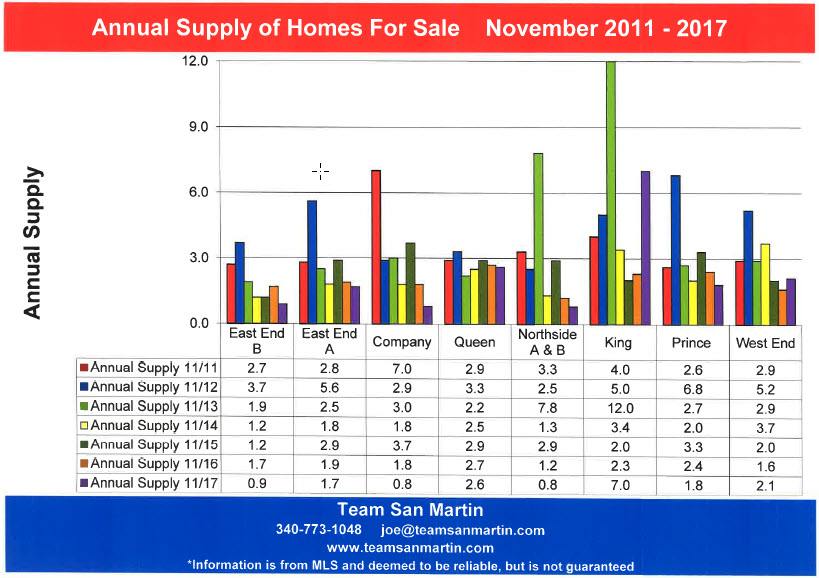
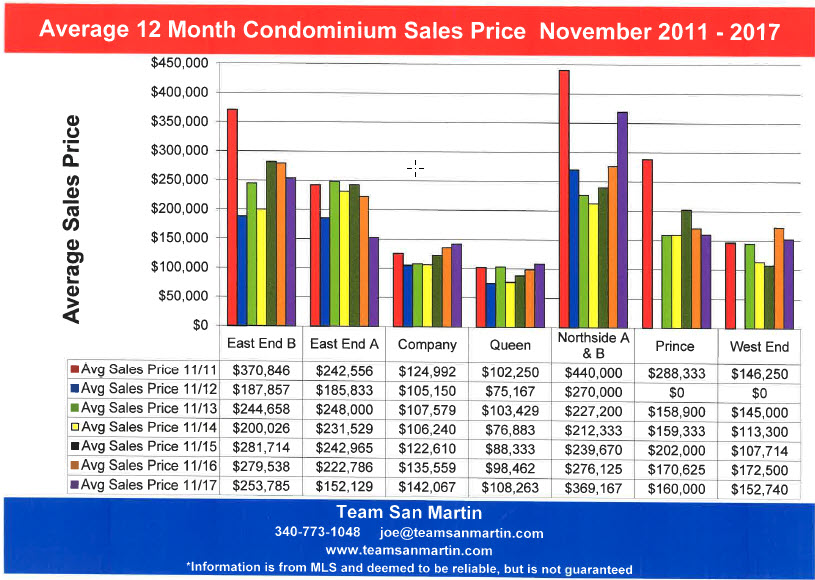
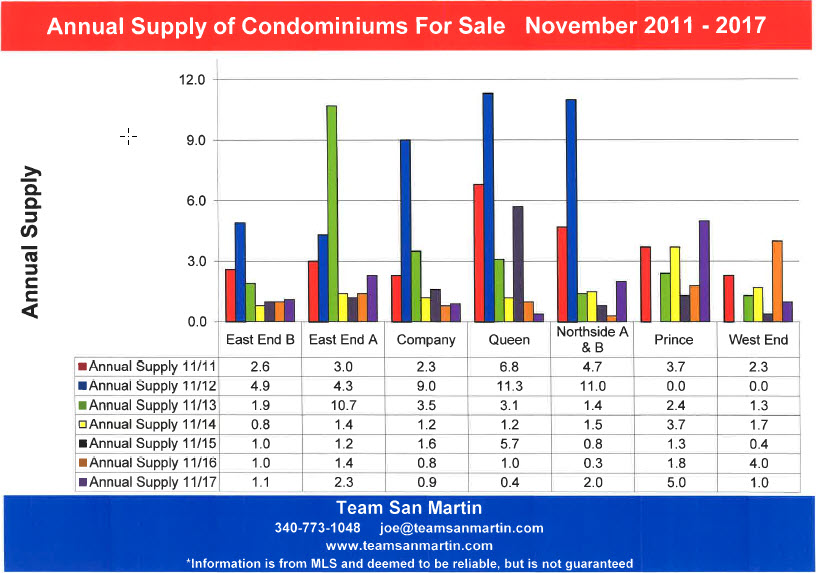
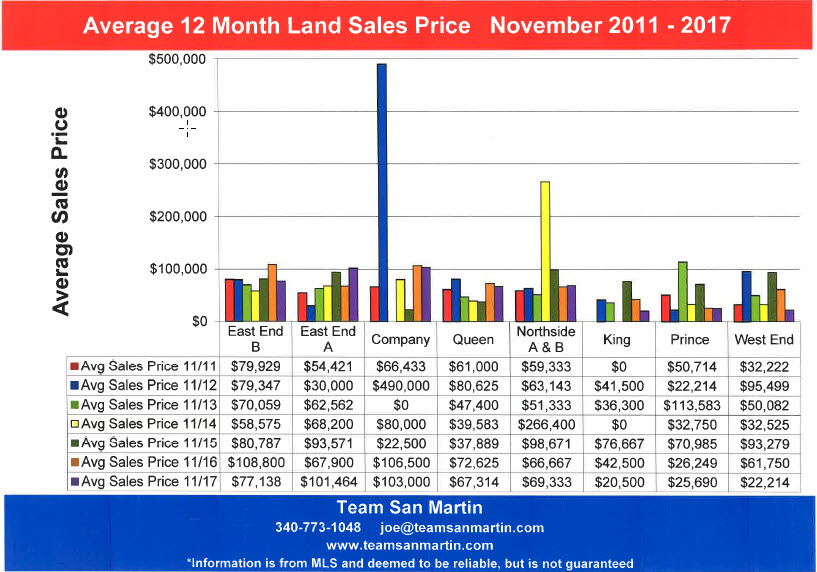
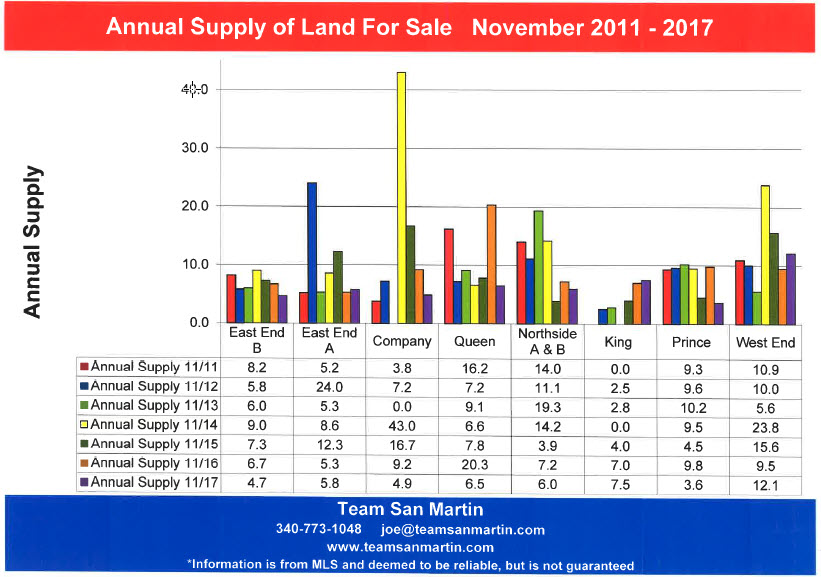
November 2017
Which St Croix Price Ranges are Selling?
First 10 months of 2014, 2105, 2016, and 2017
Residential
2014
134 home sales closed January through October; there were 308 homes for sale
2.3 sellers for every buyer
2015
111 home sales closed January through October; there were 273 homes for sale
2.5 sellers for every buyer
2016
143 home sales closed January through October; there were 240 homes for sale
1.7 sellers for every buyer
2017
130 home sales closed January through October; there were 200 homes for sale
1.5 sellers for every buyer
Condominium
2014
101 condominium sales closed January - October; there were 154 condos for sale
1.5 sellers for every buyer
2015
88 condominium sales closed January - October; there were 127 condos for sale
1.4 sellers for every buyer
2016
106 condominium sales closed January - October; there were 79 condos for sale
0.75 sellers for every buyer; condos are selling in less than 1 year on the market
2017
92 condominium sales closed January - October; there were 81 condos for sale
0.88 sellers for every buyer; condos continue to sell in less than 1 year on the market
Vacant Land
37 land sales closed January through October; there were 522 lots for sale
14.1 sellers for every buyer
2015
62 land sales closed January through October; there were 490 lots for sale
7.9 sellers for every buyer
2016
64 land sales closed January through October; there were 551 lots for sale
8.6 sellers for every buyer
2017
75 land sales closed January through October; there were 486 lots for sale
6.5 sellers for every buyer
SALES BY PRICE RANGE
Residential
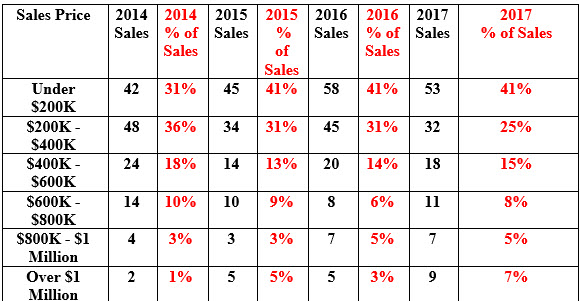
Condominium
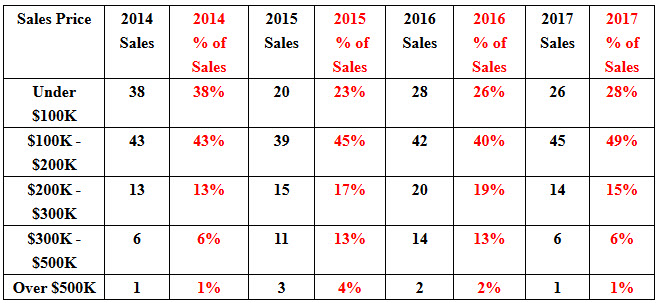
Vacant Land
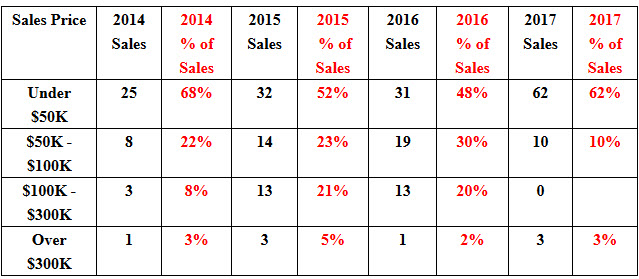
Information is from MLS and deemed to be reliable, but is not guaranteed.
Prepared by:
Julie San Martin
Team Manager
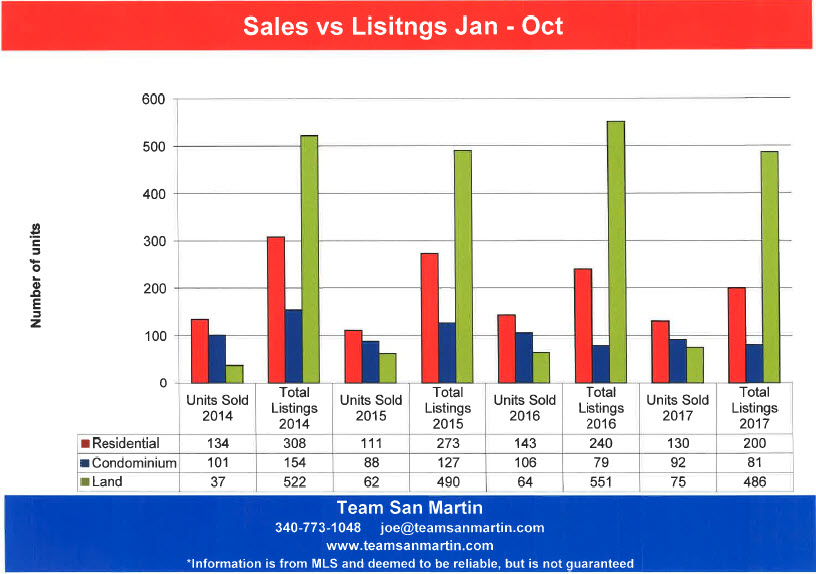
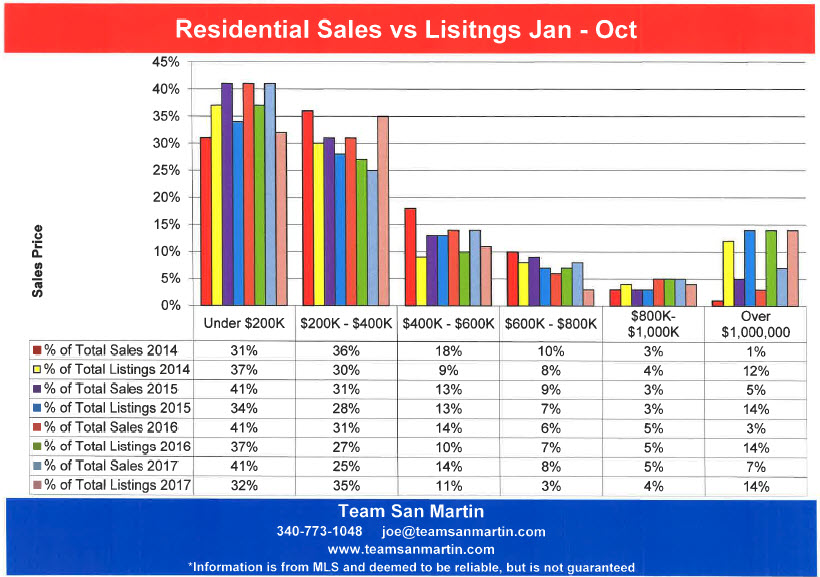
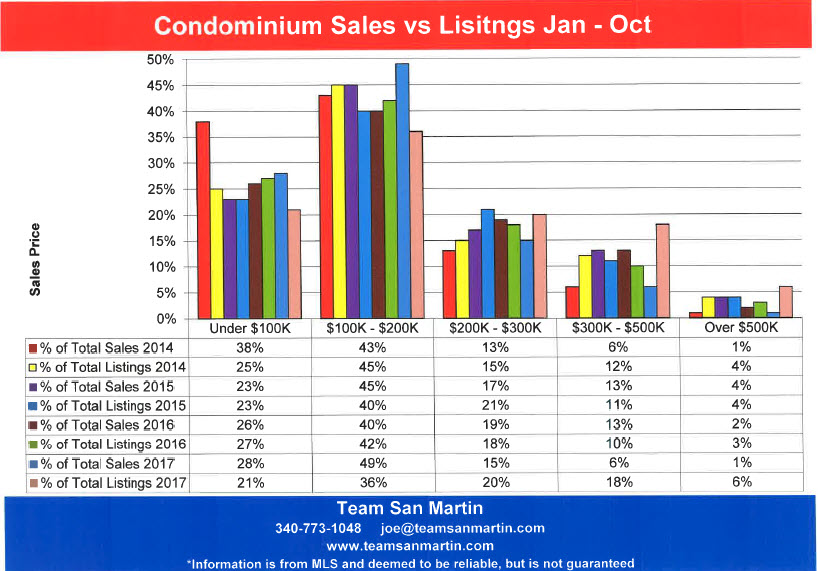
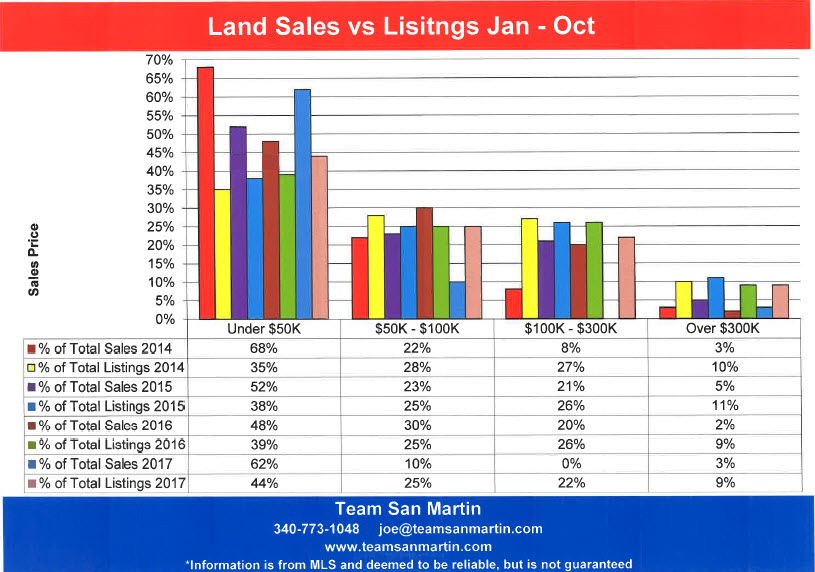
October 2017
Eight Year Comparison
St Croix Real Estate Inventory Levels
TOTAL INVENTORY
Residential
15% lower (41 homes) than eight years ago.
Highest inventory during this period was 9/15/12 with 336 homes on the market (33% higher than 9/15/17)
Condominium
GIGANTIC decrease over the eight year period!
Eight years ago, there were nearly three times as many condominiums on the market (236) as were for sale on 9/15/17 (87)
Vacant Land
16% lower (89 lots) than eight years ago.
Land inventory has varied little over the eight year period, with the lowest inventory level on 9/15/17 (486 lots)
INVENTORY BY PRICE RANGE
Residential
Under $200,000 listings have more than doubled (from 13% to 34%) as percentage of total inventory, compared to eight years ago.
$200,000 to $400,000 listings have increased to 1/3 of the total inventory from about 28%, compared to eight years ago.
$400,000 to $600,000 listings decreased by 3% of the total inventory over the eight year period.
$600,000 to $800,000 listings have decreased from 15% to just 3% of total inventory over the eight year period.
$800,000 to $1,000,000 have decreased by 50% over the eight year period, from 8% of total inventory on 9/15/09 to 4% on 9/15/17.
Listings over $1,000,000 have decreased by 6% of the total inventory over the eight year period, from 20% on 9/15/09 to 14% on 9/15/17.
Condominium
Under $100,000 listings have nearly doubled (from 11% to 21%) as percentage of total inventory, compared to eight years ago.
$100,000 to $200,000 listings have decreased by 11% of total inventory, to about 36%, compared to eight years ago.
$200,000 to $300,000 listings have increased by 2% as percentage of total inventory, at about 19%, compared to eight years ago.
$300,000 to $500,000 listings have also increased by about 2%, from 17% to 19%, compared to eight years ago.
Listings over $500,000 have decreased by 3% of the total inventory over the eight year period, from 8% on 9/15/09 to 5% on 9/15/17.
Vacant Land
Under $50,000 listings have nearly doubled (from 21% to 44%) as percentage of total inventory, compared to eight years ago.
$50,000 to $100,000 listings have decreased by 5% as percentage of total inventory, from 30% to 25%, compared to eight years ago.
$100,000 to $300,000 listings have decreased by 11%, from 33% to 22%, compared to eight years ago.
Listings over $300,000 have decreased by 7% of the total inventory over the eight year period, from 16% on 9/15/09 to 9% on 9/15/17.
Information is from MLS and deemed to be reliable, but is not guaranteed.
Prepared by:
Julie San Martin
Team Manager


September 2017
A Tale of Two Islands
St Croix and St Thomas Real Estate Sales
Five Year Comparison Year to Date
Number of Sales
Residential
Both islands experienced a similar phenomenon, a significant increase in the number of units sold in 2014, a return to nearly the 2013 figure the next year (2015), and then an increase of about 1/3 for total units sold during this period in 2016 and 2017
|
% increase (decrease) |
St Croix |
% increase (decrease) |
St Thomas |
Number of Homes Sold |
|
|
82 |
|
46 |
Jan – Aug 2013 |
|
+39% |
114 |
+46% |
67 |
Jan – Aug 2014 |
|
(-25%) |
85 |
(-19%) |
54 |
Jan – Aug 2015 |
|
+38% |
117 |
+37% |
74 |
Jan – Aug 2016 |
|
+5% |
123 |
+4% |
77 |
Jan – Aug 2017 |
Condominium
Very similar to the home market for both islands except the reduction in units sold during this period in 2015 was not as severe as experienced by the housing market.
|
% increase (decrease) |
St Croix |
% increase (decrease) |
St Thomas |
Number of Condos Sold |
|
|
54 |
|
52 |
Jan – Aug 2013 |
|
+52% |
82 |
+35% |
70 |
Jan – Aug 2014 |
|
(-16%) |
69 |
(-6%) |
66 |
Jan – Aug 2015 |
|
+16% |
80 |
+38% |
91 |
Jan – Aug 2016 |
|
+11% |
89 |
+7% |
98 |
Jan – Aug 2017 |
Vacant Land
Vacant land is not selling well on either island. During this period in 2014, exactly the same number of lots were sold on both islands – this was a significant up tick for St Thomas and a big down tick for St Croix. 2017 saw a significant increase in lot sales on both islands.
|
% increase (decrease) |
St Croix |
% increase (decrease) |
St Thomas |
Number of Lots Sold |
|
|
41 |
|
21 |
Jan – Aug 2013 |
|
(-27%) |
30 |
+43% |
30 |
Jan – Aug 2014 |
|
+57% |
47 |
+27% |
38 |
Jan – Aug 2015 |
|
+15% |
54 |
(-29%) |
27 |
Jan – Aug 2016 |
|
+30% |
70 |
+59% |
43 |
Jan – Aug 2017 |
Average Sales Price
Residential
Comparatively, St Croix has performed better than St Thomas, but we still have a long way to go; the average home sale price on St Thomas is about 50% more than on St Croix.
|
% increase (decrease) |
St Croix |
% increase (decrease) |
St Thomas |
Average Home Sales Price |
|
|
$287,762 |
|
$665,130 |
Jan – Aug 2013 |
|
+16% |
$332,572 |
+16% |
$772,334 |
Jan – Aug 2014 |
|
+28% |
$426,719 |
(-11%) |
$689,658 |
Jan – Aug 2015 |
|
(-18%) |
$350,076 |
(-14%) |
$594,317 |
Jan – Aug 2016 |
|
+12% |
$393,754 |
(-2%) |
$583,676 |
Jan – Aug 2017 |
St Thomas Home Sales Prices
|
|
Lowest |
Highest |
|
Jan – Aug 2013 |
$100,000 |
$3,300,000 |
|
Jan – Aug 2014 |
$34,000 |
$4,400,000 |
|
Jan – Aug 2015 |
$85,000 |
$6,000,000 |
|
Jan – Aug 2016 |
$49,000 |
$2,990,000 |
|
Jan – Aug 2017 |
$9,000 |
$3,200,000 |
St Croix Home Sales Prices
|
|
Lowest |
Highest |
|
Jan – Aug 2013 |
$35,000 |
$800,000 |
|
Jan – Aug 2014 |
$35,000 |
$1,680,000 |
|
Jan – Aug 2015 |
$31,000 |
$6,250,000 |
|
Jan – Aug 2016 |
$40,000 |
$2,500,000 |
|
Jan – Aug 2017 |
$17,000 |
$2,212,500 |
The median sales price is the midpoint - half of all homes sold for more than this price, half sold for less. For St Thomas, the median sales price has decreased by $110,000 over the 5 year period. On St Croix, the median sales price is $10,000 higher than 5 years ago, but still only 70% of the St Thomas median sales price.
Median Home Sales Price
|
% increase (decrease) |
St Croix |
% increase (decrease) |
St Thomas |
Median Home Sales Price |
|
|
$270,000 |
|
$515,000 |
Jan – Aug 2013 |
|
+11% |
$299,000 |
(-5%) |
$490,000 |
Jan – Aug 2014 |
|
(-15%) |
$255,000 |
No change |
$492,000 |
Jan – Aug 2015 |
|
(-14%) |
$220,000 |
No change |
$492,500 |
Jan – Aug 2016 |
|
+27% |
$280,000 |
(-18%) |
$405,000 |
Jan – Aug 2017 |
Average Sales Price
Condominium
Average condominium sales price has increased by about $30,000 for St Thomas over the 5 year period. On St Croix, average condominium sales price has decreased by $5,000, compared to this period 5 years ago.
|
% increase (decrease) |
St Croix |
% increase (decrease) |
St Thomas |
Average condo Sales Price |
|
|
$169,563 |
|
$223,604 |
Jan – Aug 2013 |
|
(-8%) |
$155,356 |
(-2%) |
$219,512 |
Jan – Aug 2014 |
|
+30% |
$202,402 |
+3% |
$227,064 |
Jan – Aug 2015 |
|
(-17%) |
$168,023 |
+21% |
$274,901 |
Jan – Aug 2016 |
|
(-2%) |
$164,630 |
(-7%) |
$254,416 |
Jan – Aug 2017 |
St Thomas Condominium Sales Prices
|
|
Lowest |
Highest |
|
Jan – Aug 2013 |
$38,000 |
$550,000 |
|
Jan – Aug 2014 |
$39,000 |
$770,000 |
|
Jan – Aug 2015 |
$55,000 |
$940,000 |
|
Jan – Aug 2016 |
$30,000 |
$1,690,000 |
|
Jan – Aug 2017 |
$24,000 |
$665,000 |
St Croix Condominium Sales Prices
|
|
Lowest |
Highest |
|
Jan – Aug 2013 |
$40,000 |
$545,000 |
|
Jan – Aug 2014 |
$30,000 |
$775,000 |
|
Jan – Aug 2015 |
$22,500 |
$1,150,000 |
|
Jan – Aug 2016 |
$22,500 |
$700,000 |
|
Jan – Aug 2017 |
$33,000 |
$570,000 |
The median condominium sales price on St Thomas increased 24% over the 5 year period. St Croix showed no change, compared to 5 years ago. The median St Thomas sales price is $70,000 higher than St Croix.
Median Condominium Sales Price
|
% increase (decrease) |
St Croix |
% increase (decrease) |
St Thomas |
Median Condo Sales Price |
|
|
$144,500 |
|
$173,750 |
Jan – Aug 2013 |
|
(-18%) |
$119,125 |
(-5%) |
$165,000 |
Jan – Aug 2014 |
|
+26% |
$150,000 |
+9% |
$180,000 |
Jan – Aug 2015 |
|
(-10%) |
$135,000 |
+21% |
$218,000 |
Jan – Aug 2016 |
|
+7% |
$145,000 |
(-1%) |
$215,000 |
Jan – Aug 2017 |
Average Sales Price
Vacant Land
The worst performing segment of our real estate market has mirrored the home market with the exception that the average sale price is now nearly twice that of 5 years ago, for both islands.
|
% increase (decrease) |
St Croix |
% increase (decrease) |
St Thomas |
Average lot Sales Price |
|
|
$43,425 |
|
$108,357 |
Jan – Aug 2013 |
|
+85% |
$80,162 |
+16% |
$126,172 |
Jan – Aug 2014 |
|
(-3%) |
$78,055 |
(-26%) |
$91,737 |
Jan – Aug 2015 |
|
(-2%) |
$76,518 |
+97% |
$181,144 |
Jan – Aug 2016 |
|
(-5%) |
$72,574 |
+27% |
$229,535 |
Jan – Aug 2017 |
St Thomas Land Sales Prices
|
|
Lowest |
Highest |
|
Jan – Aug 2013 |
$35,000 |
$250,000 |
|
Jan – Aug 2014 |
$15,000 |
$900,000 |
|
Jan – Aug 2015 |
$20,000 |
$370,000 |
|
Jan – Aug 2016 |
$8,000 |
$900,000 |
|
Jan – Aug 2017 |
$20,000 |
$2,100,000 |
St Croix Land Sales Prices
|
|
Lowest |
Highest |
|
Jan – Aug 2013 |
$10,000 |
$120,000 |
|
Jan – Aug 2014 |
$8,000 |
$370,000 |
|
Jan – Aug 2015 |
$13,000 |
$348,000 |
|
Jan – Aug 2016 |
$16,000 |
$335,000 |
|
Jan – Aug 2017 |
$12,000 |
$500,000 |
Median Land Sales Price
On both islands, the median lot sales price is almost exactly the same as 5 years ago.
|
% increase (decrease) |
St Croix |
% increase (decrease) |
St Thomas |
Median Lot Sales Price |
|
|
$34,500 |
|
$84,500 |
Jan – Aug 2013 |
|
+14% |
$39,500 |
+1% |
$85,000 |
Jan – Aug 2014 |
|
+1% |
$40,000 |
(-35%) |
$55,000 |
Jan – Aug 2015 |
|
+64% |
$65,500 |
+78% |
$98,000 |
Jan – Aug 2016 |
|
(-43%) |
$37,250 |
(-13%) |
$85,000 |
Jan – Aug 2017 |
Total Market (Millions)
For the first time in this 5 year period, the St Croix total residential market exceeded that of St Thomas, by 1%.
Residential
|
% increase (decrease) |
St Croix |
% increase (decrease) |
St Thomas |
Number of Homes Sold |
|
|
$23.6 |
|
$30.6 |
Jan – Aug 2013 |
|
+61% |
$37.9 |
+69% |
$51.7 |
Jan – Aug 2014 |
|
(-4%) |
$36.3 |
(-28%) |
$37.2 |
Jan – Aug 2015 |
|
+13% |
$41.0 |
+18% |
$44.0 |
Jan – Aug 2016 |
|
+18% |
$48.4 |
+2% |
$44.9 |
Jan – Aug 2017 |
The St Thomas total condominium market was 2 ½ times that of 5 years ago, for this period. The St Croix figure was 1 ½ times that of 5 years ago, and only about 60% of the St Thomas total market
Condominium
|
% increase (decrease) |
St Croix |
% increase (decrease) |
St Thomas |
Number of Condos Sold |
|
|
$9.2 |
|
$11.6 |
Jan – Aug 2013 |
|
+38% |
$12.7 |
+33% |
$15.4 |
Jan – Aug 2014 |
|
+10% |
$14.0 |
(-3%) |
$15.0 |
Jan – Aug 2015 |
|
(-4%) |
$13.4 |
+67% |
$25.0 |
Jan – Aug 2016 |
|
+9% |
$14.6 |
No change |
$24.9 |
Jan – Aug 2017 |
The St Thomas total land market quadrupled over the 5 year period and their total market is twice that of St Croix. On St Croix the total market is about 2 ½ times that of 5 years ago for this period.
Vacant Land
|
% increase (decrease) |
St Croix |
% increase (decrease) |
St Thomas |
Number of Lots Sold |
|
|
$1.8 |
|
$2.3 |
Jan – Aug 2013 |
|
+33% |
$2.4 |
+65% |
$3.8 |
Jan – Aug 2014 |
|
+54% |
$3.7 |
(-8%) |
$3.5 |
Jan – Aug 2015 |
|
+11% |
$4.1 |
+40% |
$4.9 |
Jan – Aug 2016 |
|
+24% |
$5.1 |
+102% |
$9.9 |
Jan – Aug 2017 |
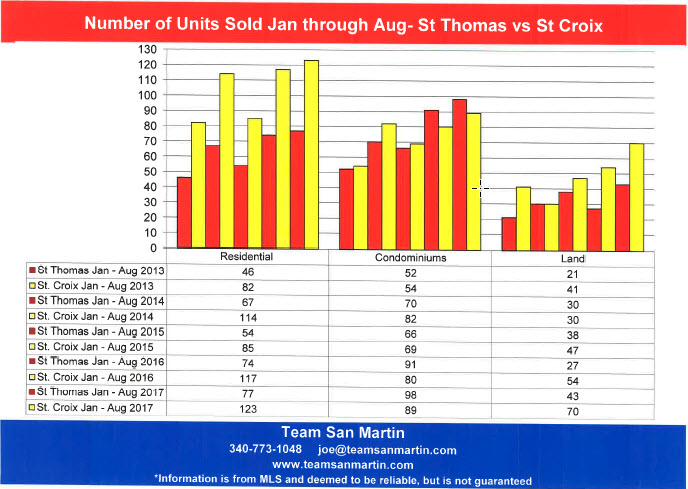
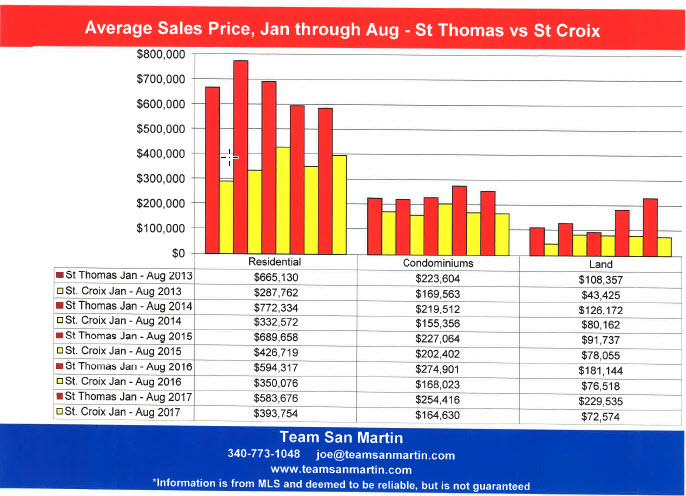
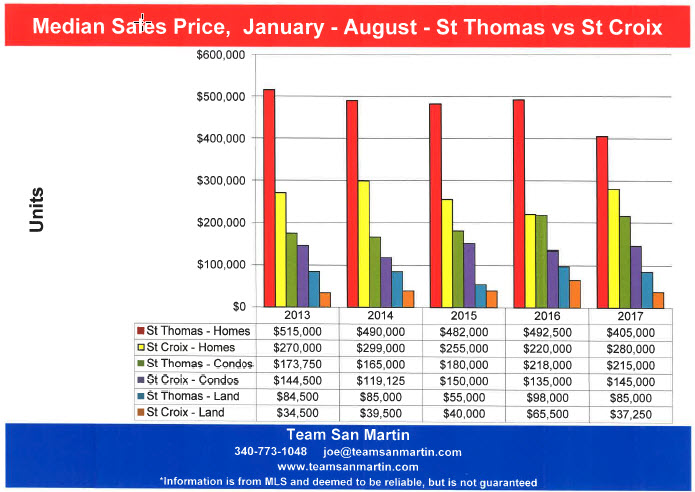
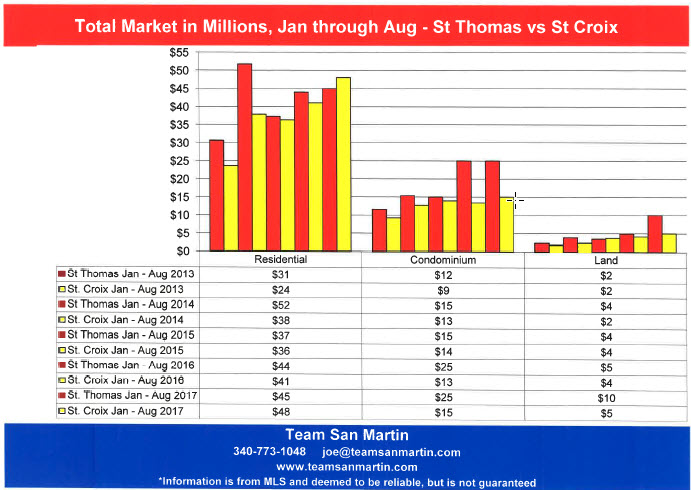
Information is from MLS and deemed to be reliable, but is not guaranteed.
Prepared by:
Julie San Martin
Team Manager
August 2017
Sales Price and Marketing Time on St Croix
“Annual Supply” represents the number of years it will take at the current annual rate of sales to sell all the properties for sale
in a specific area.
East End B
Far East End
Inventory
Five years ago (July 2012), there was a 4.7 year supply of homes and a 4.3 year supply of condominiums on the market.
For both homes and condominiums, the inventory has decreased by more than 3 years, to an 11 month supply of homes and a 1 year supply of condominiums.
Average Sales Price
For homes, the average sales price has increased, compared to five years ago.
Average home sale price increased by 5% over the five year period, from $575,667 for the 12 months ending July 2012 to $602,086 for the 12 months ending July 2017.
Condominiums saw a significant average sale price decrease of 22% ($83,895), from $382,500 for the 12 months ending July 2012 to $298,605 for the 12 months ending July 2017.
East End A
Christiansted east to Coakley Bay
Inventory
Five years ago (July 2012), there was a 4.2 year supply of homes and a 4.8 year supply of condominiums on the market.
For both homes and condominiums, the inventory has decreased by about 3 years, to a 1.6 year supply of homes and a 1.8 year supply of condominiums.
Average Sales Price
For homes, the average sales price decreased, compared to five years ago. For condominiums, the average sale price increased by about $4,000.
Average home sale price decreased by 7% ($82,209) over the five year period, from $481,712 for the 12 months ending July 2012 to $399,503 for the 12 months ending July 2017.
Condominiums saw a 2% increase in average sales price, from $204,667 for the 12 months ending July 2012 to $208,333 for the 12 months ending July 2017.
Company
Christiansted west to east side of Judiths Fancy
Inventory
Five years ago (July 2012), there was a 3.7 year supply of homes and a 5.9 year supply of condominiums on the market.
For homes, the inventory decreased by nearly 3 years, to just a 1 year supply of homes.
For condominiums, the inventory sell off was even more dramatic, from a 5.9 year supply of units to just 8 months! There were 52 condominium sales in Company Quarter in the past 12 months; extraordinary when you consider there are currently only 79 condominiums for sale on St Croix!
Average Sales Price
For both homes and condominiums, the average sales price increased, compared to five years ago.
Average home sale price increased 86% over the five year period, from $191,269 for the 12 months ending July 2012 to $356,306 for the 12 months ending July 2017.
Condominiums saw a 43% increase in average sales price, from $106,250 for the 12 months ending July 2012 to $152,223 for the 12 months ending July 2017.
Queen
Constitution Hill west to La Reine, includes southwest Judiths Fancy
Inventory
Five years ago (July 2012), there was a 3.1 year supply of homes and an 8.3 year supply of condominiums on the market.
For homes, the inventory decreased only slightly, to a 2.6 year supply of homes.
For condominiums, the supply decreased by nearly 8 years to a six month supply of condominiums.
Average Sales Price
For homes, the average sales price decreased 16% ($38,118), compared to four years ago, from $291,289 to $253,171 for the 12 months ending July 2017.
Condominiums not only saw a big decrease in inventory, the average sales price increased 48% ($36,140), from $75,125 for the 12 months ending July 2012 to $111,265 for the 12 months ending July 2017.
Northside A & B
North shore from north Judiths Fancy west to Hamms Bluff
Inventory
Five years ago (July 2012), there was a 4.6 year supply of homes and a 6.5 year supply of condominiums on the market.
For homes, the inventory decreased by more than 3 years, to a 1.4 year supply of homes. For condominiums, the supply decreased by nearly 6 years to an eleven month supply of condominiums.
Average Sales Price
For homes, the average sales price increased, compared to five years ago. For condominiums, the average sales price decreased.
Average home sale price increased 38% ($176,596) over the five year period, from $459,110 for the 12 months ending July 2012 to $635,706 for the 12 months ending July 2017.
Condominiums saw a 29% decrease ($100,143) in average sales price, from $345,000 for the 12 months ending July 2012 to $244,857 for the 12 months ending July 2017.
King
South shore from La Reine west to UVI
Located near the closed refinery, this is the worst performing segment of our market.
Inventory
Five years ago (July 2012), there was a 3.8 year supply of homes;
there are no condominiums in King Quarter.
Home inventory increased to a 5 year supply of homes, compared to five years ago. For the 12 months ending July 2013, only one home sold in King Quarter.
Average Sales Price
Average home sale price decreased 24% ($50,800) over the five year period, from $207,400 for the 12 months ending July 2012 to $156,600 for the 12 months ending July 2017.
Prince
South shore from UVI west to Williams Delight
Inventory
Five years ago (July 2012), there was a 5.8 year supply of homes and an 11.0 year supply of condominiums on the market.
For homes, the inventory decreased by nearly 4 years, to a 2 year supply of homes. For condominiums, the supply decreased by 9 years, to a 2 year supply of condominiums.
Average Sales Price
Homes saw a modest price increase, condominiums experienced a dramatic average price decrease, compared to five years ago.
Average home sale price increased 9% ($19,528) over the five year period, from $208,430 for the 12 months ending July 2012 to $227,958 for the 12 months ending July 2017.
Condominiums saw a 62% ($257,667) decrease in average sales price, from $415,000 for the 12 months ending July 2012 to $157,333 for the 12 months ending July 2017.
West End
South from Mahogany Road, East to Williams Delight
Inventory
Five years ago (July 2012), there was a 4.6 year supply of homes and a 7.0 year supply of condominiums on the market.
For homes, the inventory decreased by 2.4 years, to a 2.2 year supply of homes.
For condominiums, the supply decreased by 4.5 years, to a 2.5 year supply of condominiums.
Average Sales Price
For both homes and condominiums, the average sales price increased, compared to five years ago.
Average home sale price increased 15% ($24,315) over the five year period, from $164,300 for the 12 months ending July 2012 to $188,615 for the 12 months ending July 2017.
Condominiums saw a 177% increase in average sales price, from $62,500 for the 12 months ending July 2012 to $173,125 for the 12 months ending July 2017.
Over the six year period, average home sale prices were highest, usually more than double those of other quarters, in these quarters:
· Northside A & B
· East End B
· East End A
· Company
Over the six year period, average condominium sale prices decreased or remained little changed except for these quarters:
· West End
· Company
· Queen
Both home and condominium inventory decreased island wide over the past six years, with the exception of King Quarter, where residential inventory increased by 1.2 years.
Information is from MLS and deemed to be reliable, but is not guaranteed.
Prepared by:
Julie San Martin
Team Manager
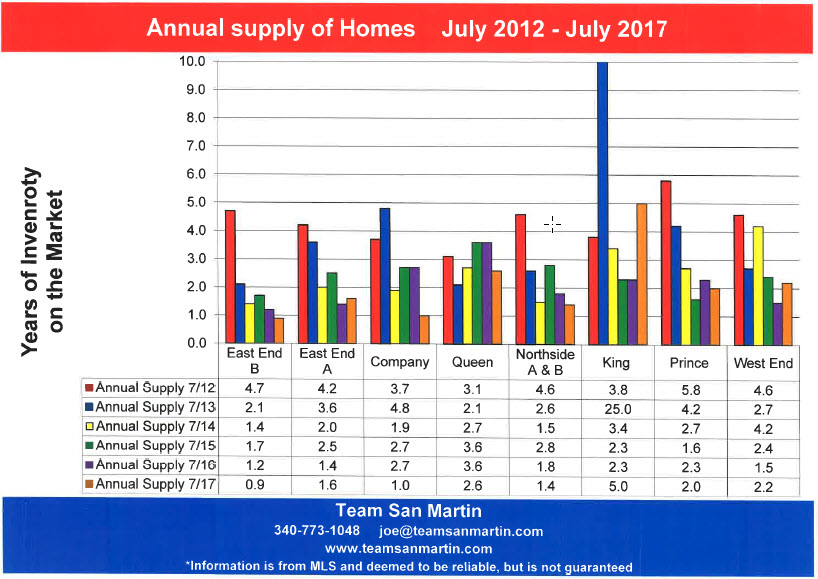
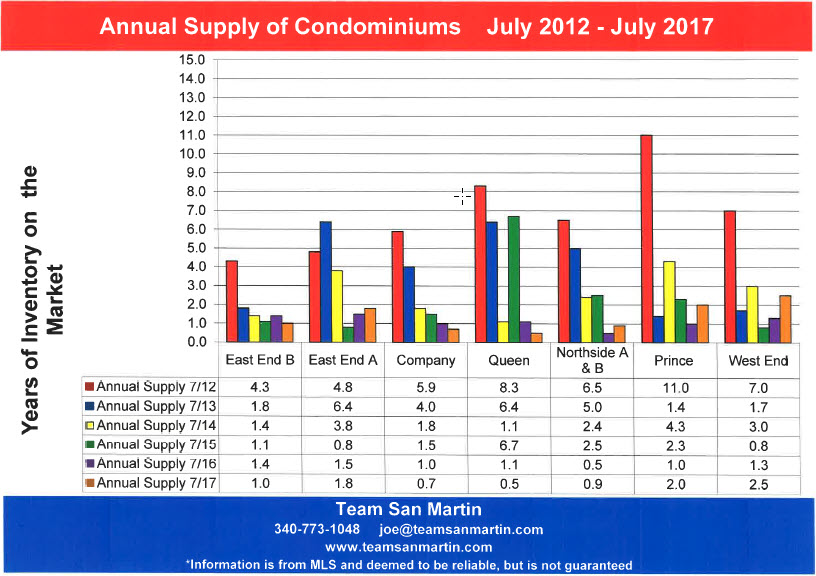
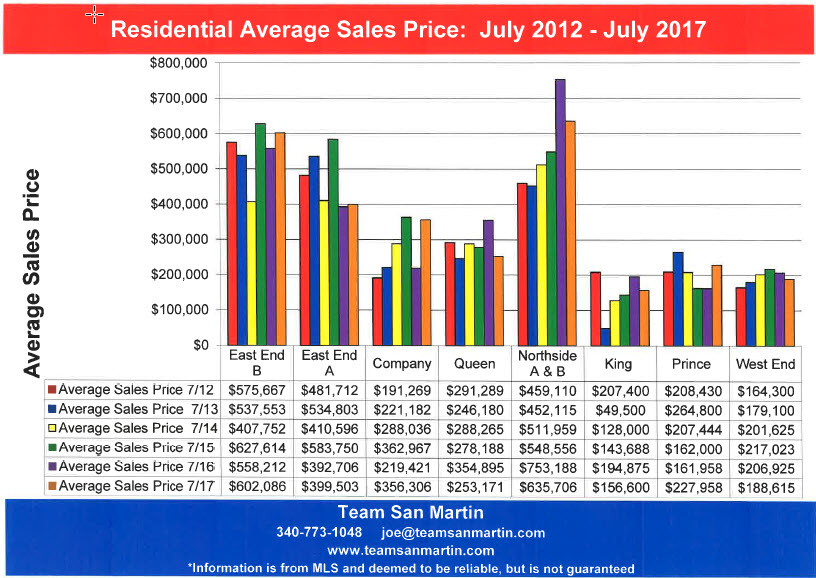
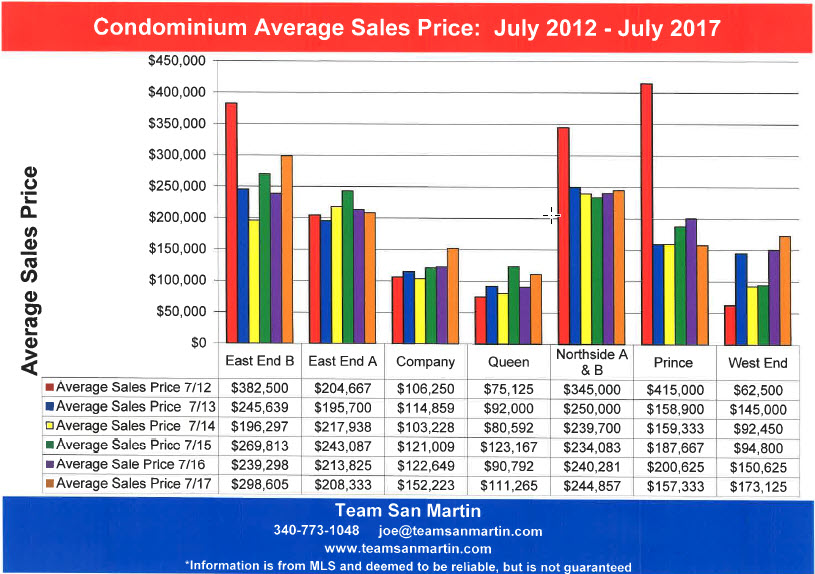
July 2017
12 year look at the St Croix Real Estate Market for the 12 month period ending 30 June
The last real estate boom on St Croix was 12 years ago –
The 2005 / 2006 period
Total number of properties sold
· Residential – Good news! At 175 home sales, total homes sold during the past 12 months is the highest since 2006/2007. The lowest number of sales was 2011/2012, with only 90 home sales.
· Condominiums – More good news! At 142 condo sales, this is the highest number of condominiums sold in a 12 month period since 2005/2006! The lowest number of condo sales was again 2011/2012, with just 42 condo sales.
· Land – Land sales have not changed significantly for the past seven years. At 89 lots sold, this is a slight improvement and the highest number since 2009/2010. But this is only 29 lots more than the lowest number (2012/2013) and just 20% of the market high of 442 lot sales for 2005/2006.
Average sales price
· Residential – Not such good news. The average sales price declined by more than $20,000, compared to the previous 12 month period. For the past six years, the average St Croix home sales price has been between a low of $336,000 (2013/2014) and a high of $392,000 (2015/2016)
· Condominiums – The $189,246 average condo sales price was $30,000 more than the previous 12 month period. This is the highest average condominium sales price since 2011/2012.
· Land – Average lot sales price is unchanged from the previous 12 month period, at $75,822. The average land sales price has changed very little over the past five years, from a low of $66,800 for 2012/2013 to a high of $76,590 for 2015/2016.
Total Market
Number of properties sold x Average sales price
· Residential – The total residential market is unchanged from the previous 12 month period; more homes sold, but at a slightly lower price. The total residential market, at $64.8 million, is about 2/3 of the market high of $93.6 million in 2005/2006.
· Condominiums – Excellent news! At $26.9 million, this is the highest total market since 2005/2006 ($40.1 million) and $8 million more than the previous 12 month period. The market low was $8.8 million for 2011/2012.
· Land – The total market improve by $2 million over the previous 12 month period, but is only 15% of the height of the market in 2005/2006.
Conclusion
Compared to 12 years ago, total St Croix real estate sales have decreased by 45% ($80.9 million)
Compared to the previous 12 month period, total
St Croix real estate sales have increased by $12 million for the period of July 2016 through June 2017
Information is from MLS and deemed to be reliable, but is not guaranteed.
Prepared by:
Julie San Martin
Team Manager
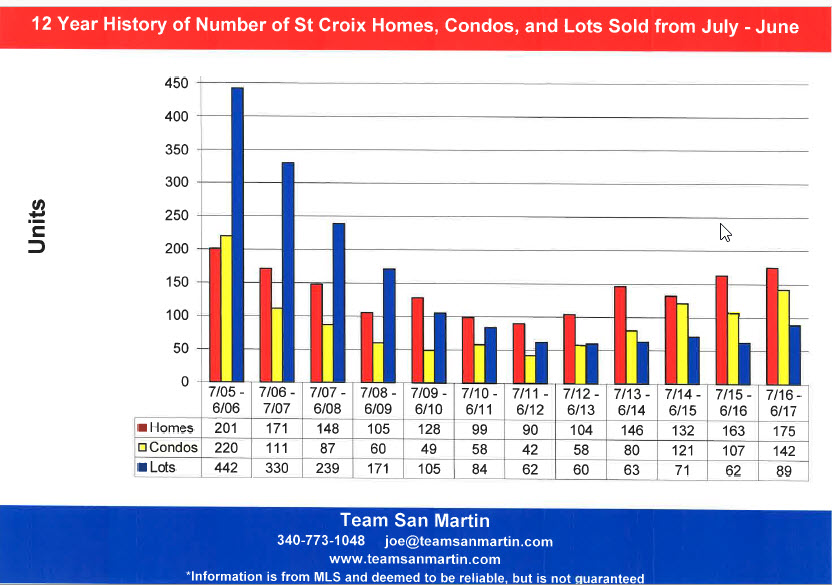
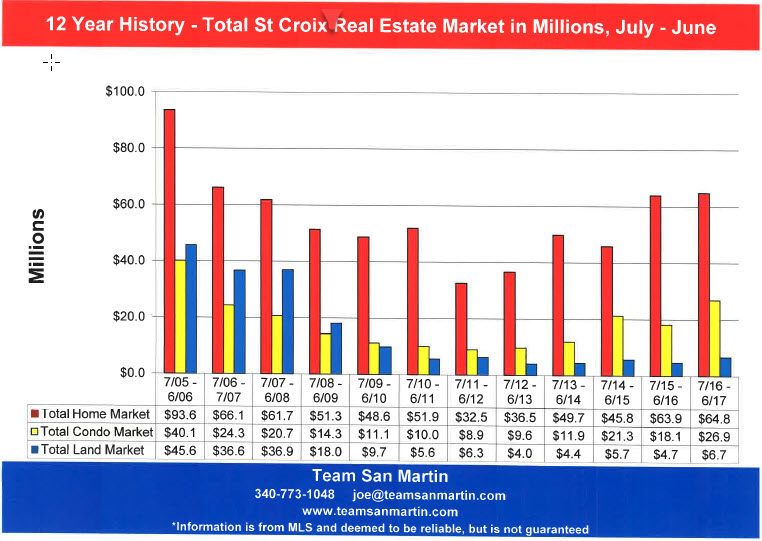
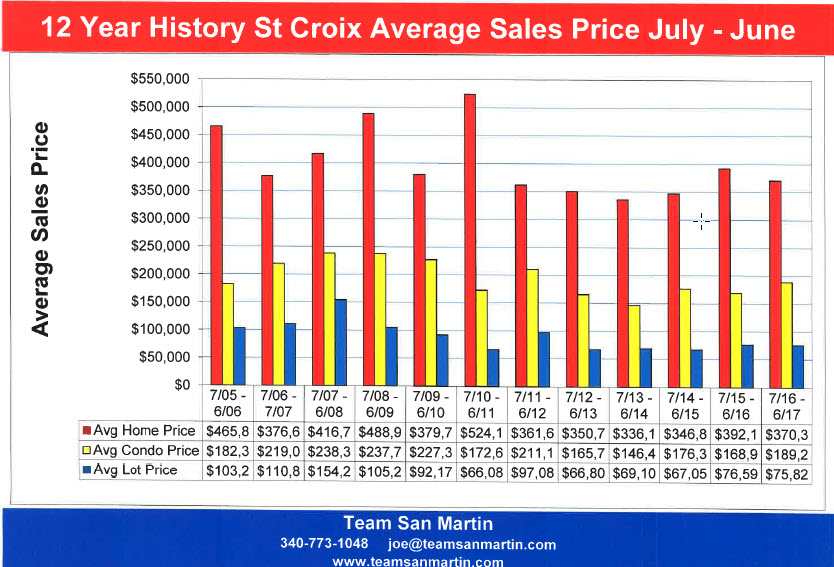
June 2017
Inventory levels by price range reflect the seller’s expectations.
The attached graphs compare changes in asking prices over the past seven years, using 15 May inventory levels.
Residential
· The lowest price range (under $200,000) increased each year through 2016 and more than doubled (from 14% to 32%) over the 7 year period. This price range now represents one third of the St Croix home market.
· The second tier (($200,000 to $400,000) has consistently represented nearly 1/3 of all homes for sale on St Croix over the 7 year period. Nearly 2/3 of all homes for sale on St Croix are currently listed for $400,000 or less.
· Over the 7 year period, homes listed from more than $400,000 have decreased by 20%, from 56% of the market to 36% of all homes for sale on St. Croix in May 2017.
Condominium
· The lowest price range (under $100,000) has more than doubled over the 7 year period, from 9% of total market in 2010 to 23% of the total St Croix condominium market in 2017.
· The second tier ($100,000 to $200,000) has decreased by 12%, when compared to May 2010, when this price range represented 50% of all St Croix condominiums for sale.
· Condominiums listed for more than $200,000 now comprise approximately 40% of the total market, as they did seven years ago. In 2013, 2014, and 2016, this segment of the market represented only 30% of all St Croix condominiums for sale.
Land
· The lowest price range (under $50,000) has more than doubled over the 7 year period, from 20% of total market in 2010 to 45% of all lots for sale in 2017.
· The second tier ($50,000 to $100,000) has decreased by 11% over the 7 year period, from 35% of total market in 2010 to 24% of all lots for sale in 2017.
· Lots listed for more than $100,000 have decreased by 13% over the 7 year period, from 45% of the St Croix land market in 2010 to 32% in May 2017.
Information is from MLS and deemed to be reliable, but is not guaranteed.
Prepared by:
Julie San Martin
Team Manager
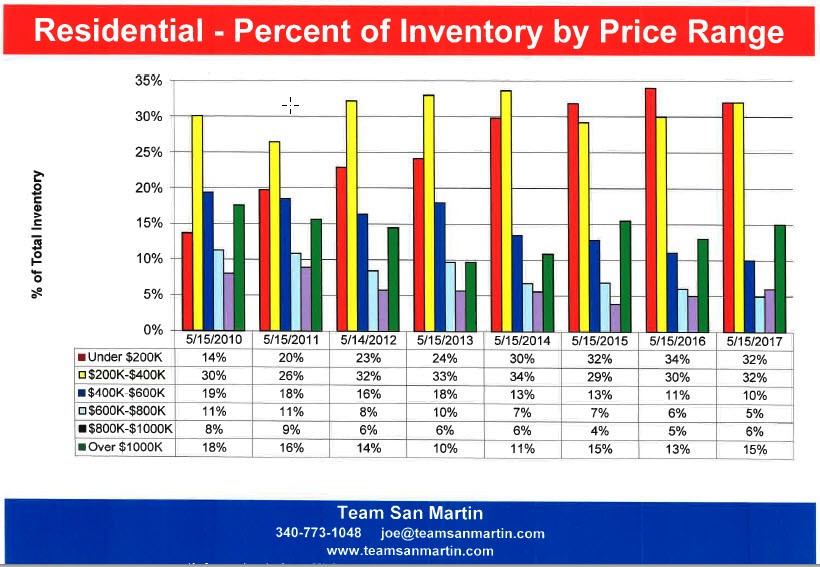
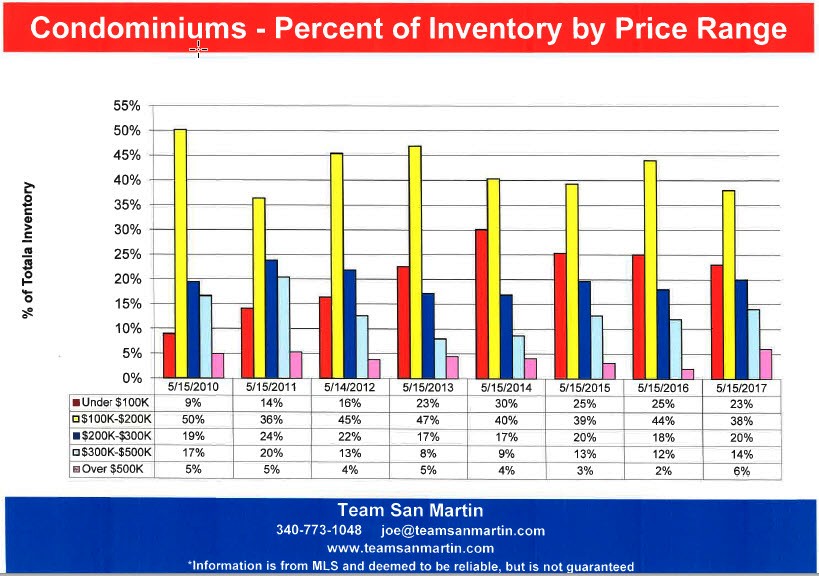
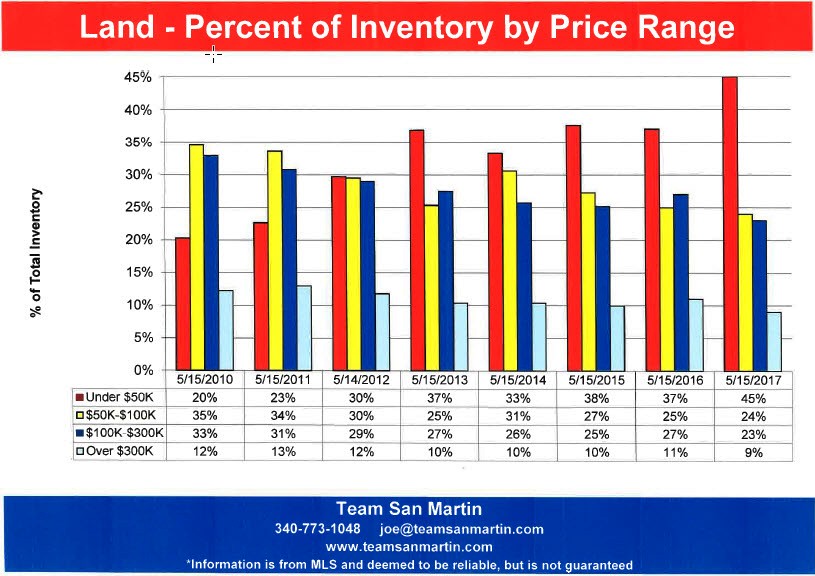
May 2017
Inventory Levels and Sales Projections
May Inventory Levels
7 Year Review
Residential
Residential inventory peaked in 2012 and has been steadily declining since then. Current inventory is slightly lower (20 homes) compared to May 2011.
Condominium
Condominium inventory also peaked in 2012 and has been steadily declining since then. Current inventory (81 condos) is less than half of the May 2011 condominium inventory of 194 condominiums.
Land
Land inventory peaked in 2011, steadily declining until 2014 and has continually increased since then. Current inventory is slightly lower (31 lots) compared to
May 2011.
May Pending Sale Levels
7 Year Review
Residential
Residential pending sales peaked in May 2015 (85 pending residential sales), at more than twice the May 2011 figure of 41 pending homes sales. The May 2017 pending sales figures were slightly lower, at 75 pending home sales, but still significantly higher than the 2011 trough 2015 May pending home sales.
Condominium
For the past 5 years, May pending condominium sales have been in the mid-20 rage, with the exception of May 2016, when there were 34 pending condominium sales in mid-May.
Land
Pending land sales (34 for May 2017) have almost returned to the May 2011 level of 35 pending land sales.
2017 Sales Predictions
Using the assumption that the first 4 months of 2017 is a valid predictor for the entire year.
Residential
The first four months predict there will be approximately 30 more homes sold than 2016 BUT pending sales tell a different story, so no prediction.
Condominium
The first four months predict there will be nearly as the same number of condominiums sold as in 2016 BUT pending sales tell a somewhat different story, so no prediction.
Land
Land sales have nearly returned to the 2011 levels! This is the segment of the St Croix real estate market showing the most improvement, but there is a lot of inventory to sell; the current rate of sales predicts about 20% of the inventory should sell during 2017.
Information is from MLS and deemed to be reliable, but is not guaranteed.
Prepared by:
Julie San Martin
Team Manager
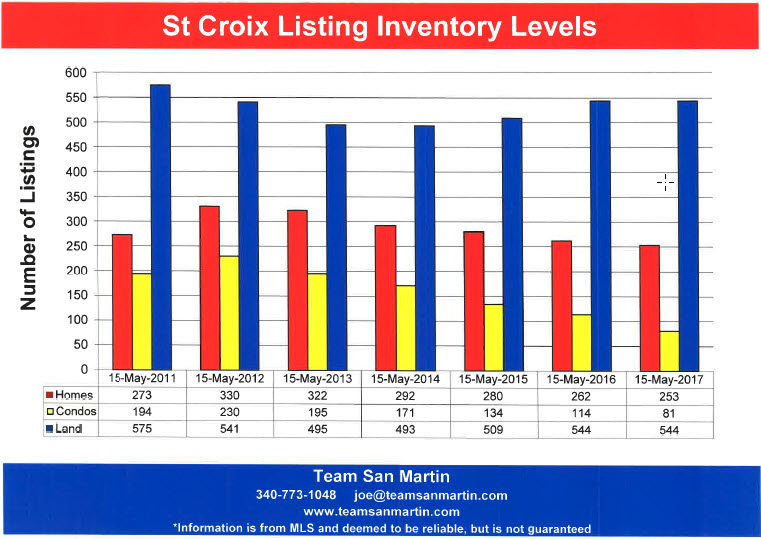
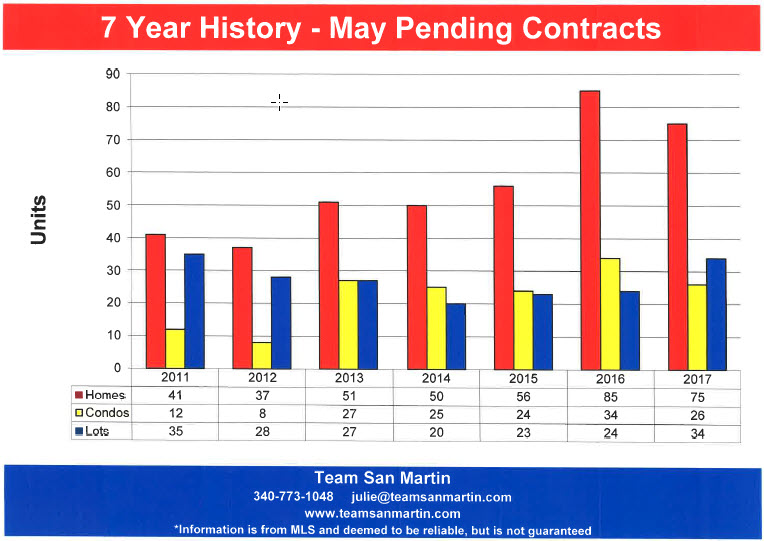
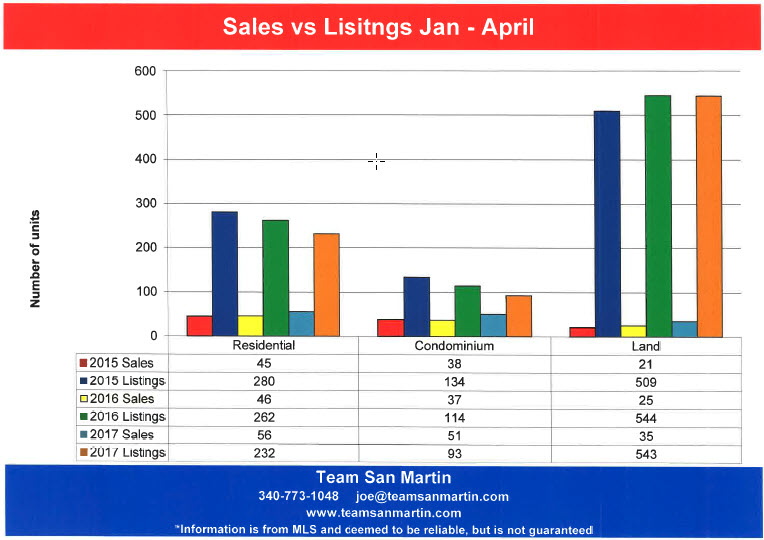
April 2017
1st Quarter Sales as Predictor for the full year
2017 is the 9th year of the St Croix real estate market “recovery” from the real estate boom years of 2006 through 2008.
The obvious question is – what do the 1st quarter statistics predict about market prospects for the rest of the year?
First, a look at inventory trends over the
9 year period:
· Residential inventory peaked in 2012, at 340 homes for sale, and has continually declined each year since. Current residential inventory levels are now lower, at 239 homes on the market, than at the beginning of the recovery in 2009, when there were 266 homes on the market.
· Condominium inventory peaked in 2010, with 265 condominiums on the market. The current level of 97 condominiums for sale is the lowest inventory level of the 9 year period.
· Land inventory also peaked in 2010, at 610 lots for sale. There was a slight decline during the 2013 to 2015 period. Inventory is slightly lower than last year, with 528 lots for sale in March 2017.
Residential Sales & 2017 Predictions
The number of units sold during the first quarter has consistently under predicted the total number of sales for the year. The average of the under prediction over the 8 year period is 20%.
The average 1st quarter sales price has, since 2012, been within 12% of the annual average sales price.
Here is the prediction for 2017 overall:
· Total number of homes sold will be slightly over 200; this would most homes sold in any year since 2002, a 15 year high!
· Average sales price will most likely be in the $350,000 range, about the same as 2016.
Condominium Sales & 2017 Predictions
This is a much smaller market, with just a few units built since the 1980s. It is more difficult to identify trends, because the sample is significantly smaller.
Since 2012, the 1st quarter units sold have underestimated the annual total number of units sold by about 13%.
1st quarter average sale price has, in most cases, overestimated the average annual condominium sales price.
Here is the prediction for 2017 overall:
· Total number of condominiums sold will be in the mid-160 unit range, based on the past 8 years. But there are fewer than 100 condominiums in the inventory – interesting!
· Average sales price will most likely be in the $190,000 range, very similar to the 1st quarter average condominium sales price.
Land Sales & 2017 Predictions
The average under prediction of total lot sales for the 9 year period is 21%. However, the predicted annual number of sales, based on 1st quarter sales, is the highest on 9 years. A sign of market recovery!
On average, over the 8 year period, 1st quarter sales prices have underestimated the annual average sales price by 6%.
Here is the prediction for 2017 overall:
· Total number of lots sold will be more than 100, for the first time in 9 years, and possibly as high as 130!
· The 2017 average lot sales price may just top $100,000, which means that “big view” lots and acreage are finally selling!
Information is from MLS and deemed to be reliable, but is not guaranteed.
Prepared by:
Julie San Martin
Team Manager
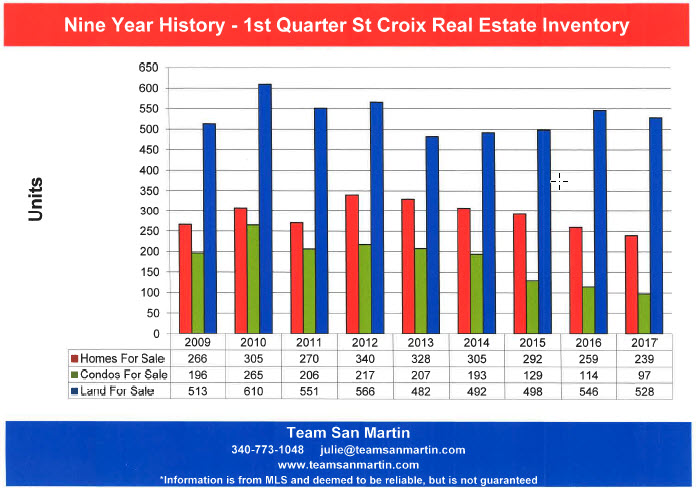
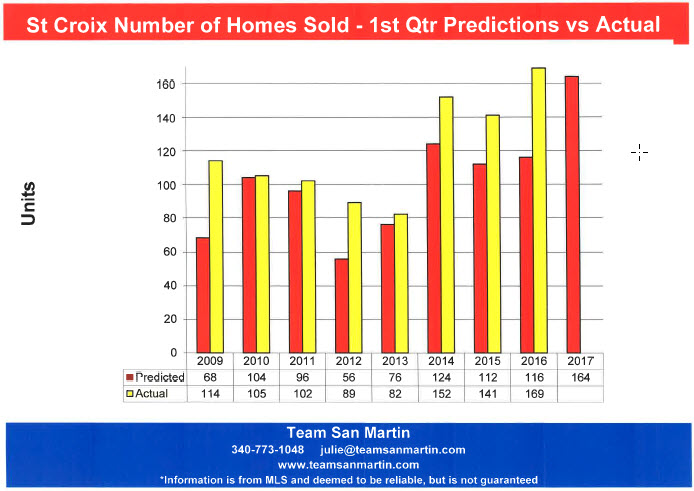
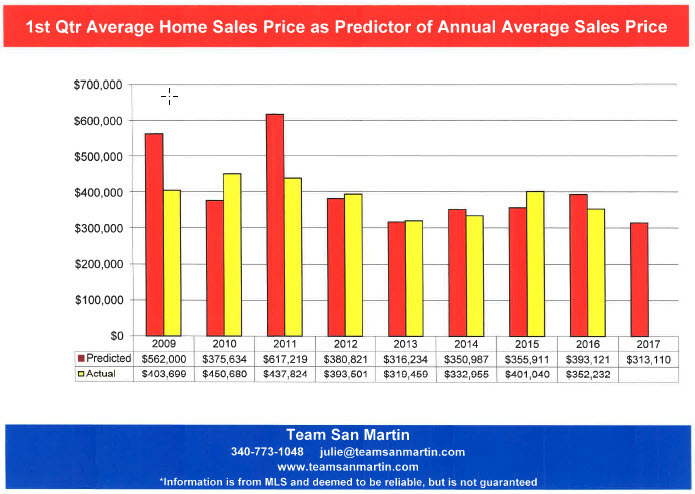
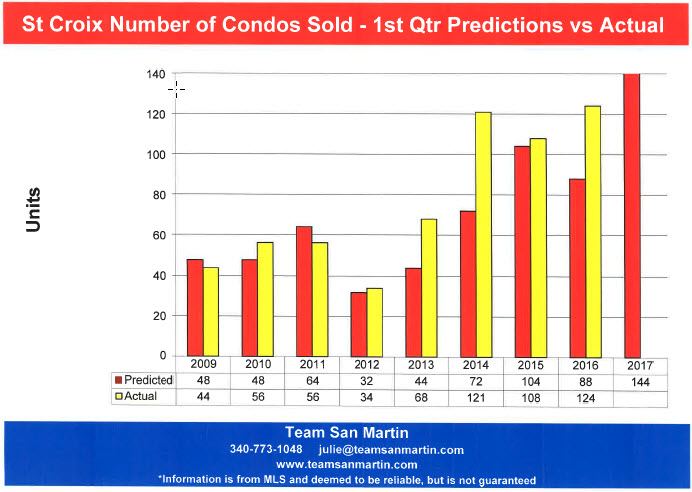
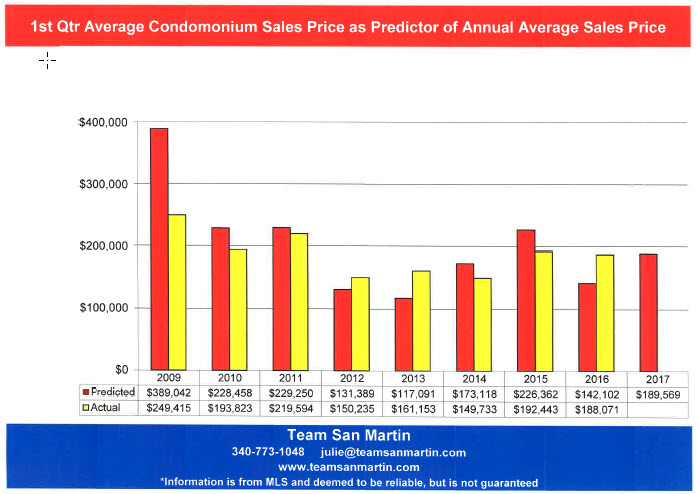
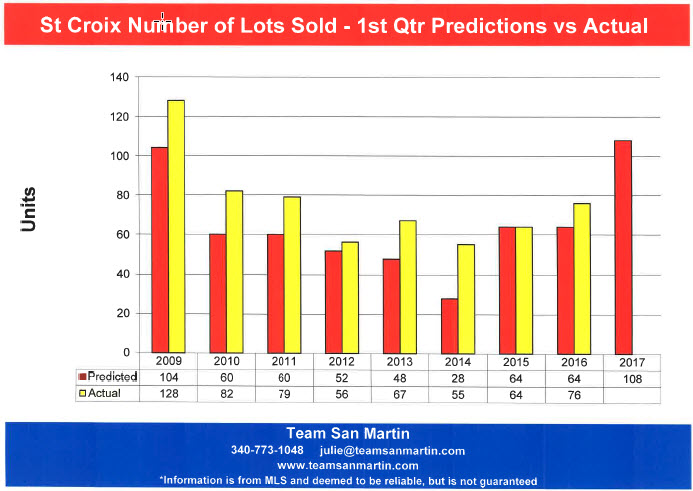
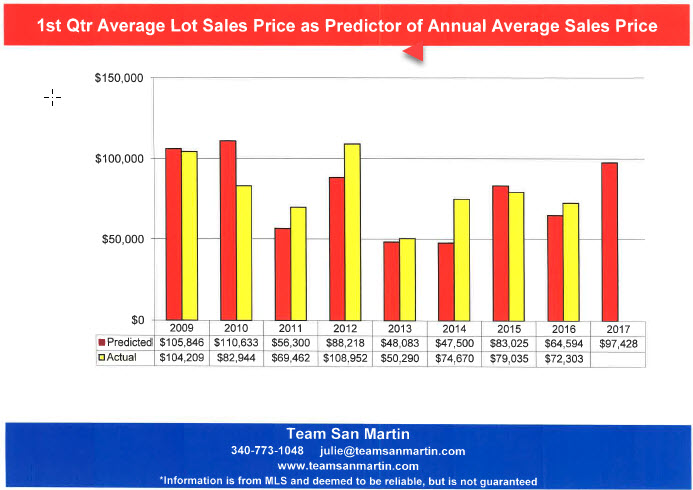
March 2017©
Home Sales
St Thomas vs St Croix
A 14 Year Look
Total Number of Properties Sold
· Over the 14 year period, more homes sold every year on St Croix than on St Thomas.
· Number of homes sold on St Thomas has been the same for the past three years (95 homes). Over the 14 year period, St Croix has seen a high of 188 homes sold (2006) and a low of 88 homes sold (2012). During 2016, 169 homes sold on St Croix; this is a 21% increase over 2015 (140 home sales) and a 2% decrease from 2003 (173 home sales).
· The most homes sold annually for both islands during this 14 year period was 2004 for St Thomas (118 homes sales) and 2006 for St Croix (188 home sales). For St Thomas, 2016 homes sales were 80% of the market high and 90% of the market high for St Croix.
Average Sales Price
· At the beginning of this 14 year period (2003), average sales prices for St Thomas and St Croix were nearly identical, at an average of $415,823.
· From 2004 until the present, the annual average home sales price on St Thomas has exceeded that of St Croix.
· For 2016, the average St Thomas homes price was 36% higher ($566,513) than the 2003 average sales price. The average annual home sales price on St Croix for 2016 was 15% lower ($352,232) than the 2003 average sales price.
· The average sale price of a home on St Croix for 2016 ($352,232) was 62% of the averages sales price of a home on St Thomas ($566,513).
Total Market in Millions of Dollars
· This measurement is a combination of total homes sold multiplied by average sales price; it gives the best overview of annual market performance.
· During this 14 year period, the total St Thomas residential market exceeded the total St Croix market during four years: 2008, 2012, 2013, 2014, and 2015. For the first time in five years, since 2012, the total St Croix residential market ($59.5 Million) exceed the total St Thomas market ($53.8 Million), by $5.7 Million.
Information is from MLS and deemed to be reliable, but is not guaranteed.
Prepared by:
Julie San Martin
Team Manager
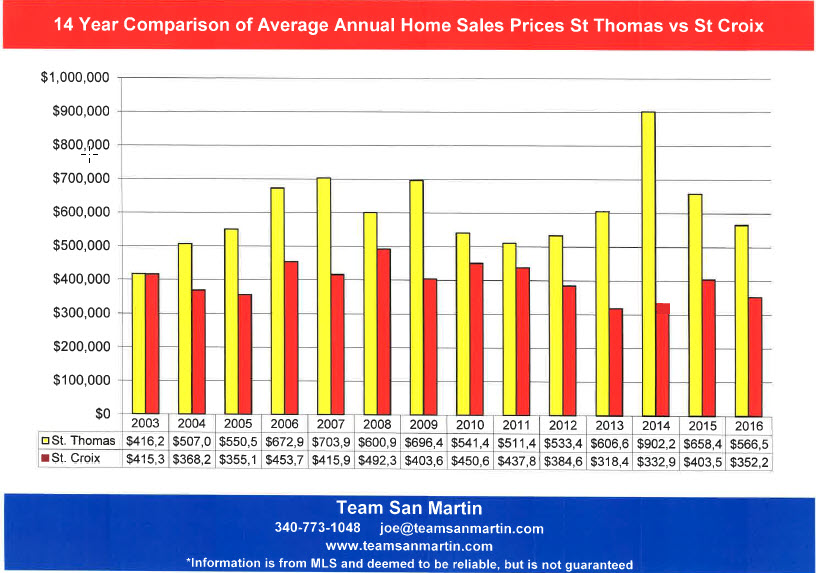
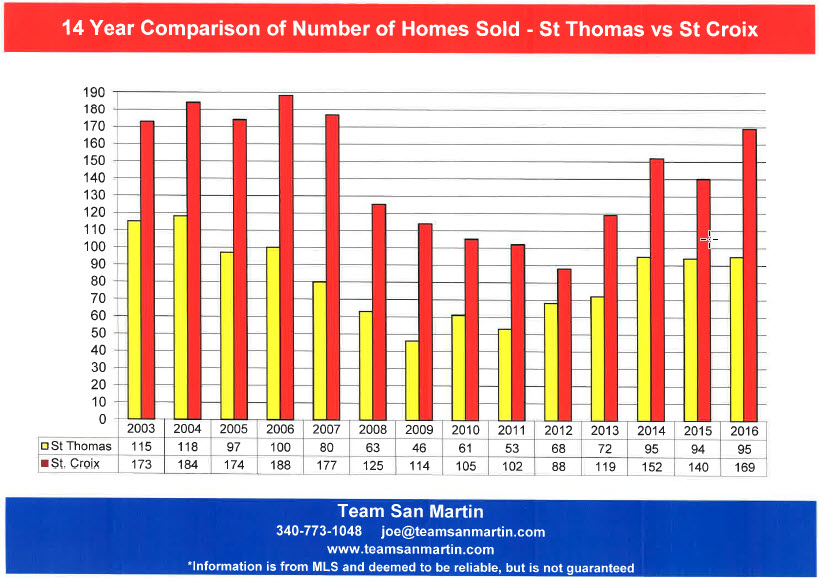
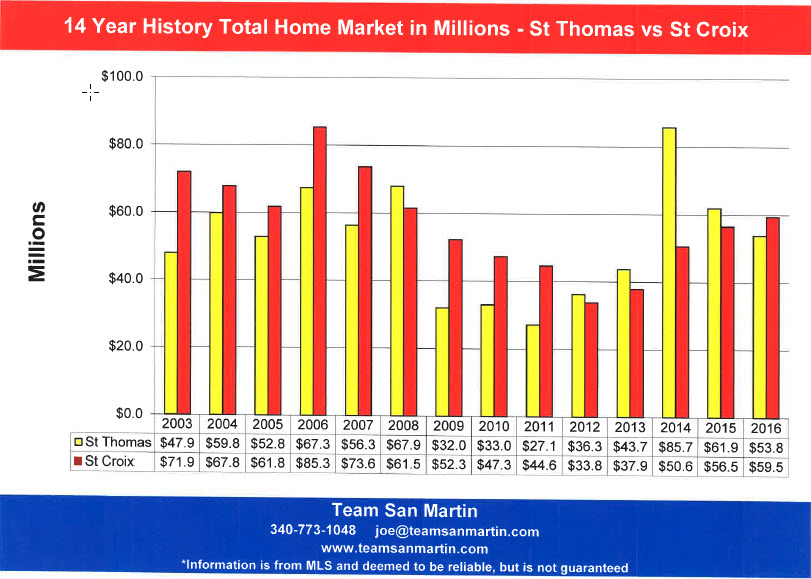
February 2017
The St Croix Real Estate Cycle
A 14 Year Look
Total Number of Properties Sold
· More homes, condominiums, and lots sold in 2016 than were sold during 2015
· Number of homes sold during 2016 (169) exceeds all years since 2007 (177 home sales).
· Number of condominiums sold during 2016 (124) exceeds all years since 2006 (162 condo sales).
· Number of lots sold during 2017 (76) exceeds all years since 2011 (79 lots sold).
Average Sales Price
· The 2016 average home sales price ($352,232) was 13% lower ($51,322) than the average home sale price for 2015 ($403,554). It was, however, an improvement over 2013 ($319,450) and 2014 ($332,950) and is very similar to the average home sale price of 2005 ($355,100).
· The 2016 average condominium sales price ($188,071) was 2% lower ($4,372) than the average condo sales price for 2015 ($192,443). It was an improvement over the 2012 – 2014 period, with an average condominium sales price of $154,000.
· Only 2011 and 2013 saw lower average lot sales prices than the average 2016 lot sales price of $72,303, which was also 8% lower ($6,732) than the average lot sales price for 2015 ($79,035).
Total Market in Millions of Dollars
· The total residential market increased by 5%, from $56.5 million for 2015 to $59.5 million for 2016. This is the largest total residential market since 2008 ($61.6 Million).
· The total condominium market increased 12%, from $20.8 million for 2015 to $23.3 million for 2016. For the previous 13 years, only 2005 ($34.7 million) and 2006 ($30.7 million) exceeded the 2016 total condominium market.
· The total land market increased 10%, from $5.0 million for 2015 to $5.5 million for 2016. This is the largest total land market since 2012 ($5.9 Million).
Information is from MLS and deemed to be reliable, but is not guaranteed.
Prepared by:
Julie San Martin
Team Manager
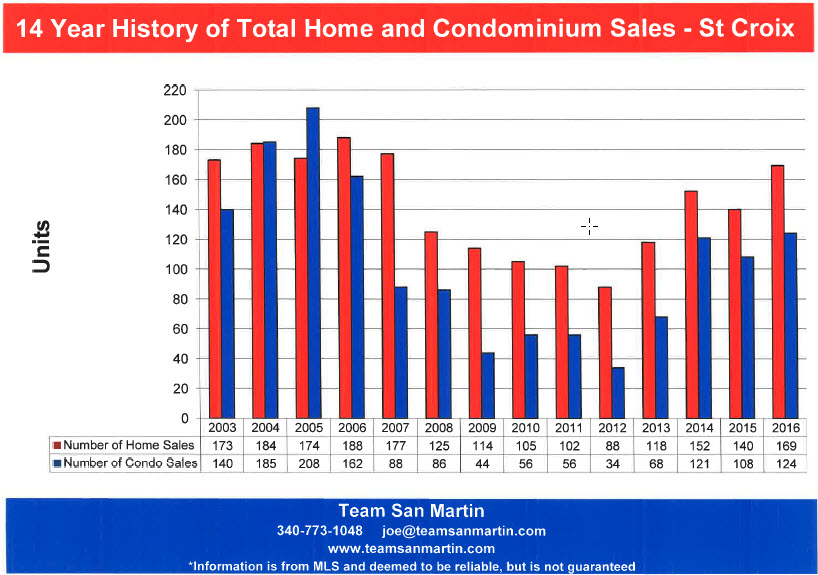
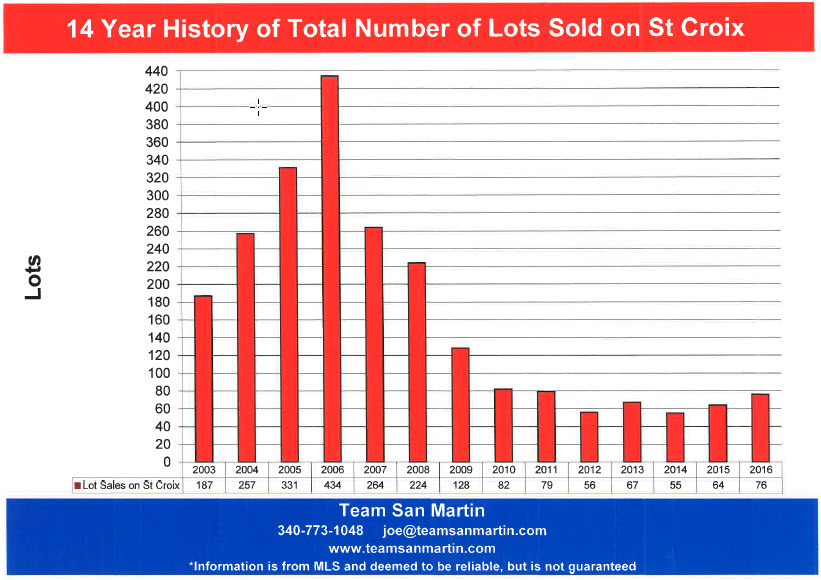
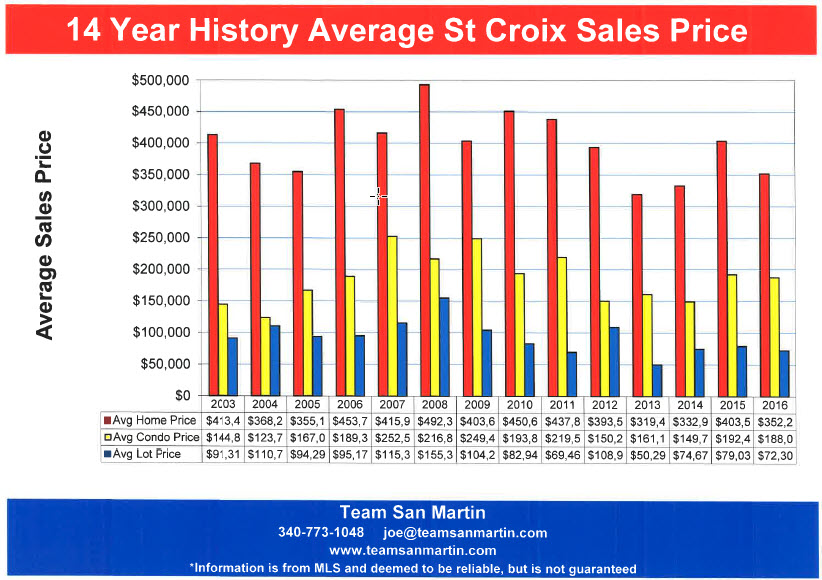
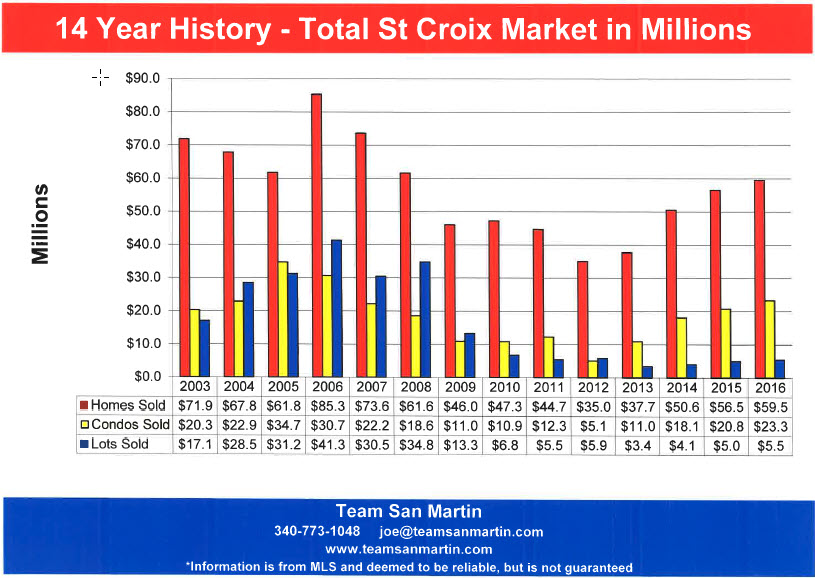
January 2017
5 Year Home Sales Price Trends ©
The average sales price of a home on St Croix has decreased by approximately $41,000 (10%) since 2012 and nearly $51,000 (13%) when comparing 2016 to 2015.
Total number of homes sold has increased by 90% (80 homes) since 2012 and by 21% (29 homes) when comparing 2016 to 2015.
All areas of the island did not perform the same.
East End B
Far East End
Compared to 5 years ago, the average sales price of a home decreased 14% ($97,217). When comparing 2016 sales figures to 2015, the average home sales price decreased 13% ($88,000).
The number of homes sold in a year has increased by 67% (8 homes) since 2012; when comparing 2016 to 2015, 5 fewer homes sold in 2016.
East End A
Christiansted East to Coakley Bay
Compared to 5 years ago, the average sales price of a home decreased 141% ($506,153); when comparing 2016 sales figures to 2015, the average home sales price decreased 39% ($225,473).
The number of homes sold in a year has tripled since 2012 (from 10 to 30); when comparing 2016 to 2015, 5 more homes sold in 2016.
Company
Christiansted West to the East Side of Judiths Fancy
Compared to 5 years ago, the average sales price of a home increased 58% ($117,862); when comparing 2016 sales figures to 2015, the average home sales price decreased 4% ($12,729).
The number of homes sold in a year has increased 60% (9 homes) since 2012; when comparing 2016 to 2015, twice as many homes sold as the previous year.
Queen
Constitution Hill West to La Reine, includes southwest
Judiths Fancy
Compared to 5 years ago, the average sales price of a home increased 6% ($15,351); when comparing 2016 sales figures to 2015, the average home sales price decreased 12% ($35,621).
The number of homes sold in a year has increased by 2 homes since 2012; when comparing 2016 to 2015, total number of homes sold increased by 4 homes.
Northside A & B
North Shore from North Judiths Fancy to Hamms Bluff
Compared to 5 years ago, the average sales price of a home increased 36% ($167,015); when comparing 2016 sales figures to 2015, the average home sales price decreased 4% ($25,909).
The number of homes sold in a year has increased 69% (9 homes) since 2012; when comparing 2016 to 2015, total number of homes sold more than doubled (from 10 homes to 22 homes).
King
South Shore from La Reine West to UVI
Compared to 5 years ago, the average sales price of a home increased 68% ($64,500); when comparing 2016 sales figures to 2015, the average home sales price increased 13% ($18,688).
Four times as many homes sold during 2016 (8 homes) as compared to 2012 (2 homes); when comparing 2016 to 2015, the same number of homes sold both years.
Prince
South Shore from UVI West to Williams Delight
Compared to 5 years ago, the average sales price of a home decreased 18% ($46,562); when comparing 2016 sales figures to 2015, the average home sales price increased 21% ($36,816).
More than twice as many homes sold during 2016 (13 homes) as compared to 2012 (5 homes); when comparing 2016 to 2015, 4 more homes sold in 2016 (13 homes) as did in 2015 (13 homes).
West End
South Shore, South from Mahogany Road,
East to Williams Delight
Compared to 5 years ago, the average sales price of a home decreased 1% ($2,625); when comparing 2016 sales figures to 2015, the average home sales price decreased 6% ($13,525).
More than twice as many homes sold during 2016 (22 homes) as compared to 2012 (10 homes); when comparing 2016 to 2015, one less home sold in 2016.
Observations
Average home sales prices in two areas of the island consistently exceed the island wide “average” home sales price:
· East End B
· Northside A & B
Average home sales prices in three areas of the island are consistently much lower than the island wide “average” home sales price:
· King
· Prince
· West End
Center island average home sales prices are about “average”:
· East End A
· Company
· Queen
More homes sold in all quarters during 2016, when compared to 2015, with the exception of:
· East End B
· West End
Compared to 2015, the island wide average home sale price decreased 13%. All quarters saw decreased average home sale price with the exception of:
· King
· Prince
Compared to 2012, these quarters saw higher average home sales prices:
· Company
· Queen
· Northside A & B
· King
Compared to 2012, these quarters saw lower average home sales prices:
· East End B
· East End A
· Prince
· West End
Information is from MLS and deemed to be reliable, but is not guaranteed.
Prepared by:
Julie San Martin
Team Manager
December 2016
Inventory Level Trends
Current Annual supply represents the number of years it will take at the current rate of sales to sell all the properties listed in a specific area (Quarter) of St Croix.
[Active Listings + Pending Listings] /
Number of Listings Sold During the Previous 12 Months
For example:
In November 2016, there were 27 active and 6 pending home sales in East End B, with 20 home sales in the previous 12 months, for a 1.7 year supply of homes for sale
[27 + 6] / 20 = 1.7 Years
East End B
Far East End
Residential
Compared to 5 years ago, home inventory has decreased by one year and average sales price is about 46% ($278,958) lower
($888,908 vs $609,950)
Compared to last year, average time on the market has increased by 6 months; average sales price has decreased by about 4% ($637,077 vs $609,950)
Condominium
Compared to 5 years ago, condominium inventory has decreased by about 19 months (2.6 years vs 1 year); average sales price has decreased by about 25% ($370,846 vs $279,538)
Compared to last year, condominium inventory is unchanged at 1 year;
average sales price has decreased by less than 1% ($281,714 vs $279,538)
Vacant Land
Compared to 5 years ago, land inventory has decreased by 1.5 years
(8.2 years vs 6.7 years); average sales price increased about 36%
($79,929 vs $108,800)
Compared to last year, land inventory decreased by about 7 months
(7.3 years vs 6.7 years); average sales price increased by about 35%
($80,787 vs $108,800)
East End A
Christiansted East to Coakley Bay
Residential
Compared to 5 years ago, home inventory has decreased by almost a year (11 months); average home sale price increased by about 18%
($307,597 vs $361,979)
Compared to last year, residential inventory has decreased by one year; average sales price decreased by about 43% ($631,295 vs $361,979)
Condominium
Compared to 5 years ago, condominium inventory has decreased by about 19 months (3 years vs 1.4 years); the average condominium sales price decreased about 8% ($242,556 vs $222,786)
Compared to last year, condominium inventory increased by about 2 months
(1.2 years vs 1.4 years); average sales price has decreased by about 8%
($242,965 vs $222,786)
Vacant Land
Compared to 5 years ago, land inventory is unchanged at 5.3 years; average lot sales price has increased by about 25% ($54,421 vs $67,900)
Compared to last year, land inventory has decreased by 7 years
(12.3 years vs 5.3 years); average lot sales price has decreased by about 28% ($93,571 vs $67,900)
Company
Christiansted West to the East Side of Judiths Fancy
Residential
Compared to 5 years ago, residential inventory has decreased by more than 5 years (7.0 years vs 1.8 years); average home sales price has increased about 21% ($275,571 vs $333,239)
Compared to last year, residential inventory has decreased by nearly 2 years (3.7 years vs 1.8 years); average home sales price has decreased about 3%
($342,409 vs $333,239)
Condominium
Compared to 5 years ago, condominium inventory has decreased by 18 months (2.3 years vs 0.8 years); average sales price increased by about 8%
($124,992 vs $135,559)
Compared to last year, condominium inventory decreased by about 10 months
(1.6 years vs 0.8 years); average sales price has increased by about 11%
($122,610 vs $135,559)
Vacant Land
Compared to 5 years ago, land inventory has increased by more than 5 years
(3.8 years vs 9.2 years); average sales price has increased to about 60%
($66,433 vs $106,500)
Compared to last year, land inventory has decreased by 7.5 years
(16.7 years vs 9.2 years) while average sales price has increased about 473% ($22,500 vs $106,500)
Queen
Constitution Hill West to La Reine, includes southwest
Judiths Fancy
Residential
Compared to 5 years ago, residential inventory has decreased by about 2 months (2.9 years vs 2.7 years) while average sales priced decreased by about 30%
($427,342 vs $296,020)
Compared to last year, residential inventory has decreased by about 2 months (2.9 years vs 2.7 years); average sales price increased by about 17%
($253,171 vs $296,020)
Condominium
Compared to 5 years ago, condominium inventory has decreased by nearly 6 years (6.8 years vs 1 year); average condominium sales price decreased by about 4% ($102,250 vs $98,462)
Compared to last year, condominium inventory has increased by about 4.7 years (5.7 years vs 1 year); average sales price has increased about 11%
($88,333 vs $98,462)
Vacant Land
Compared to 5 years ago, land inventory has increased by 4 years
(16.2 years vs 20.3 years); average lot sales price has increased by about 19% ($61,000 vs $72,625)
Compared to last year, land inventory has increased by 12.5 years
(7.8 years vs 20.3 years); the average lot sales price increased about 92%
($37,889 vs $72,625)
Northside A & B
North Shore from North Judiths Fancy to Hamms Bluff
Residential
Compared to 5 years ago, residential inventory has decreased by more than 2 years
(3.3 years vs 1.29 years); average home sales price increased by about 14%
($592,312 vs $677,762)
Compared to last year, residential inventory decreased by about 1.5 years
(2.9 years vs 1.2 years); average home sales price has increased about 28%
($529,444 vs $677,762)
Condominium
Compared to 5 years ago, condominium inventory decreased by nearly 4.5 years (4.7 years vs 0.3 years); average sales price has decreased by about 37% ($440,000 vs $276,125)
Compared to last year, condominium inventory decreased by 6 months
(0.8 years vs 0.3 years); average sales price increased by about 15%
($239,670 vs $276,125)
Vacant Land
Compared to 5 years ago, land inventory has decreased by almost 7 years
(14 years vs 7.2 years); average lot sales price increased by about 12%
($59,333 vs $66,667)
Compared to last year, land inventory has increased by 3.3 years
(3.9 years vs 7.2 years); average lot sales price has decreased by about 32%
($98,671 vs $66,667)
King
South Shore from La Reine West to UVI
Residential
Compared to 5 years ago, residential inventory has decreased by about 20 months
(4 years vs 2.3 years); average home sales price also decreased by about 36%
($247,800 vs $159,250)
Compared to last year, residential inventory has increased by about 4 months
(2 years vs 2.3 years); average residential sales price increased by about 24% ($128,833 vs $159,250)
Condominium
There are no condominium complexes in King Quarter
Vacant Land
5 years ago, no land sales were reported in King Quarter during the 12 month period ending November 2011.
Compared to last year, land inventory increased by 3 years (4 years vs 7 years);
average lot sales price has decreased about 45% ($76,667 vs $42,500)
Prince
South Shore from UVI West to Williams Delight
Residential
Compared to 5 years ago, there is about 2 months more residential inventory
(2.6 years vs 2.4 years); the average residential sales price decreased about 12% ($239,519 vs $210,846)
Compared to last year, residential inventory decreased by nearly a year
(3.3 years vs 2.4 years); average residential sales price increased by about 20%
($176,056 vs $210,846)
Condominium
Compared to 5 years ago, condominium inventory has decreased by 2 years (3.7 years vs 1.8 years); average condominium sales price decreased by about 41% ($288,333 vs $170,625)
Compared to last year, condominium inventory has increased by 6 months
(1.3 years vs 1.8 years); average condominium sale price decreased by about 16% ($202,000 vs $170,625)
Vacant Land
Compared to 5 years ago, land inventory has increased by 6 months
(9.3 years vs 9.8 years); average lot sales price has decreased by about 48%
($50,714 vs $26,249)
Compared to last year, land inventory has decreased by more than 5 years
(4.5 years vs 9.8 years); average lot sales price has decreased by about 63%
($70,985 vs $26,249)
West End
South Shore, South from Mahogany Road,
East to Williams Delight
Residential
Compared to 5 years ago, residential inventory has decreased by about 16 months (2.9 years vs 1.6 years); average home sale price has increased by about 28% ($157,512 vs $200,875)
Compared to last year, residential inventory has decreased by about 5 months
(2 years vs 1.6 years); average home sale price decreased by about 10%
($223,800 vs $200,875)
Condominium
Compared to 5 years ago, condominium inventory has increased by 20 months (2.3 years vs 4 years); average condominium sale price increased by about 18% ($146,250 vs $172,500)
Compared to last year, condominium inventory increased by about 3.6 year
(5 months vs 4 years); average condominium sales price increased by about 60% ($107,714 vs $172,500)
Vacant Land
Compared to 5 years ago, land inventory has decreased by 1.4 years
(10.9 years vs 9.5 years); average lot sales price has increased by about 92% ($32,222 vs $61,750)
Compared to last year, land inventory decreased by about 6 years
(15.6 years vs 9.5 years); average lot sales price decreased by about 34%
($93,279 vs $61,750)
Information is from MLS and deemed to be reliable, but is not guaranteed.
Prepared by:
Julie San Martin
Team Manager
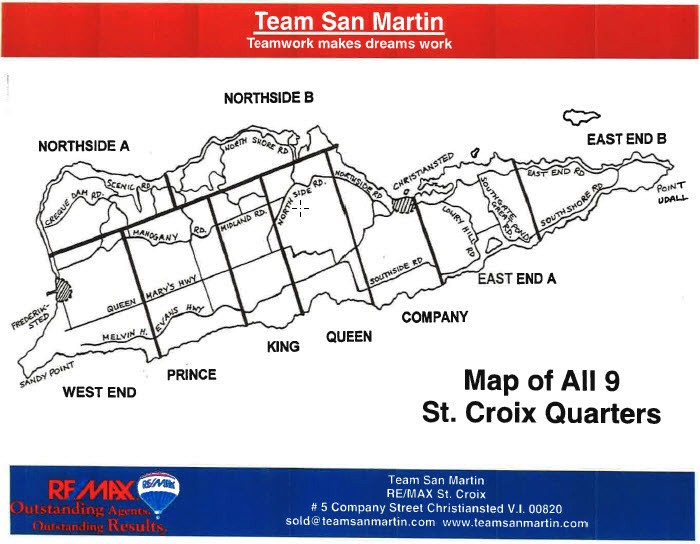
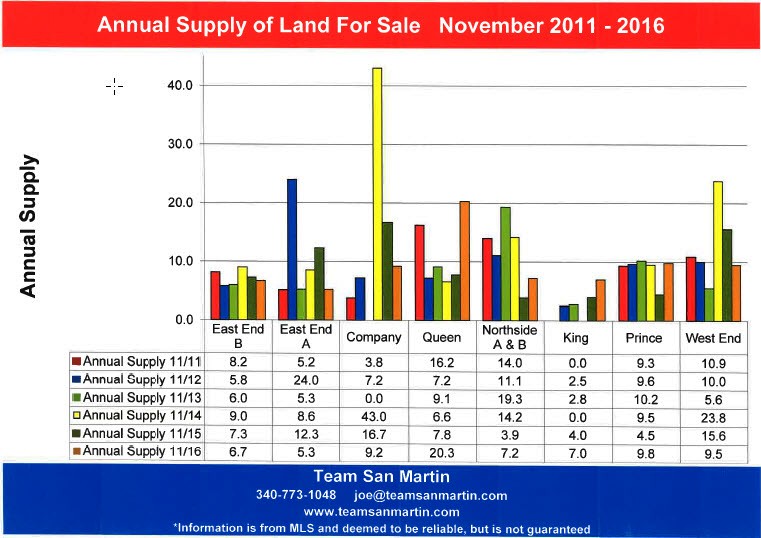
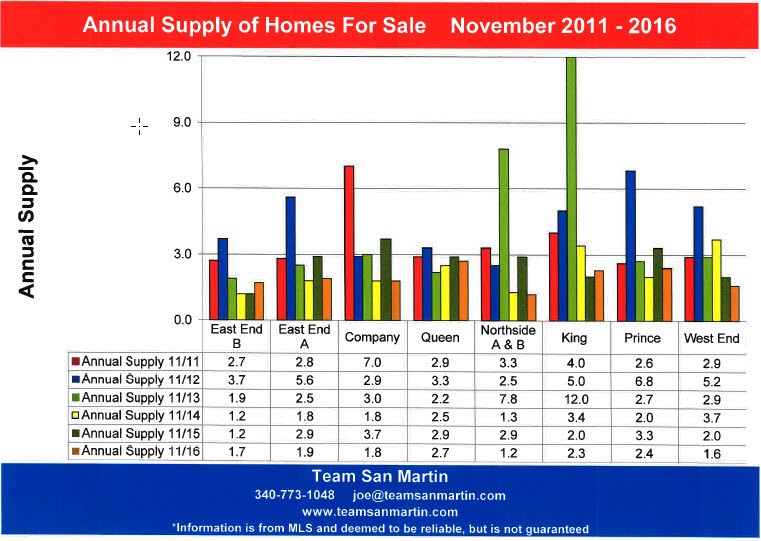
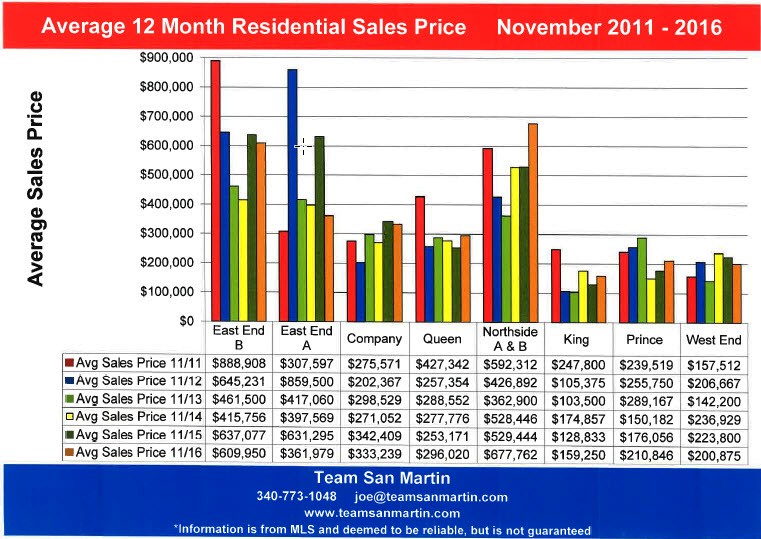
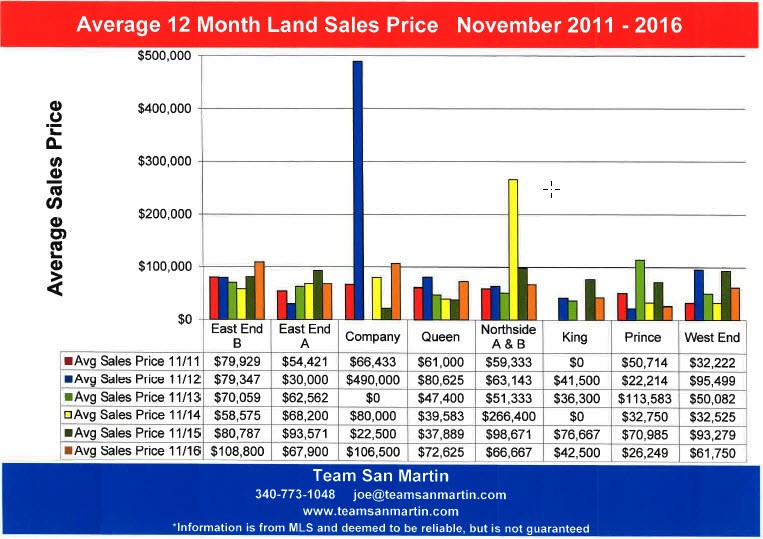
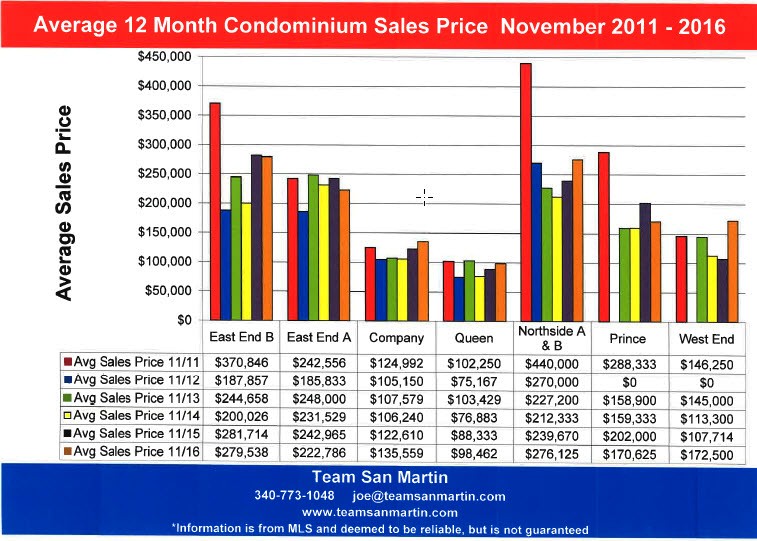
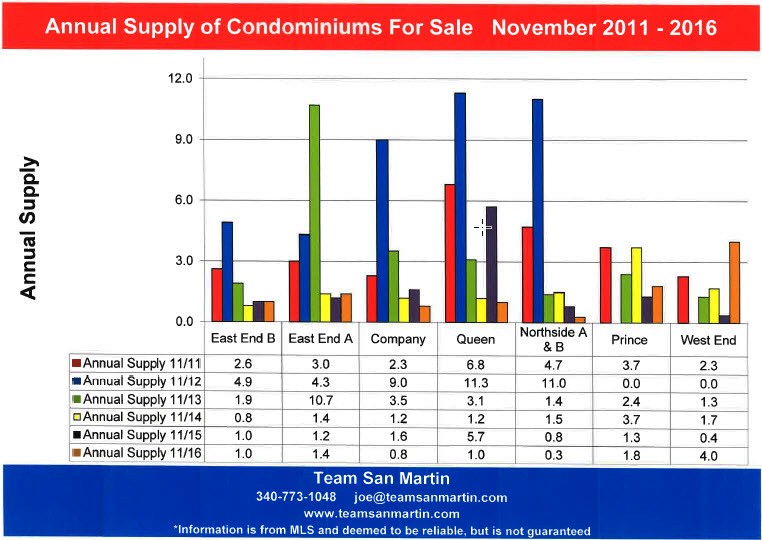
November 2016
Which St Croix Price Ranges are Selling?
First 10 months of 2014, 2105 and 2016
Residential
2014
134 home sales closed January through October; there were 308 homes for sale
2.3 sellers for every buyer
2015
111 home sales closed January through October; there were 273 homes for sale
2.5 sellers for every buyer
2016
143 home sales closed January through October; there were 240 homes for sale
1.7 sellers for every buyer
Condominium
2014
101 condominium sales closed January - October; there were 154 condos for sale
1.5 sellers for every buyer
2015
88 condominium sales closed January - October; there were 127 condos for sale
1.4 sellers for every buyer
2016
106 condominium sales closed January - October; there were 79 condos for sale
0.75 sellers for every buyer; condos are selling in less than 1 year on the market
Vacant Land
37 land sales closed January through October; there were 522 lots for sale
14.1 sellers for every buyer
2015
62 land sales closed January through October; there were 490 lots for sale
7.9 sellers for every buyer
2016
64 land sales closed January through October; there were 551 lots for sale
8.6 sellers for every buyer
SALES BY PRICE RANGE
Residential
|
2016 % of Sales |
2016 Sales |
2015 % of Sales |
2015 Sales |
2014 % of Sales |
2014 Sales |
Sales Price |
|
41% |
58 |
41% |
45 |
31% |
42 |
Under $200K |
|
31% |
45 |
31% |
34 |
36% |
48 |
$200K - $400K |
|
14% |
20 |
13% |
14 |
18% |
24 |
$400K - $600K |
|
6% |
8 |
9% |
10 |
10% |
14 |
$600K - $800K |
|
5% |
7 |
3% |
3 |
3% |
4 |
$800K - $1 Million |
|
3% |
5 |
5% |
5 |
1% |
2 |
Over $1 Million |
Condominium
|
2016 % of Sales |
2016 Sales |
2015 % of Sales |
2015 Sales |
2014 % of Sales |
2014 Sales |
Sales Price |
|
26% |
28 |
23% |
20 |
38% |
38 |
Under $100K |
|
40% |
42 |
45% |
39 |
43% |
43 |
$100K - $200K |
|
19% |
20 |
17% |
15 |
13% |
13 |
$200K - $300K |
|
13% |
14 |
13% |
11 |
6% |
6 |
$300K - $500K |
|
2% |
2 |
4% |
3 |
1% |
1 |
Over $500K |
Vacant Land
|
2016 % of Sales |
2016 Sales |
2015 % of Sales |
2015 Sales |
2014 % of Sales |
2014 Sales |
Sales Price |
|
48% |
31 |
52% |
32 |
68% |
25 |
Under $50K |
|
30% |
19 |
23% |
14 |
22% |
8 |
$50K - $100K |
|
20% |
13 |
21% |
13 |
8% |
3 |
$100K - $300K |
|
2% |
1 |
5% |
3 |
3% |
1 |
Over $300K |
Information is from MLS and deemed to be reliable, but is not guaranteed.
Prepared by:
Julie San Martin
Team Ma
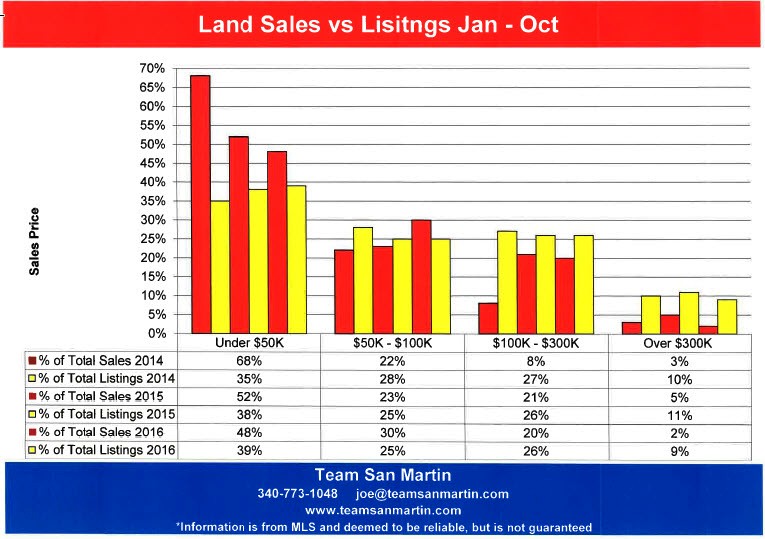
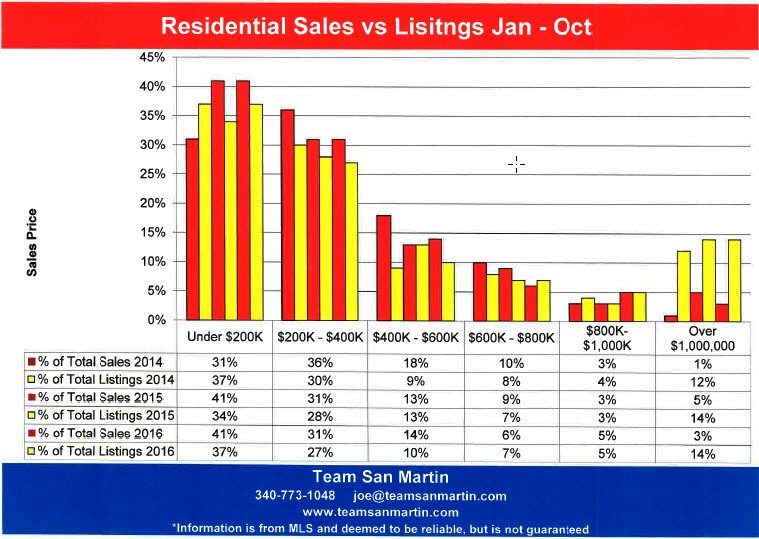
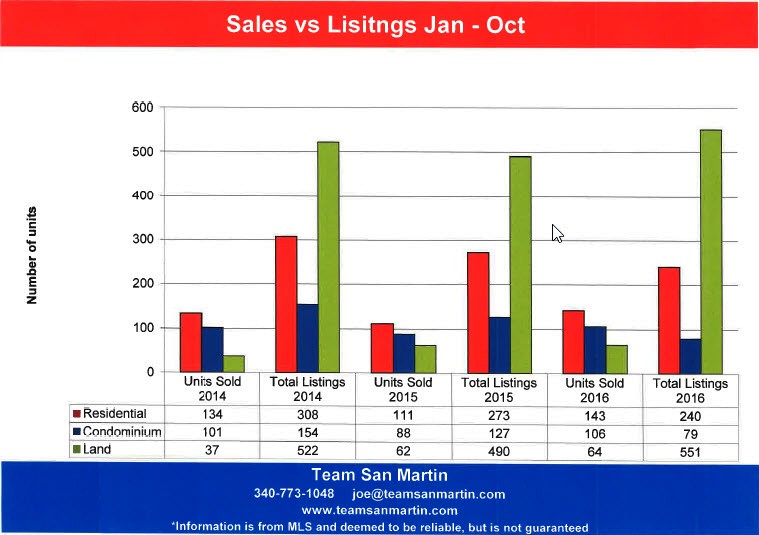
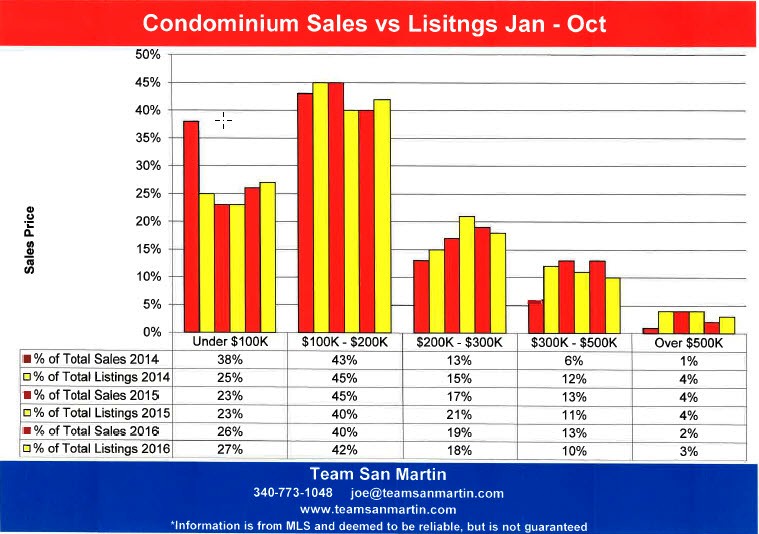
October 2016
Seven Year Comparison
St Croix Real Estate Inventory Levels
TOTAL INVENTORY
Residential
Slightly lower (15 homes) than seven years ago.
Highest inventory during this period was 9/15/12 with 336 homes on the market (34% higher than 9/15/16)
Condominium
GIGANTIC decrease over the seven year period!
Seven years ago, there were nearly three times as many condominiums on the market (236) as were for sale on 9/15/16 (81)
Vacant Land
Slightly lower (40 lots) than seven years ago.
Land inventory has varied little over the seven year period, with the lowest inventory level on 9/15/14 (489 lots)
INVENTORY BY PRICE RANGE
Residential
Under $200,000 listings have nearly tripled (from 13% to 37%) as percentage of total inventory, compared to seven years ago.
$200,000 to $400,000 listings are nearly unchanged as percentage of total inventory, at about 28%, compared to seven years ago.
$400,000 to $600,000 listings decreased by 4% of the total inventory over the seven year period.
$600,000 to $800,000 listings have decreased by more than 50% over the seven year period, from 15% in 2009 to 7% in 2016.
$800,000 to $1,000,000 have decreased by 50% over the seven year period, from 8% on 9/15/09 to 4% on 9/15/16.
Listings over $1,000,000 have decreased by 7% of the total inventory over the seven year period, from 20% on 9/15/09 to 13% on 9/15/16.
Condominium
Under $100,000 listings more than doubled (from 11% to 25%) as percentage of total inventory, compared to seven years ago.
$100,000 to $200,000 listings are unchanged as percentage of total inventory, at about 46%, compared to seven years ago.
$200,000 to $300,000 listings are also unchanged as percentage of total inventory, at about 16%, compared to seven years ago.
$300,000 to $500,000 listings have decreased by 6%, from 17% to 11%, compared to seven years ago.
Listings over $500,000 have decreased by 5% of the total inventory over the seven year period, from 8% on 9/15/09 to 3% on 9/15/16.
Vacant Land
Under $50,000 listings have nearly doubled (from 21% to 38%) as percentage of total inventory, compared to seven years ago.
$50,000 to $100,000 listings have decreased by 4% as percentage of total inventory, from 30% to 26%, compared to seven years ago.
$100,000 to $300,000 listings have decreased by 6%, from 33% to 27%, compared to seven years ago.
Listings over $300,000 have decreased by 7% of the total inventory over the seven year period, from 16% on 9/15/09 to 9% on 9/15/16.
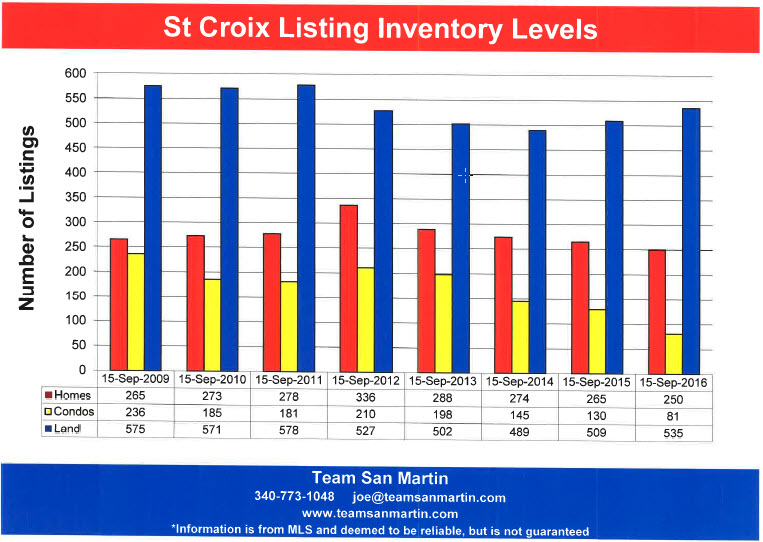
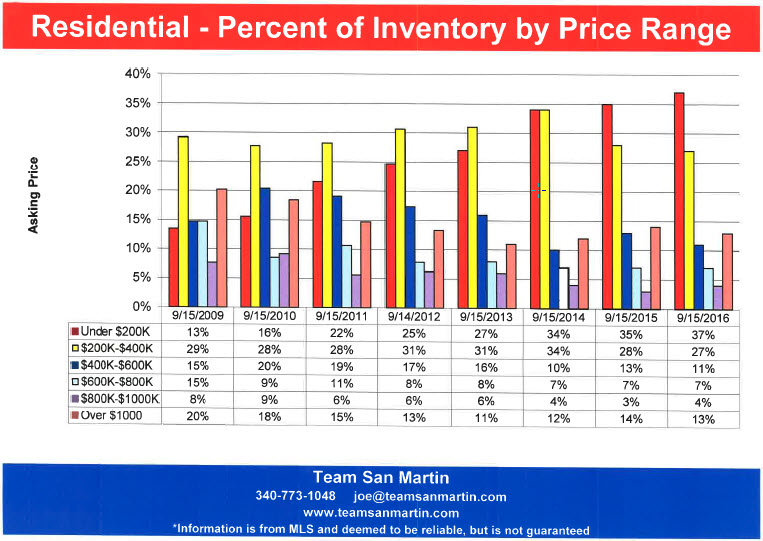

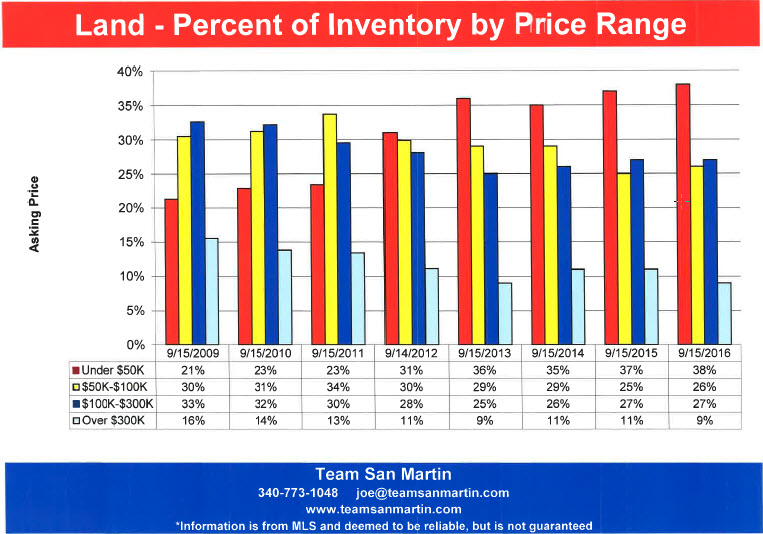
Information is from MLS and deemed to be reliable, but is not guaranteed.
Prepared by:
Julie San Martin
Team Manager
September 2016
A Tale of Two Islands
St Croix and St Thomas Real Estate Sales
Four Year Comparison Year to Date
Number of Sales
Residential
Both islands experienced a similar phenomenon, a significant increase in the number of units sold in 2014, a return to nearly the 2013 figure the next year (2015), then an increase of about 1/3 for total units sold during this period in 2016
|
% increase (decrease) |
St Croix |
% increase (decrease) |
St Thomas |
Number of Homes Sold |
|
|
82 |
|
46 |
Jan – Aug 2013 |
|
+39% |
114 |
+46% |
67 |
Jan – Aug 2014 |
|
(-25%) |
85 |
(-19%) |
54 |
Jan – Aug 2015 |
|
+38% |
117 |
+37% |
74 |
Jan – Aug 2016 |
Condominium
Very similar to the home market for both islands except the reduction in units sold during this period in 2015 was not as severe as experienced by the housing market.
|
% increase (decrease) |
St Croix |
% increase (decrease) |
St Thomas |
Number of Condos Sold |
|
|
54 |
|
52 |
Jan – Aug 2013 |
|
+52% |
82 |
+35% |
70 |
Jan – Aug 2014 |
|
(-16%) |
69 |
(-6%) |
66 |
Jan – Aug 2015 |
|
+16% |
80 |
+38% |
91 |
Jan – Aug 2016 |
Vacant Land
Vacant land is not selling well on either island. During this period in 2014, exactly the same number of lots were sold on both islands – this was a significant up tick for St Thomas and a big down tick for St Croix. For 2016, the number of lots sold on St Thomas has decreased to nearly the 2013 level, while St Croix, with a much larger inventory, continues to slowly increase the number of lots sold.
|
% increase (decrease) |
St Croix |
% increase (decrease) |
St Thomas |
Number of Lots Sold |
|
|
41 |
|
21 |
Jan – Aug 2013 |
|
(-27%) |
30 |
+43% |
30 |
Jan – Aug 2014 |
|
+57% |
47 |
+27% |
38 |
Jan – Aug 2015 |
|
+15% |
54 |
(-29%) |
27 |
Jan – Aug 2016 |
Average Sales Price
Residential
Comparatively, St Croix has performed better than St Thomas, but we still have a long way to go; the average home sale price on St Thomas is nearly twice that of St Croix.
|
% increase (decrease) |
St Croix |
% increase (decrease) |
St Thomas |
Average Home Sales Price |
|
|
$287,762 |
|
$665,130 |
Jan – Aug 2013 |
|
+16% |
$332,572 |
+16% |
$772,334 |
Jan – Aug 2014 |
|
+28% |
$426,719 |
(-11%) |
$689,658 |
Jan – Aug 2015 |
|
(-18%) |
$350,076 |
(-14%) |
$594,317 |
Jan – Aug 2016 |
St Thomas Home Sales Prices
|
|
Lowest |
Highest |
|
Jan – Aug 2013 |
$100,000 |
$3,300,000 |
|
Jan – Aug 2014 |
$34,000 |
$4,400,000 |
|
Jan – Aug 2015 |
$85,000 |
$6,000,000 |
|
Jan – Aug 2016 |
$49,000 |
$2,990,000 |
St Croix Home Sales Prices
|
|
Lowest |
Highest |
|
Jan – Aug 2013 |
$35,000 |
$800,000 |
|
Jan – Aug 2014 |
$35,000 |
$1,680,000 |
|
Jan – Aug 2015 |
$31,000 |
$6,250,000 |
|
Jan – Aug 2016 |
$40,000 |
$2,500,000 |
The median sales price is the midpoint - half of all homes sold for more than this price, half sold for less. For both islands, the median decreased over the 4 year period, with a much smaller decrease for St Thomas homes (about $22,000). On St Croix, the median home sale price decreased by $50,000 over the 4 year period.
Median Home Sales Price
|
% increase (decrease) |
St Croix |
% increase (decrease) |
St Thomas |
Median Home Sales Price |
|
|
$270,000 |
|
$515,000 |
Jan – Aug 2013 |
|
+11% |
$299,000 |
(-5%) |
$490,000 |
Jan – Aug 2014 |
|
(-15%) |
$255,000 |
No change |
$492,000 |
Jan – Aug 2015 |
|
(-14%) |
$220,000 |
No change |
$492,500 |
Jan – Aug 2016 |
Average Sales Price
Condominium
Average condominium sales price held steady on St Thomas for 3 years, then saw a very nice increase of nearly $50,000 per unit for the first 8 months of 2016. Sadly, on St Croix the average condominium sales price is now slightly lower than it was 4 years ago.
|
% increase (decrease) |
St Croix |
% increase (decrease) |
St Thomas |
Average condo Sales Price |
|
|
$169,563 |
|
$223,604 |
Jan – Aug 2013 |
|
(-8%) |
$155,356 |
(-2%) |
$219,512 |
Jan – Aug 2014 |
|
+30% |
$202,402 |
+3% |
$227,064 |
Jan – Aug 2015 |
|
(-17%) |
$168,023 |
+21% |
$274,901 |
Jan – Aug 2016 |
St Thomas Condominium Sales Prices
|
|
Lowest |
Highest |
|
Jan – Aug 2013 |
$38,000 |
$550,000 |
|
Jan – Aug 2014 |
$39,000 |
$770,000 |
|
Jan – Aug 2015 |
$55,000 |
$940,000 |
|
Jan – Aug 2016 |
$30,000 |
$1,690,000 |
St Croix Condominium Sales Prices
|
|
Lowest |
Highest |
|
Jan – Aug 2013 |
$40,000 |
$545,000 |
|
Jan – Aug 2014 |
$30,000 |
$775,000 |
|
Jan – Aug 2015 |
$22,500 |
$1,150,000 |
|
Jan – Aug 2016 |
$22,500 |
$700,000 |
The median condominium sales price has increased steadily, except for a small decease in 2014. On St Croix, the median condominium sales price is now nearly $10,000 less than 4 years ago, even though 2015 showed great promise.
Median Condominium Sales Price
|
% increase (decrease) |
St Croix |
% increase (decrease) |
St Thomas |
Median Condo Sales Price |
|
|
$144,500 |
|
$173,750 |
Jan – Aug 2013 |
|
(-18%) |
$119,125 |
(-5%) |
$165,000 |
Jan – Aug 2014 |
|
+26% |
$150,000 |
+9% |
$180,000 |
Jan – Aug 2015 |
|
(-10%) |
$135,000 |
+21% |
$218,000 |
Jan – Aug 2016 |
Average Sales Price
Vacant Land
The worst performing segment of our real estate market has mirrored the home market with the exception that the average sale price is now nearly twice that of 4 years ago, for both islands.
|
% increase (decrease) |
St Croix |
% increase (decrease) |
St Thomas |
Average lot Sales Price |
|
|
$43,425 |
|
$108,357 |
Jan – Aug 2013 |
|
+85% |
$80,162 |
+16% |
$126,172 |
Jan – Aug 2014 |
|
(-3%) |
$78,055 |
(-26%) |
$91,737 |
Jan – Aug 2015 |
|
(-2%) |
$76,518 |
+97% |
$181,144 |
Jan – Aug 2016 |
St Thomas Land Sales Prices
|
|
Lowest |
Highest |
|
Jan – Aug 2013 |
$35,000 |
$250,000 |
|
Jan – Aug 2014 |
$15,000 |
$900,000 |
|
Jan – Aug 2015 |
$20,000 |
$370,000 |
|
Jan – Aug 2016 |
$8,000 |
$900,000 |
St Croix Land Sales Prices
|
|
Lowest |
Highest |
|
Jan – Aug 2013 |
$10,000 |
$120,000 |
|
Jan – Aug 2014 |
$8,000 |
$370,000 |
|
Jan – Aug 2015 |
$13,000 |
$348,000 |
|
Jan – Aug 2016 |
$16,000 |
$335,000 |
Median Land Sales Price
St Croix is performing better than St Thomas, but the median lot sale price is still only about 2/3 that of St Thomas
|
% increase (decrease) |
St Croix |
% increase (decrease) |
St Thomas |
Median Lot Sales Price |
|
|
$34,500 |
|
$84,500 |
Jan – Aug 2013 |
|
+14% |
$39,500 |
+1% |
$85,000 |
Jan – Aug 2014 |
|
+1% |
$40,000 |
(-35%) |
$55,000 |
Jan – Aug 2015 |
|
+64% |
$65,500 |
+78% |
$98,000 |
Jan – Aug 2016 |
Total Market (Millions)
Both island have shown a steady improvement in all market segments over the 4 year period, although the 2014 and 2015 figures for St Thomas saw a big increase for 2014, followed by a dip in 2015, but is now improving nicely, particularly the St Thomas condominium market!
Residential
|
% increase (decrease) |
St Croix |
% increase (decrease) |
St Thomas |
Number of Homes Sold |
|
|
$23.6 |
|
$30.6 |
Jan – Aug 2013 |
|
+61% |
$37.9 |
+69% |
$51.7 |
Jan – Aug 2014 |
|
(-4%) |
$36.3 |
(-28%) |
$37.2 |
Jan – Aug 2015 |
|
+13% |
$41.0 |
+18% |
$44.0 |
Jan – Aug 2016 |
Condominium
|
% increase (decrease) |
St Croix |
% increase (decrease) |
St Thomas |
Number of Condos Sold |
|
|
$9.2 |
|
$11.6 |
Jan – Aug 2013 |
|
+38% |
$12.7 |
+33% |
$15.4 |
Jan – Aug 2014 |
|
+10% |
$14.0 |
(-3%) |
$15.0 |
Jan – Aug 2015 |
|
(-4%) |
$13.4 |
+67% |
$25.0 |
Jan – Aug 2016 |
Vacant Land
|
% increase (decrease) |
St Croix |
% increase (decrease) |
St Thomas |
Number of Lots Sold |
|
|
$1.8 |
|
$2.3 |
Jan – Aug 2013 |
|
+33% |
$2.4 |
+65% |
$3.8 |
Jan – Aug 2014 |
|
+54% |
$3.7 |
(-8%) |
$3.5 |
Jan – Aug 2015 |
|
+11% |
$4.1 |
+40% |
$4.9 |
Jan – Aug 2016 |
Information is from MLS and deemed to be reliable, but is not guaranteed.
Prepared by:
Julie San Martin
Team Manager
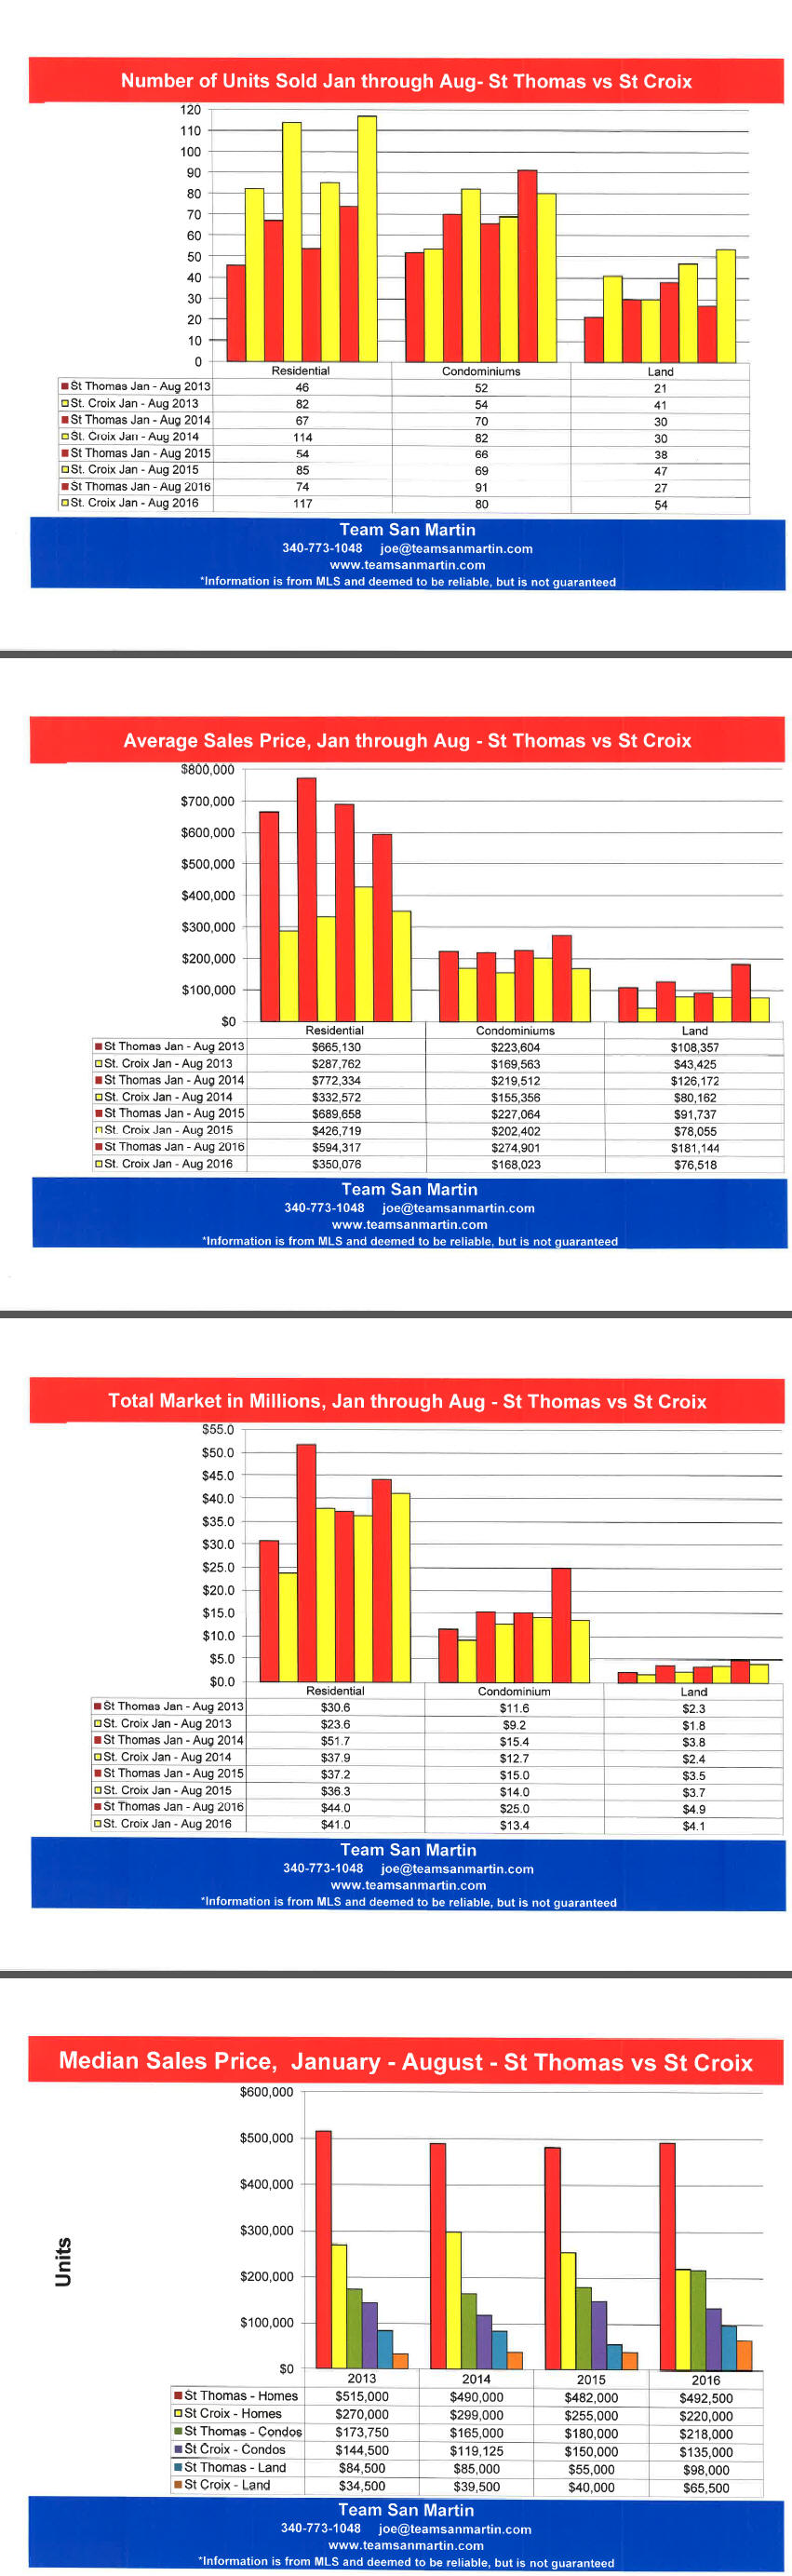
August 2016
Sales Price and Marketing Time on St Croix
“Annual Supply” represents the number of years it will take at the current annual rate of sales to sell all the properties for sale
in a specific area.
East End B
Far East End
Inventory
Four years ago (July 2012), there was a 4.7 year supply of homes and a 4.3 year supply of condominiums on the market.
For both homes and condominiums, the inventory has decreased by 3 years, to a 1.2 year supply of homes and a 1.4 year supply of condominiums.
Average Sales Price
For both homes and condominiums, the average sales price has decreased, compared to four years ago.
Average home sale price decreased by 3% over the four year period, from $575,667 for the 12 months ending July 2012 to $558,212 for the 12 months ending July 2016.
Condominiums saw a larger average sale price decrease of 37%, from $382,500 for the 12 months ending July 2012 to $239,298 for the 12 months ending July 2016.
East End A
Christiansted east to Coakley Bay
Inventory
Four years ago (July 2012), there was a 4.2 year supply of homes and a 4.8 year supply of condominiums on the market.
For both homes and condominiums, the inventory has decreased by 3 years, to a 1.4 year supply of homes and a 1.5 year supply of condominiums.
Average Sales Price
For homes, the average sales price has decreased, compared to four years ago. For condominiums, the average sale price increased slightly.
Average home sale price decreased by 8% over the four year period, from $481,712 for the 12 months ending July 2012 to $392,706 for the 12 months ending July 2016.
Condominiums saw a 4% increase in average sales price, from $204,667 for the 12 months ending July 2012 to $213,825 for the 12 months ending July 2016.
Company
Christiansted west to east side of Judiths Fancy
Inventory
Four years ago (July 2012), there was a 3.1 year supply of homes and an 8.3 year supply of condominiums on the market.
For homes, the inventory increased slightly, to a 3.6 year supply of homes. For condominiums, the supply decreased by more than 7 years to a 1.1 year supply of condominiums.
Average Sales Price
For both homes and condominiums, the average sales price increased, compared to four years ago.
Average home sale price increased 15% over the four year period, from $191,269 for the 12 months ending July 2012 to $219,421 for the 12 months ending July 2016.
Condominiums also saw a 15% increase in average sales price, from $106,250 for the 12 months ending July 2012 to $122,649 for the 12 months ending July 2016.
Queen
Constitution Hill west to La Reine, includes southwest Judiths Fancy
Inventory
Four years ago (July 2012), there was a 3.7 year supply of homes and a 5.9 year supply of condominiums on the market.
For homes, the inventory decreased by 1 year, to a 2.7 year supply of homes. For condominiums, the supply decreased by nearly 5 years to a 1.0 year supply of condominiums.
Average Sales Price
For both homes and condominiums, the average sales price increased, compared to four years ago.
Average home sale price increased 22% over the four year period, from $291,289 for the 12 months ending July 2012 to $354,895 for the 12 months ending July 2016.
Condominiums saw a 21% increase in average sales price, from $75,125 for the 12 months ending July 2012 to $90,792 for the 12 months ending July 2016.
Northside A & B
North shore from north Judiths Fancy west to Hamms Bluff
Inventory
Four years ago (July 2012), there was a 4.6 year supply of homes and a 6.5 year supply of condominiums on the market.
For homes, the inventory decreased by nearly 3 years, to a 1.8 year supply of homes. For condominiums, the supply decreased by nearly 6 years to a six month supply of condominiums.
Average Sales Price
For homes, the average sales price increased, compared to four years ago. For condominiums, the average sales price decreased.
Average home sale price increased 64% over the four year period, from $459,110 for the 12 months ending July 2012 to $753,188 for the 12 months ending July 2016.
Condominiums saw a 30% decrease in average sales price, from $345,000 for the 12 months ending July 2012 to $240,281 for the 12 months ending July 2016.
King
South shore from La Reine west to UVI
Inventory
Four years ago (July 2012), there was a 3.8 year supply of homes; there are no condominiums in King Quarter.
Home inventory decreased by 1.5 years, to a 2.3 year supply of homes, compared to four years ago. For the 12 months ending July 2013, only one home sold in King Quarter.
Average Sales Price
Average home sale price decreased 6% over the four year period, from $207,400 for the 12 months ending July 2012 to $194,875 for the 12 months ending July 2016.
Prince
South shore from UVI west to Williams Delight
Inventory
Four years ago (July 2012), there was a 5.8 year supply of homes and an 11.0 year supply of condominiums on the market.
For homes, the inventory decreased by 3.5 years, to a 2.3 year supply of homes. For condominiums, the supply decreased by 10 years to a 1 year supply of condominiums.
Average Sales Price
For both homes and condominiums, the average sales price decreased, compared to four years ago.
Average home sale price decreased 22% over the four year period, from $208,430 for the 12 months ending July 2012 to $161,958 for the 12 months ending July 2016.
Condominiums saw a 52% decrease in average sales price, from $415,000 for the 12 months ending July 2012 to $200,625 for the 12 months ending July 2016.
West End
South from Mahogany Road, East to Williams Delight
Inventory
Four years ago (July 2012), there was a 4.6 year supply of homes and a 7.0 year supply of condominiums on the market.
For homes, the inventory decreased by 3 years, to a 1.5 year supply of homes. For condominiums, the supply decreased by nearly 6 years, to a 1.3 year supply of condominiums.
Average Sales Price
For both homes and condominiums, the average sales price increased, compared to four years ago.
Average home sale price increased 26% over the four year period, from $164,300 for the 12 months ending July 2012 to $206,925 for the 12 months ending July 2016.
Condominiums saw a 141% increase in average sales price, from $62,500 for the 12 months ending July 2012 to $150,625 for the 12 months ending July 2016.
Conclusion
Over the five year period, average home sale prices were highest, usually more than double those of other quarters, in these quarters:
· East End B
· East End A
· Northside A & B
Over the five year period, average condominium sale prices decreased or remained little changed island wide.
Both home and condominium inventory decreased island wide over the past five years, except for Queen Quarter, which saw a 6 month increase in homes for sale.
Information is from MLS and deemed to be reliable, but is not guaranteed.
Prepared by:
Julie San Martin
Team Manager
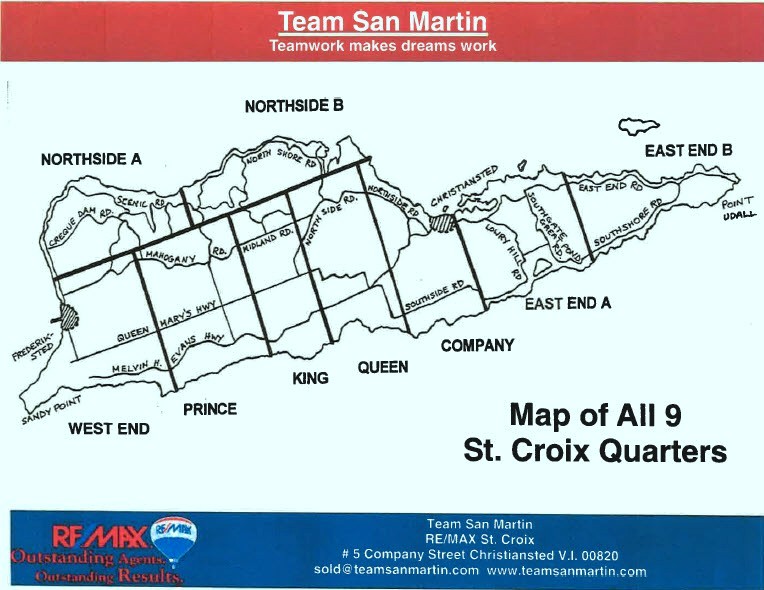
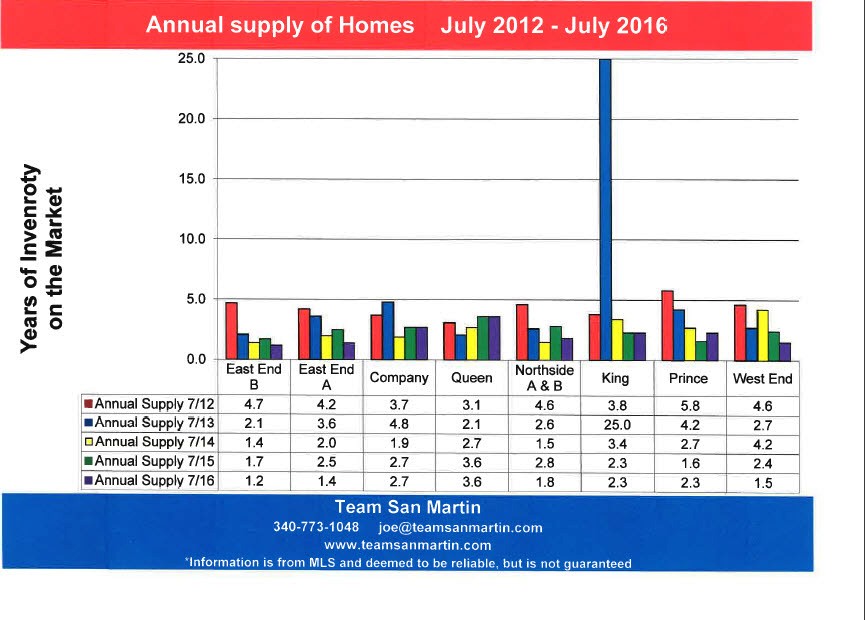
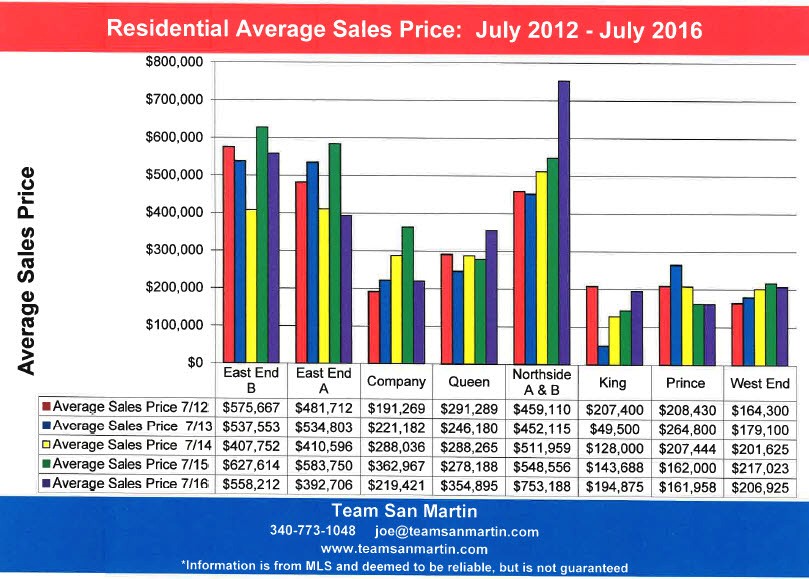
July 2016
11 year look at the St Croix Real Estate Market for the 12 month period ending 30 June
The last real estate boom on St Croix was 11 years ago –
The 2005 / 2006 period
Total number of properties sold
· Residential – Good news! Total homes sold during the past 12 months is the highest since 2006 / 2007, at 163 home sales. The lowest number of sales was 2011 / 2012, with only 90 home sales.
· Condominiums – At 107 condo sales, total sales are not quite as good as the previous 12 month period (2014 / 2015, with 121 condos closed), but respectable. The lowest number of condo sales was again 2011 / 2012, with only 42 condo sales.
· Land – Land sales have been unchanged for the past 5 years, with just 60 to 71 land sales during the 12 month period.
Average sales price
· Residential – Again, good news! The “average” home sale price is up nearly $50,000 from the previous 12 month period, at $392,184. The lowest “average” home sales price was 2013 / 2014, at $336,190.
· Condominiums – “Average” condo sales price was about $9,000 less than the previous 12 month period, at $168,996, and has been in approximately the same range ($146,000 to $176,000) for the past 4 years.
· Land – “Average” lot sales price was about $9,000 higher than the previous 12 month period, at $76,591. The land market is behaving similarly to the condo market, with little change over the past four years and average sales prices in the $67,000 to $76,000 range.
Total Market
Number of properties sold x Average sales price
· Residential – More good news! At $63.9 Million, the total residential market is only about $2 Million below the 2006 / 2007 total market of $66.1 Million. Sadly, it is still nearly $30 Million below the height of the market in 2005 / 2006 ($93.6 Million).
· Condominiums – At $18.1 Million, the total condominium market is $3 Million lower than the previous 12 month period. However, it is much better than the 2009 through 2014 periods and nearly as good as the 2007 / 2008 figure of $20.7 Million!
· Land – At a total market of $4.7 Million, we’ve seen worse (2012 through 2014), but not much. The current total land market is approximately 10% of the height of the market in 2005 / 2006 of $45.6 Million.
Conclusion
Compared to 11 years ago, total St Croix real estate sales have decreased by 52% ($92.6 Million)
Compared to the previous 12 month period, total St Croix real estate sales have increased by $14 Million for the period of July 2015 through June 2016
Information is from MLS and deemed to be reliable, but is not guaranteed.
Prepared by:
Julie San Martin
Team Manager
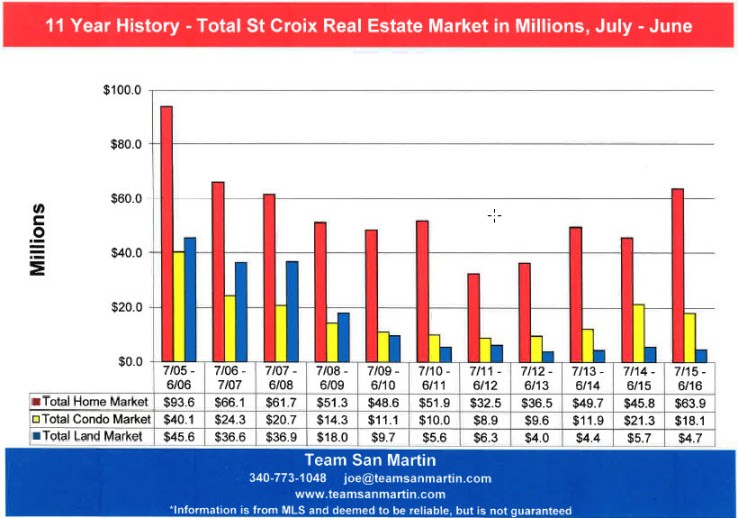
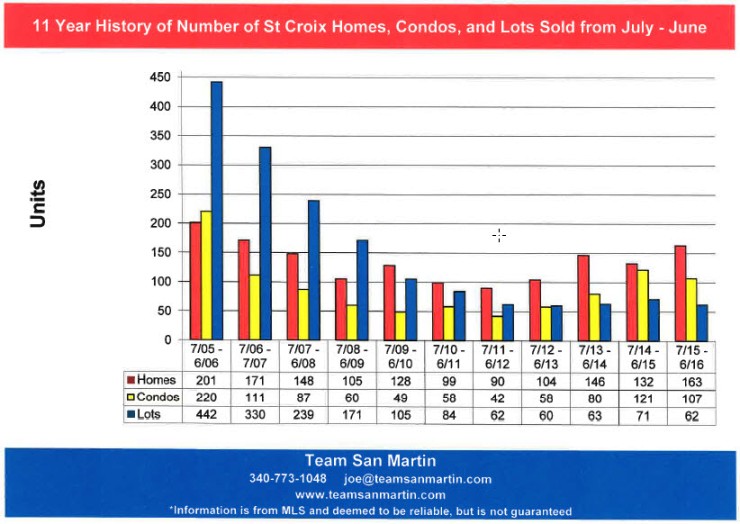
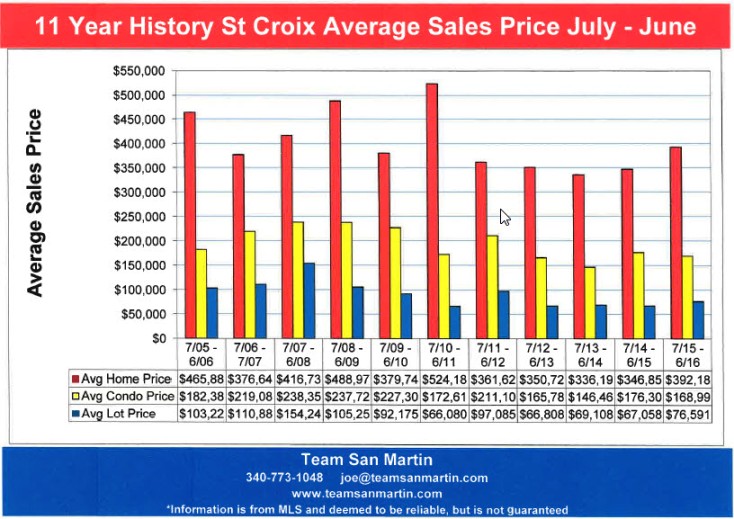
June 2016
Changes in the St Croix Real Estate Market
Inventory levels by price range reflect the seller’s expectations.
The attached graphs compare changes in asking prices over the past 6 years, using 15 May inventory levels.
Residential
· The lowest price range (under $200,000) has increased each year and more than doubled (from 14% to 34%) over the 6 year period. This price range now represents one third of the St Croix home market.
· The second tier (($200,000 to $400,000) has consistently represented nearly 1/3 of all homes for sale on St Croix over the 6 year period. Nearly 2/3 of all homes for sale on St Croix are currently listed for $400,000 or less.
· Over the 6 year period, homes listed from more than $400,000 have decreased by 20%, from 56% of the market to 36% of all homes for sale on St. Croix in May 2016.
Condominium
· The lowest price range (under $100,000) has nearly tripled over the 6 year period, from 9% of total market in 2010 to 25% of the total St Croix condominium market in 2016.
· The second tier ($100,000 to $200,000) has decreased by 6%, when compared to May 2010.
· Condominiums listed for more than $200,000 have decreased by 10% of the total market over the 6 year period, from 41% of total market in 2010 to 31% of the total St Croix condominium market in May 2016.
Land
· The lowest price range (under $50,000) has nearly doubled over the 6 year period, from 20% of total market in 2010 to 37% of all lots for sale in 2016.
· The second tier ($50,000 to $100,000) has decreased by 10% over the 6 year period, from 35% of total market in 2010 to 25% of all lots for sale in 2016.
· Lots listed for more than $100,000 have decreased by 7% over the 6 year period, from 45% of the St Croix land market in 2010 to 38% in May 2016.
Information is from MLS and deemed to be reliable, but is not guaranteed.
Prepared by:
Julie San Martin
Team Manager

May 2016
May Inventory Levels
6 Year Review
Residential
Residential inventory peaked in 2012 and has been steadily declining since then. Current inventory is slightly lower (11 homes) compared to May 2011.
Condominium
Condominium inventory also peaked in 2012 and has been steadily declining since then. Current inventory is significantly lower (80 condominiums) compared to May 2011.
Land
Land inventory peaked in 2011, steadily declining until 2014 and has continually increased since then. Current inventory is slightly lower (31 lots) compared to
May 2011.
May Pending Sale Levels
6 Year Review
Residential
Residential pending sales were similar for 2011 and 2012, also for the period of 2013 through 2015, after a significant increase. Current pending sale levels showed a huge increase in 2016, but closed sales continue at 2015 levels.
Condominium
Condominium pending sales have followed the same trend as residential pending sales. Current pending sale levels showed a significant increase in 2016, but closed sales continue at 2015 levels.
Land
There have been no significant changes in the number of pending lot sales over the 6 year period.
2016 Sales Predictions
Using the assumption that the first 4 months of 2016 is a valid predictor for the entire year.
Residential
The first four months predict there will be approximately the same number of homes sold as in 2015 BUT pending sales tell a very different story, so no prediction.
Condominium
The first four months predict there will be approximately the same number of condominiums sold as in 2015 BUT pending sales tell a somewhat different story, so no prediction.
Land
Land is quite predictable. This market will show little improvement in 2016.
Information is from MLS and deemed to be reliable, but is not guaranteed.
Prepared by:
Julie San Martin
Team Manager
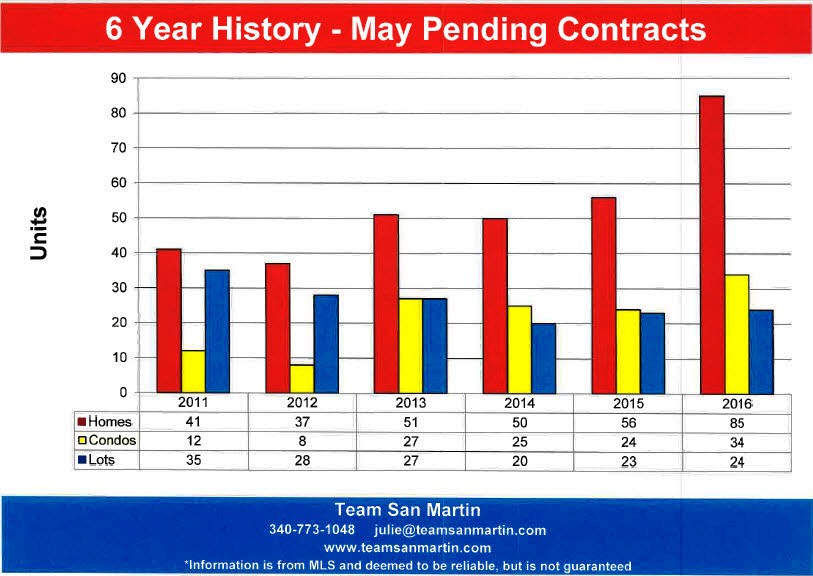
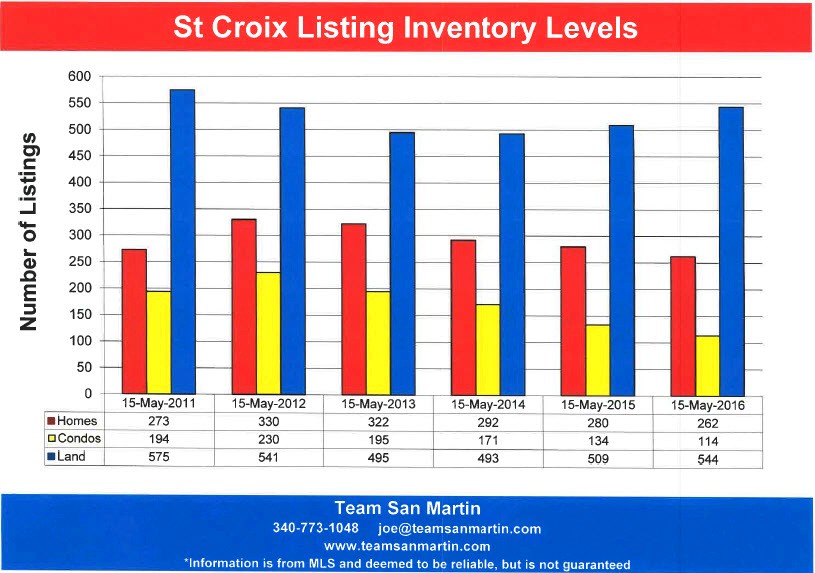
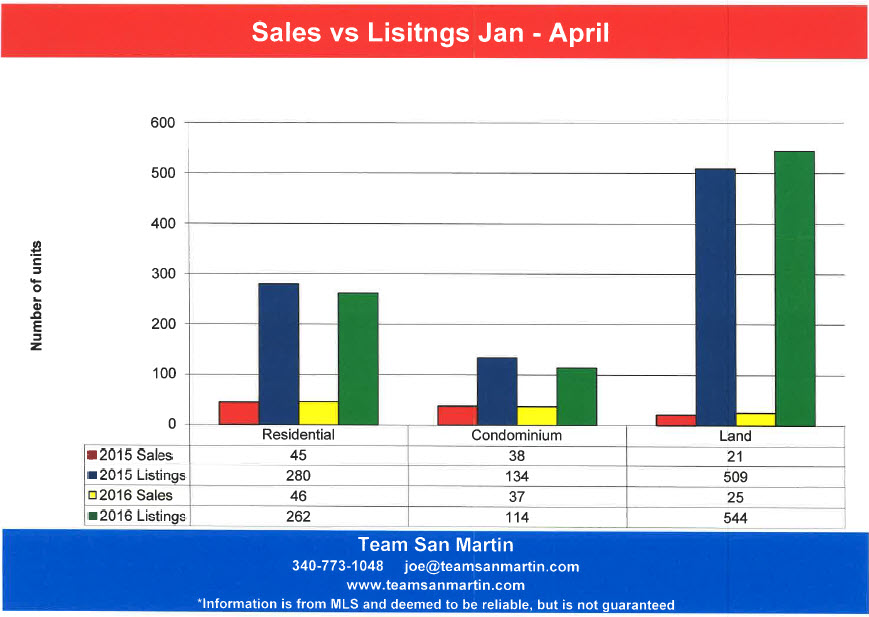
April 2016
1st Quarter Sales as Predictor for the full year
2016 is the 8th year of the St Croix real estate market “recovery” from the real estate boom years of 2006 through 2008.
The obvious question is – what do the 1st quarter statistics predict about market prospects for the balance of the year?
First, a look at inventory trends over the
8 year period:
· Residential inventory peaked in 2012, at 340 homes for sale, and has continually declined each year since. Current residential inventory levels are now lower, at 259 homes on the market, than at the beginning of the recovery in 2009, when there were 266 homes on the market.
· Condominium inventory peaked in 2010, with 265 condominiums on the market. The current level of 114 condominiums for sale is the lowest inventory level of the 8 year period.
· Land inventory also peaked in 2010, at 610 lots for sale. There was a slight decline during the 2013 to 2015 period; inventory is again increasing, with 546 lots for sale in March 2016.
Residential Sales & 2016 Predictions
The number of units sold during the first quarter has consistently under predicted the total number of sales for the year. Right now, the prediction is for about the same number of home sales for 2016 as were sold in 2015.
The average 1st quarter sales price has, in most cases, been within 10% of the annual average sales price.
Here is the prediction for 2016 overall:
· Total number of homes sold will be in the mid-140 range, very similar to 2015.
· Average sales price will most likely be in the $400,000 range, about the same as 2015.
Condominium Sales & 2016 Predictions
This is a much smaller market, with just a few units built since the 1980s. It is more difficult to identify trends, because the sample is significantly smaller.
Since 2012, the 1st quarter units sold has consistently underestimated the annual total number of units sold.
1st quarter average sale price has, in most cases, overestimated the average annual condominium sales price
Here is the prediction for 2016 overall:
· Total number of condominiums sold will be in the low-90 range, about 15% fewer than 2015.
· Average sales price will most likely be in the $140,000 range, very similar to the 1st quarter average condominium sales price.
Land Sales & 2016 Predictions
Unfortunately, in 2015 the total number of 1st quarter sales exactly predicted the annual number of lot sales, quite a disappointment. The previous 6 years all exceeded the 1st quarter predictions for total number of lots sold annually.
The 2015 annual average lot sales price was also very close to the 1st quarter prediction.
Here is the prediction for 2016 overall:
· Total number of lots sold will be about the same as 2015, about 64 lot sales.
· The 2016 average lot sales price will most likely be a bit below the 2015 average sales price, in the $65,000 range.
Information is from MLS and deemed to be reliable, but is not guaranteed.
Prepared by:
Julie San Martin
Team Manager
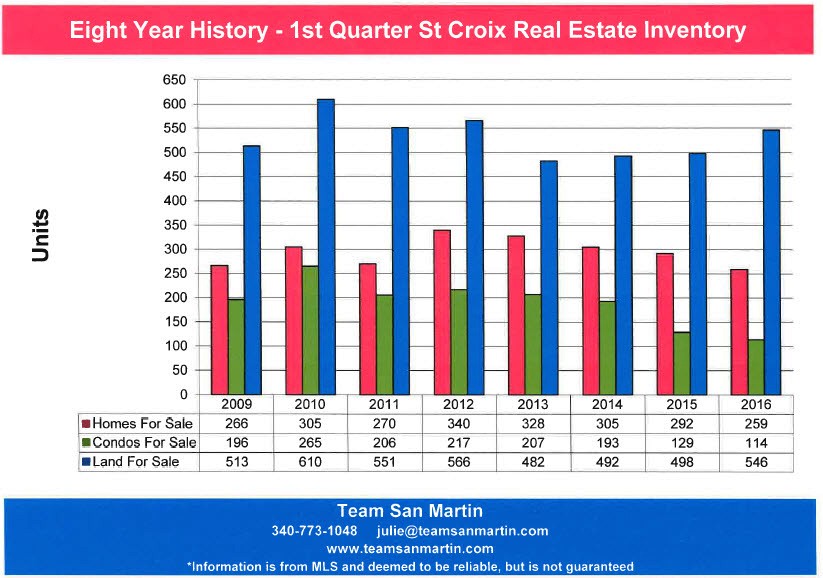
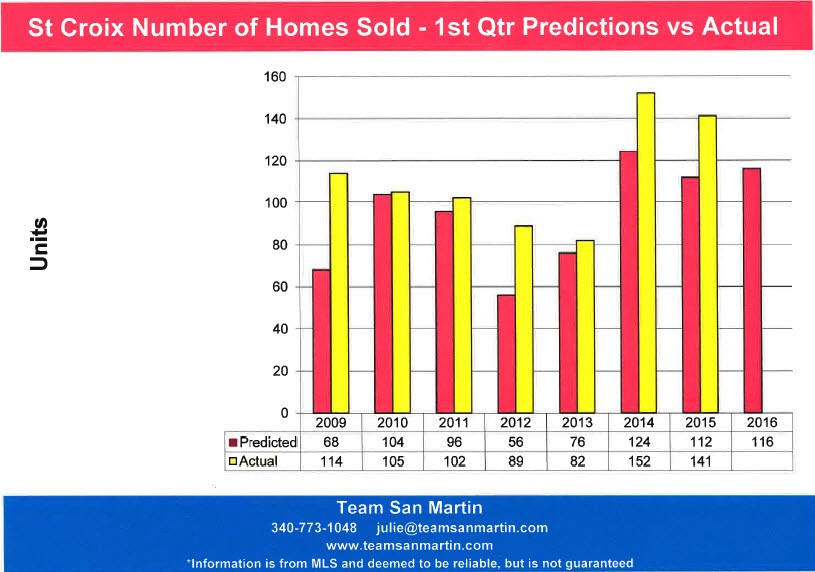
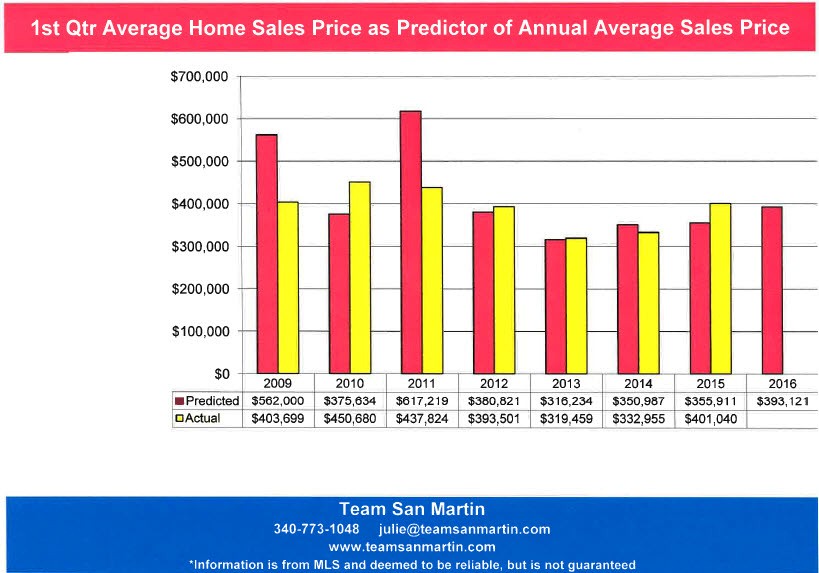
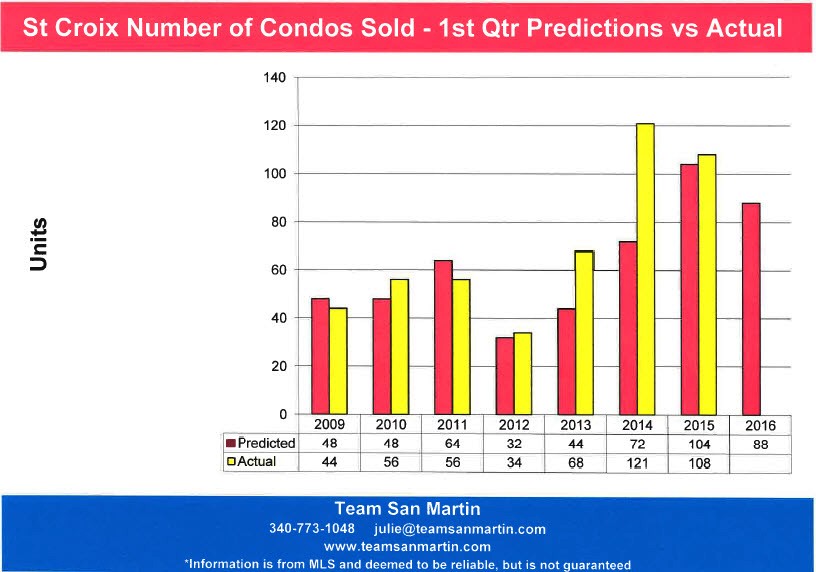
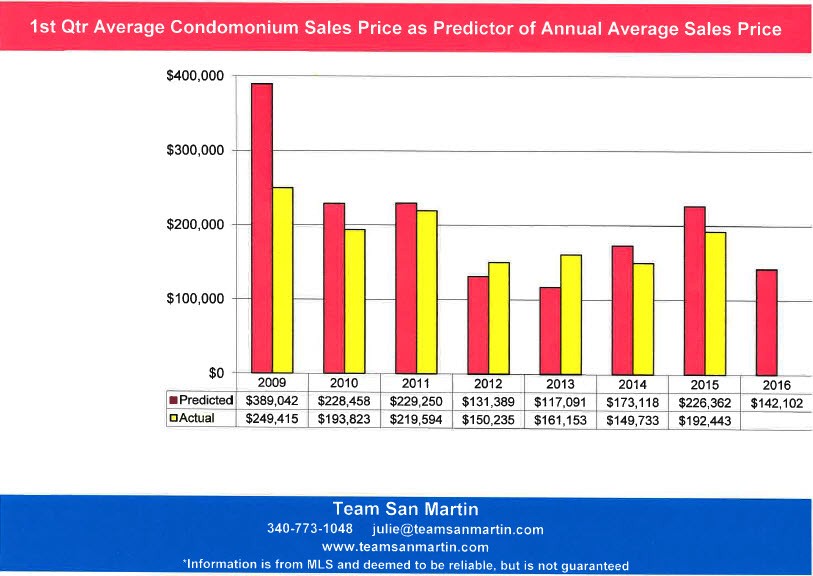
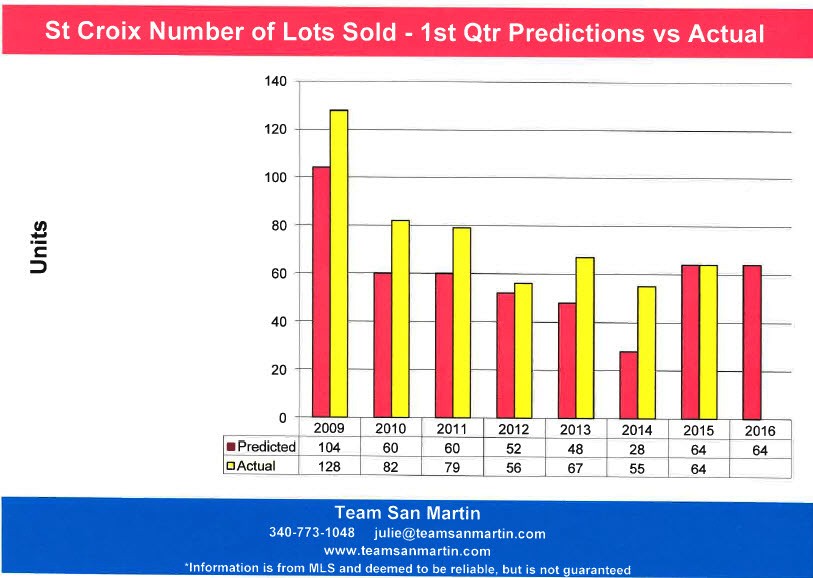
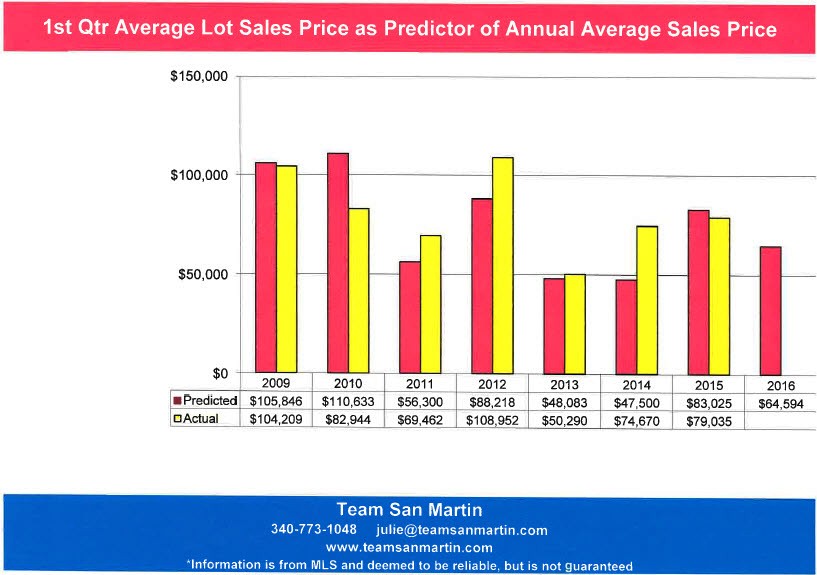
March 2016
Home Sales
St Thomas vs St Croix
A 13 Year Look
Total Number of Properties Sold
· Over the 13 year period, more homes were sold every year on St Croix than on St Thomas.
· Both islands saw a slight decrease in the number of homes sold annually from 2014 to 2015; 1% decrease for St Thomas, 8% decrease for St Croix.
· The most homes sold annually for both islands was during the period of 2003 through 2007. St Thomas averaged 102 home sales annually during this period; current sales levels are at 92% of the height of the market. St Croix averaged 179 home sales during this period; current sales levels are at 78% of the height of the market.
Average Sales Price
· In 2003, the average price of a home on St Thomas and St Croix were nearly identical ($416,250 for St Thomas, $415,390 for St Croix).
· From 2004 until the present, the annual average home price on St Thomas has exceeded that of St Croix.
· The average annual home sales price on St Croix for 2015 was 61% of the average annual home sales price on St Thomas.
Total Market in Millions of Dollars
· This measurement is a combination of total homes sold and average sales price, so it gives the best overview of annual market performance.
· For the nine year period of 2003 through 2011, with the exception of 2008, the total annual residential market on St Croix always surpassed the total annual St Thomas residential market.
· For the past four years, 2012 through 2015, the annual St Thomas residential market has surpassed St Croix. The largest difference was 2014, when total St Thomas residential sales surpassed St Croix by $35 Million Dollars. For 2015 annual residential total market, St Thomas exceeded St Croix by $5.4 Million Dollars.
Information is from MLS and deemed to be reliable, but is not guaranteed.
Prepared by:
Julie San Martin
Team Manager

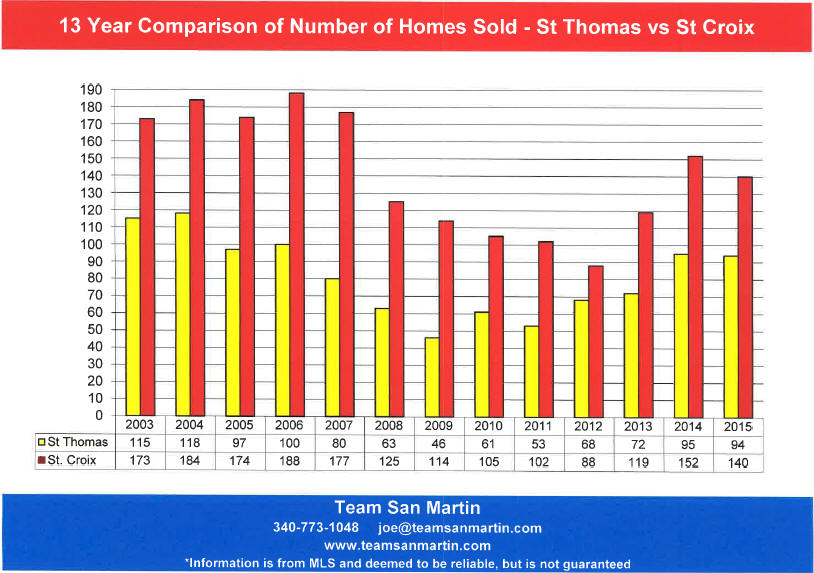
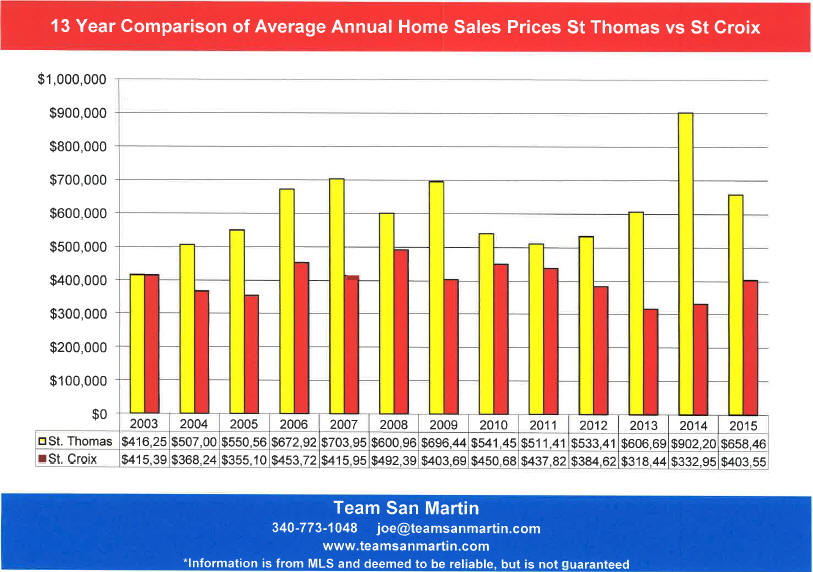
February 2016
The St Croix Real Estate Cycle
A 13 Year Look
Total Number of Properties Sold
· Fewer homes and condominiums sold in 2015 than in 2014
· Number of homes sold during 2015 (140) exceeds all years since 2007 (177 home sales), except 2014 with 152 home sales.
· Number of condominiums sold mirrors home sales; more condominiums sold in 2015 (108) than any year since 2006, with the exception of 2014 (121 condo sales).
· Number of land sales was up slightly when compared to last year, with 64 land sales in 2015, but similar to the number of land sales since 2012.
Average Sales Price
· The 2015 average home sales price ($403,550) shows an improvement over 2013 ($319,450) and 2014 ($332,950) and is very similar to the average home sale price of 2003 ($413,430).
· The 2015 average condominium sales price ($192,440) is nearly $50,000 higher than the 2003 average sales price ($144,820) and exceeds the average condominium sales price for the past three years.
· Only 2011, 2013, and 2014 saw lower average lot sale prices than the average 2015 lot sales price of $79,035.
Total Market in Millions of Dollars
· Even though the number of home sales in 2015 were down about 7%, when compared to 2014, the significant increase in average sales price of about $70,000 resulted in an increase of $6,000,000 for the total home sales market.
· Condominiums experienced a larger decrease in units sold when comparing 2014 with 2015 (10%) and a smaller increase in average sales price of about $50,000, resulting in only about a $1,000,000 improvement in total condo sales market.
· At a $5,000,000 total market for land sales, only 2013 ($3.4 million) and 2014 ($4.1 Million) turned in a poorer land sale performance.
Information is from MLS and deemed to be reliable, but is not guaranteed.
Prepared by:
Julie San Martin
Team Manager
January 2016
4 Year Home Sales Price Trends
The average sales price of a home on St Croix has increased by approximately $10,000 (3%) since 2012 and nearly $70,000 (21%) when comparing 2015 to 2014.
Total number of homes sold has increased by 58% (51 homes) since 2012 and decreased by 7% (11 homes) when comparing 2015 to 2014.
All areas of the island did not perform the same.
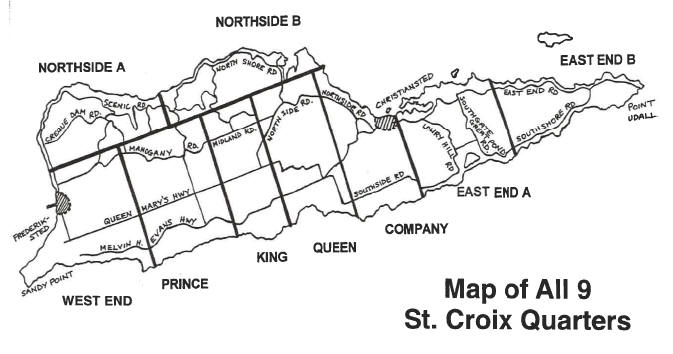
East End B
Far East End
Compared to 4 years ago, the average sales price of a home decreased 1% ($9,217), but when comparing 2015 sales figures to 2014, the average home sales price increased 64% ($259,463).
The number of homes sold in a year has doubled since 2012; when comparing 2015 to 2014, 2 fewer homes sold in 2015.
East End A
Christiansted East to Coakley Bay
Compared to 4 years ago, the average sales price of a home decreased 32% ($280,680); when comparing 2015 sales figures to 2014, the average home sales price increased 43% ($174,159).
The number of homes sold in a year has more than doubled since 2012 (from 10 to 25); when comparing 2015 to 2014, 3 fewer homes sold in 2015.
Company
Christiansted West to the East Side of Judiths Fancy
Compared to 4 years ago, the average sales price of a home increased 65% ($130,591); when comparing 2015 sales figures to 2014, the average home sales price increased 21% ($56,741).
The number of homes sold in a year has decreased by 3 homes since 2012; when comparing 2015 to 2014, only half as many homes sold as the previous year.
Queen
Constitution Hill West to La Reine, includes southwest Judiths Fancy
Compared to 4 years ago, the average sales price of a home increased 21% ($50,972); when comparing 2015 sales figures to 2014, the average home sales price decreased $503.
The number of homes sold in a year has decreased by 2 homes since 2012; when comparing 2015 to 2014, total number of homes sold increased by 1 home.
Northside A & B
North Shore from North Judiths Fancy to Hamms Bluff
Compared to 4 years ago, the average sales price of a home increased 42% ($192,924); when comparing 2015 sales figures to 2014, the average home sales price increased 20% ($105,236).
The number of homes sold in a year has decreased by 3 homes since 2012; when comparing 2015 to 2014, total number of homes sold decreased 41% (7 homes).
King
South Shore from La Reine West to UVI
Compared to 4 years ago, the average sales price of a home increased 49% ($45,812); when comparing 2015 sales figures to 2014, the average home sales price increased 4% ($4,895).
Four times as many homes sold during 2015 (8 homes) as compared to 2012 (2 homes); when comparing 2015 to 2014, two more homes sold in 2015.
Prince
South Shore from UVI West to Williams Delight
Compared to 4 years ago, the average sales price of a home decreased 32% ($83,378); when comparing 2015 sales figures to 2014, the average home sales price increased 25% ($34,079).
Nearly twice as many homes sold during 2015 (9 homes) as compared to 2012 (5 homes); when comparing 2015 to 2014, significantly fewer homes sold in 2015 (9 homes) as did in 2014 (14 homes).
West End
South Shore, South from Mahogany Road, East to Williams Delight
Compared to 4 years ago, the average sales price of a home increased 6% ($10,900); when comparing 2015 sales figures to 2014, the average home sales price decreased 14% ($36,067).
More than twice as many homes sold during 2015 (23 homes) as compared to 2012 (10 homes); when comparing 2015 to 2014, significantly more homes sold in 2015 (23 homes) as did in 2014 (15 homes).
Observations
(also see graphs below)
Average home sales prices in three areas of the island consistently exceed the island wide “average” home sales price:
· East End B
· East End A
· Northside A & B
Average home sales prices in three areas of the island are consistently much lower than the island wide “average” home sales price:
· King
· Prince
· West End
Center island average home sales prices are about 2/3 the island wide “average” home sales prices:
· Company
· Queen
Fewer homes sold in all quarters during 2015, when compared to 2014, with the exception of:
· King
· West End
Compared to 2014, the island wide average home sale price increased 21%. All quarters saw increased average home sale price with the exception of:
· Queen
· West End
Compared to 2012, these quarters saw higher average home sales prices:
· Company
· Queen
· Northside A & B
· King
· West End
Compared to 2012, these quarters saw lower average home sales prices:
· East End B
· East End A
· Prince
Information is from MLS and deemed to be reliable, but is not guaranteed.
Prepared by:
Julie San Martin
Team Manager

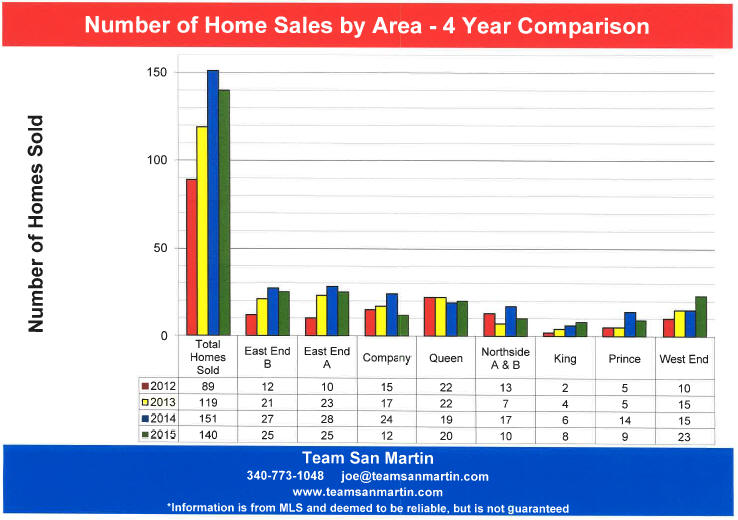
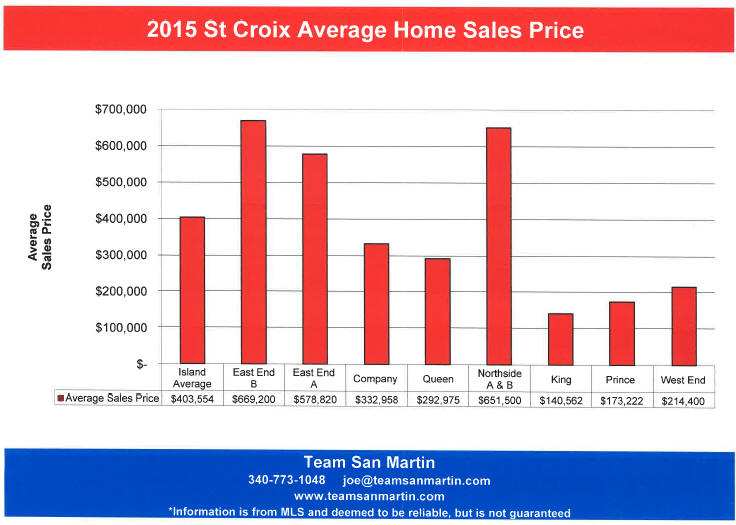
©
December 2015
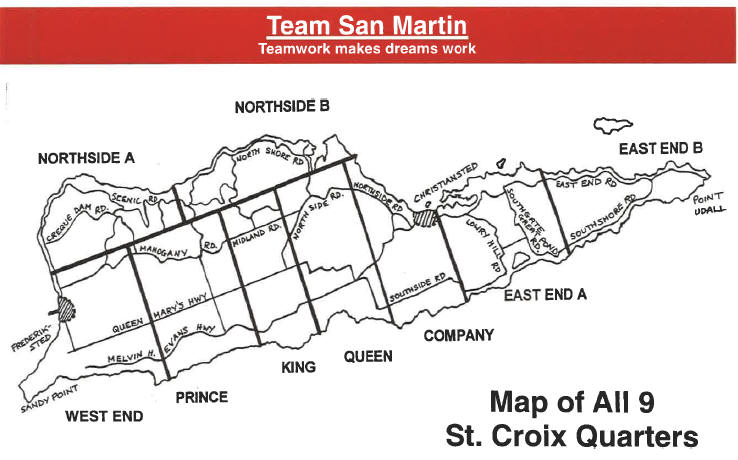
Inventory Level Trends by Quarter
Current Annual supply represents the number of years it will take at the current rate of sales to sell all the properties listed in a specific area (Quarter) of St Croix.
[Active Listings + Pending Listings] /
Number of Listings Sold During the Previous 12 Months
For example:
In November 2015, there were 25 active and 7 pending home sales in East End B, with 26 home sales in the previous 12 months, for a 1.2 year supply of homes for sale
[25 + 7] / 26 = 1.2 Years
East End B
Far East End
Residential
Compared to 5 years ago, home inventory has decreased by about half
(31 months vs 14 months) and average sales price is about 28% lower
($888,908 vs $637,077)
Compared to last year, home inventory is unchanged (14 months); average sales price has increased by about 54% ($415,756 vs $637,077)
Condominium
Compared to 5 years ago, condominium inventory has decreased by about one third (30 months vs 12 months); average sales price has decreased by about 32% ($370,846 vs $281,714)
Compared to last year, condominium inventory is about the same rate
(10 months vs 12 months); average sales price has decreased by about 29% ($200,026 vs $281,714)
Vacant Land
Compared to 5 years ago, land inventory is about one year less
(8.2 years vs 7.3 years); average sales price is unchanged ($79,929 vs $80,787)
Compared to last year, land inventory decreased by about 20 months (9 years vs 7.3 years); average sales price increased by about 27% ($58,575 vs $80,787)
East End A
Christiansted East to Coakley Bay
Residential
Compared to 5 years ago, home inventory is approximately the same
(2.8 years vs 2.9 years); average home sale price increased by about 106%
($307,597 vs $631,295)
Compared to last year, residential inventory has increased by about a year
(1.8 years vs 2.9 years); average sales price increased by about 59%
($397,569 vs $631,295)
Condominium
Compared to 5 years ago, condominium inventory has decreased by about half (36 months vs 14 months); the average condominium sales price is unchanged ($242,556 vs $242,965)
Compared to last year, condominium inventory is about the same
(17 months vs 14 months); average sales price has increased by about 4%
($231,529 vs $242,965)
Vacant Land
Compared to 5 years ago, land inventory has more than doubled (5.2 years vs 12.3 years); average lot sales price has increased by about 41% ($54,421 vs $93,571)
Compared to last year, land inventory has increased by about 4 years
(8.6 years vs 12.3 years); average lot sales price has increased by about 27% ($68,200 vs $93,571)
Company
Christiansted West to the East Side of Judiths Fancy
Residential
Compared to 5 years ago, residential inventory is about one half
(7.0 years vs 3.7 years); average home sales price has increased about 19% ($275,571 vs $342,409)
Compared to last year, residential inventory has doubled (1.8 years vs 3.7 years); average home sales price has increased about 20% ($271,052 vs $342,409)
Condominium
Compared to 5 years ago, condominium inventory has decreased by nearly 75% (7 years vs 19 months); average sales price is unchanged ($124,992 vs $122,610)
Compared to last year, condominium inventory has increased by about 5 months (14 months vs 19 months); average sales price has increased by about 16%
($106,240 vs $122,610)
Vacant Land
Compared to 5 years ago, land inventory has increased by more than four times (3.8 years vs 16.7 years) while average sales price has decreased to about one third ($66,433 vs $22,500)
Compared to last year, land inventory has decreased more than 50% (43 years vs 16.7 years) while average sales price has decreased to about one quarter
($80,000 vs $22,500)
Queen
Constitution Hill West to La Reine, includes southwest
Judiths Fancy
Residential
Compared to 5 years ago, residential inventory is unchanged (2.9 years) while average sales priced decreased by about 60% ($427,342 vs $253,171)
Compared to last year, residential inventory is unchanged (2.5 years vs 2.9 years); average sales price decreased by about 10% ($277,776 vs $253,171)
Condominium
Compared to 5 years ago, condominium inventory has decreased by about 13 months (6.8 years vs 5.7 years); average condominium sales price decreased by about 16% ($102,250 vs $88,333)
Compared to last year, condominium inventory has increased by about 4.5 years (1.2 years vs 5.7 years); average sales price has increased about 13%
($76,883 vs $88,333)
Vacant Land
Compared to 5 years ago, land inventory has decreased by about one half
(16.2 years vs 7.8 years); average lot sales price has decreased by about 61% ($61,000 vs $37,889)
Compared to last year, land inventory has increased by 14 months
(6.6 years vs 7.8 years); the average lot sales price is unchanged ($39,583 vs $37,889)
Northside A & B
North Shore from North Judiths Fancy to Hamms Bluff
Residential
Compared to 5 years ago, residential inventory has decreased by 5 months
(3.3 years vs 2.9 years); average home sales price decreased by about 12%
($592,312 vs $529,444)
Compared to last year, residential inventory has doubled (1.3 years vs 2.9 years); average home sales price is unchanged ($528,446 vs $529,444)
Condominium
Compared to 5 years ago, condominium inventory decreased by nearly four years (4.7 years vs 0.8 years); average sales price has decreased by about 84% ($440,000 vs $239,670)
Compared to last year, condominium inventory decreased by about half
(1.5 years vs 0.8 years); average sales price increased by about 11%
($212,333 vs $239,670)
Vacant Land
Compared to 5 years ago, land inventory has decreased by about 2/3
(14 years vs 3.9 years); average lot sales price increased by about 33%
($59,333 vs $98,671)
Compared to last year, land inventory has decreased by about three quarters
(14.2 years vs 3.9 years); average lot sales price has decreased by about 170% ($266,400 vs $98,671)
King
South Shore from La Reine West to UVI
Residential
Compared to 5 years ago, residential inventory has decreased by 50%
(4 years vs 2 years); average home sales price also decreased by 50%
($247,800 vs $128,833)
Compared to last year, residential inventory has decreased by about 20 months
(3.4 years vs 2 years); average residential sale price decreased by about 36% ($174,857 vs $128,833)
Condominium
There are no condominium complexes in King Quarter
Vacant Land
5 years ago, no land sales were reported in King Quarter during the 12 month period ending November 2011.
Last year, no land sales were reported in King Quarter between December 2013 and November 2014.
Between December 2014 and November 2015, three land sales were reported in King Quarter, with an average sales price of $76,667 and four years of inventory currently on the market.
Prince
South Shore from UVI West to Williams Delight
Residential
Compared to 5 years ago, there is about 8 months more residential inventory (2.6 years vs 3.3 years); the average residential sales price decreased about 36% ($239,519 vs $176,056)
Compared to last year, residential inventory increased by 16 months (2 years vs 3.3 years); average residential sales price increased by about 14%
($150,172 vs $176,056)
Condominium
Compared to 5 years ago, condominium inventory has decreased by two thirds (3.7 years vs 1.3 years); average condominium sales price decreased by about 43% ($288,333 vs $202,000)
Compared to last year, condominium inventory has decreased by about two thirds (3.7 years vs 1.3 years); average condominium sale price increased by about 21% ($159,333 vs $202,000)
Vacant Land
Compared to 5 years ago, land inventory has decreased by about one half
(9.3 years vs 4.5 years); average lot sales price has increased by about 28%
($50,714 vs $70,985)
Compared to last year, land inventory has decreased by about one half
(9.5 years vs 4.5 years); average lot sales price has increased by about 117% ($32,750 vs $70,985)
West End
South Shore, South from Mahogany Road,
East to Williams Delight
Residential
Compared to 5 years ago, residential inventory has decreased by about 11 months (2.9 years vs 2 years); average home sale price has increased by about 29% ($157,512 vs $223,800)
Compared to last year, residential inventory has decreased by nearly one half
(3.7 years vs 2 years); average home sale price decreased by about 4%
($236,929 vs $223,800)
Condominium
Compared to 5 years ago, condominium inventory has decreased by nearly two years (2.3 years vs 5 months); average condominium sale price decreased by about 36% ($146,250 vs $107,714)
Compared to last year, condominium inventory decreased by 15 months
(20 months vs 5 months); average condominium sale price decreased by about 6% ($113,300 vs $107,714)
Vacant Land
Compared to 5 years ago, land inventory has increased by 5 years (10.9 years vs 15.6 years); average lot sales price has increased by about 190% ($32,222 vs $93,279)
Compared to last year, land inventory decreased by about 8 years (23.8 years vs 15.6 years); average lot sales price increased by about 190% ($32,525 vs $93,279)
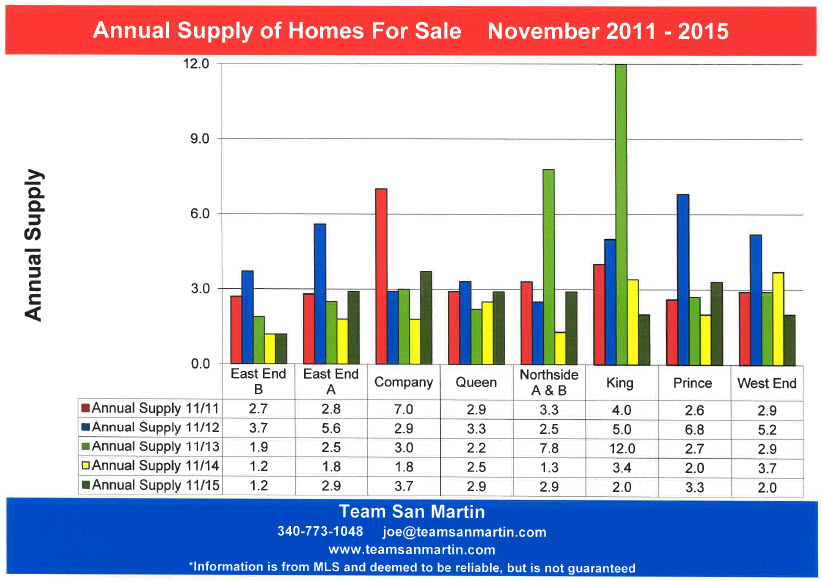
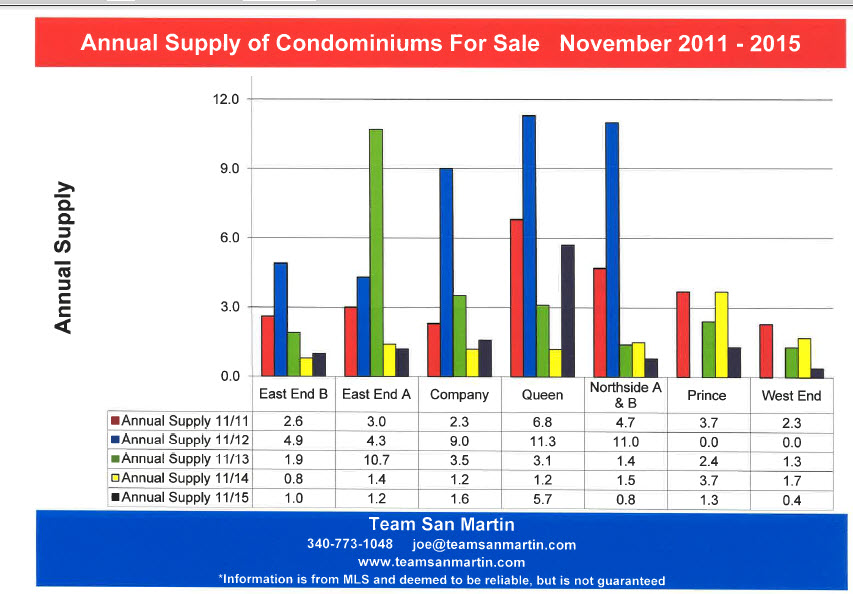
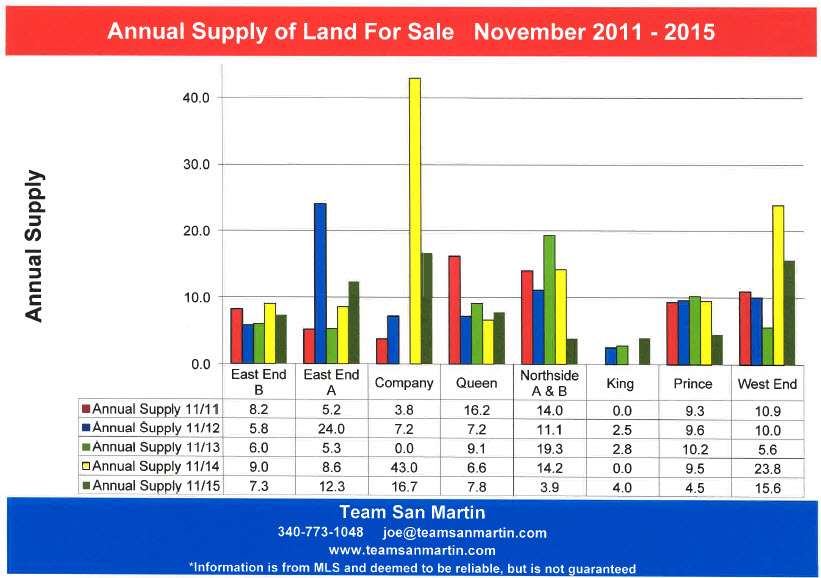
Information is from MLS and deemed to be reliable, but is not guaranteed.
Prepared by:
Julie San Martin
Team Manager
November 2015
Which St Croix Price Ranges are Selling?
First 10 months of 2014 vs 2015
Residential
2014
134 homes sales closed January – October; there were 308 homes for sale
2.3 sellers for every buyer
2015
111 homes sales closed January – October; there are 273 homes for sale
2.5 sellers for every buyer
Condominium
2014
101 condominium sales closed January – October; there were 154 condos for sale
1.5 sellers for every buyer
2015
88 condominium sales closed January – October; there were 127 condos for sale
1.4 sellers for every buyer
Vacant Land
2014
37 land sales closed January – October; there were 522 lots for sale
14.1 sellers for every buyer
2015
62 land sales closed January – October; there were 490 lots for sale
7.9 sellers for every buyer
INVENTORY BY PRICE RANGE
Residential
Condominium
Vacant Land
OVER VIEW
Residential
Compared to last year, total number of homes sold decreased 17%, from 134 sold during this period in 2014 to 111 homes sold during the same period in 2015
Condominium
Compared to last year, total number of condominiums sold decreased 12%, from 101 sold during this period in 2014 to 88 condos sold during the same period in 2015
Vacant Land
Compared to last year, total number of lots sold increased 68%, from 37 sold during this period in 2014 to 62 lots sold during the same period in 2015!!!
Inventory Levels
In all categories, the total number of properties for sale decreased, compared to October 2014.
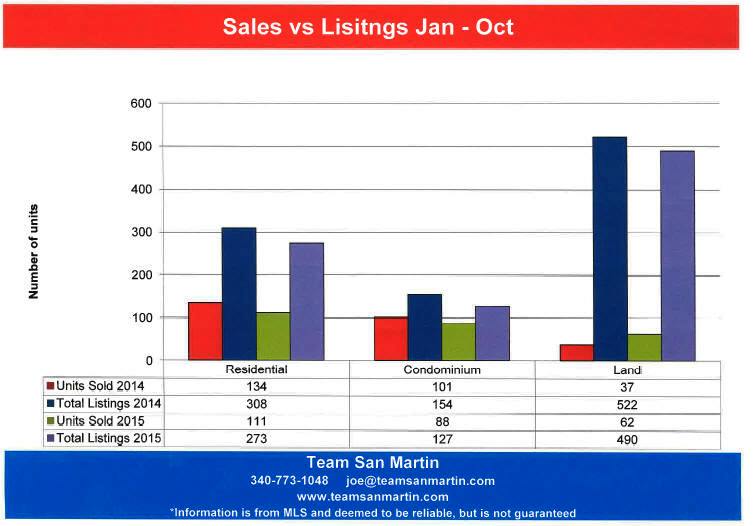
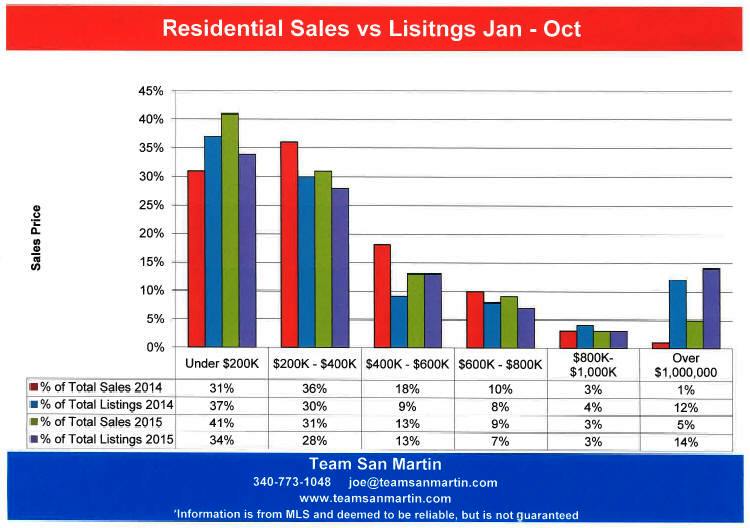
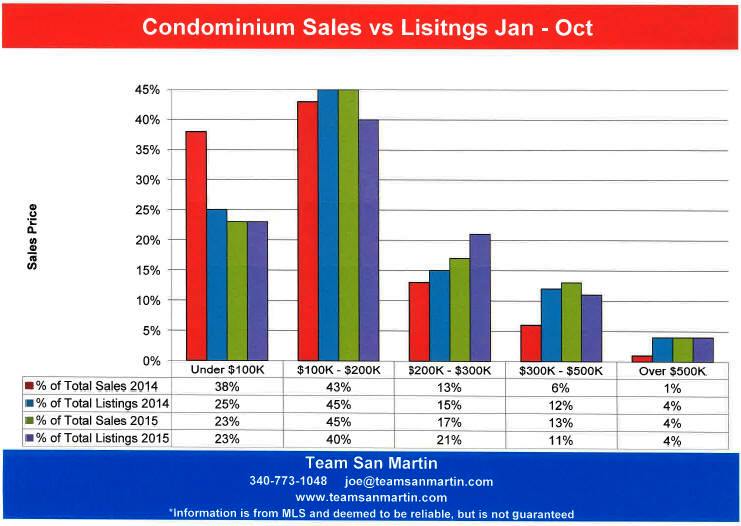
Information is from MLS and deemed to be reliable, but is not guaranteed.
Prepared by:
Julie San Martin
Team Manager
October 2015
Six Year Comparison
St Croix Real Estate Inventory Levels
TOTAL INVENTORY
Residential
Identical to six years ago – 265 homes for sale.
Highest inventory during this period was 9/15/12 – inventory was 27% higher
(336 homes for sale)
Condominium
Significant (45%) decrease over six years!
236 condos for sale 9/15/09
130 condos for sale 9/15/15
Vacant Land
Inventory has decreased 13% over the six year period.
575 Lots for sale 9/15/09
509 Lots for sale 9/15/15
INVENTORY BY PRICE RANGE
Residential
Under $200,000 listings have nearly tripled (from 13% to 35%) as percentage of total inventory, compared to six years ago.
$200,000 to $400,000 listings are unchanged as percentage of total inventory, at about 28%
$400,000 to $600,000 listings have decreased by 2% of total inventory
· 15% of total inventory 9/15/09
· 13% of total inventory 9/15/15
$600,000 to $1,000,000 listings declined by more than 50% over the six year period
· 23% of total inventory 9/15/09
· 10% of total inventory 9/15/1/5
Over $1,000,000 listing declined by 6% over the six year period
· 20% of total inventory 9/15/09
· 14% of total inventory 9/15/15
Condominium
Under $100,000 listings have more than doubled (from 11% to 25%) as percentage of total inventory, compared to six years ago.
$100,000 to $200,000 listings have decreased by 6% of total inventory,
compared to six years ago
· 47% of total inventory 9/15/09
· 41% of total inventory 9/15/15
$200,000 to $300,000 listings are essentially unchanged over the six year period,
at about 18% of total inventory.
$300,000 to $500,000 listings have decreased by 6% over the six year period
· 17% of total inventory 9/15/09
· 11% of total inventory 9/15/15
Over $500,000 listings have decreased by 50% of total inventory over the six year period
· 8% of total inventory 9/15/09
· 4% of total inventory 9/15/15
Vacant Land
Under $50,000 listings have nearly doubled as a percentage of total inventory,
over the six year period.
· 21% of total inventory 9/15/09
· 37% of total inventory 9/15/15
$50,000 to $100,000 listings have decreased by 5% of total inventory,
since six years ago
· 30% of total inventory 9/15/09
· 25% of total inventory 9/15/15
$100,000 to $300,000 listings have decreased 6% of total inventory,
since six years ago
· 33% of total inventory 9/15/09
· 27% of total inventory 9/15/15
Over $300,000 listings have decreased by 5% of total inventory since six years ago
· 16% of total inventory 9/15/09
· 11% of total inventory 9/15/15
Information is from MLS and deemed to be reliable, but is not guaranteed.
Prepared by:
Julie San Martin
Team Manager
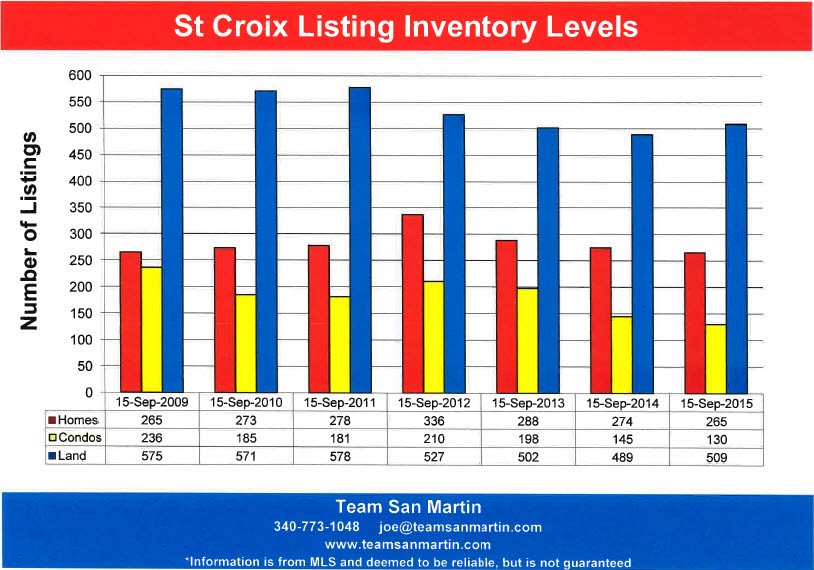
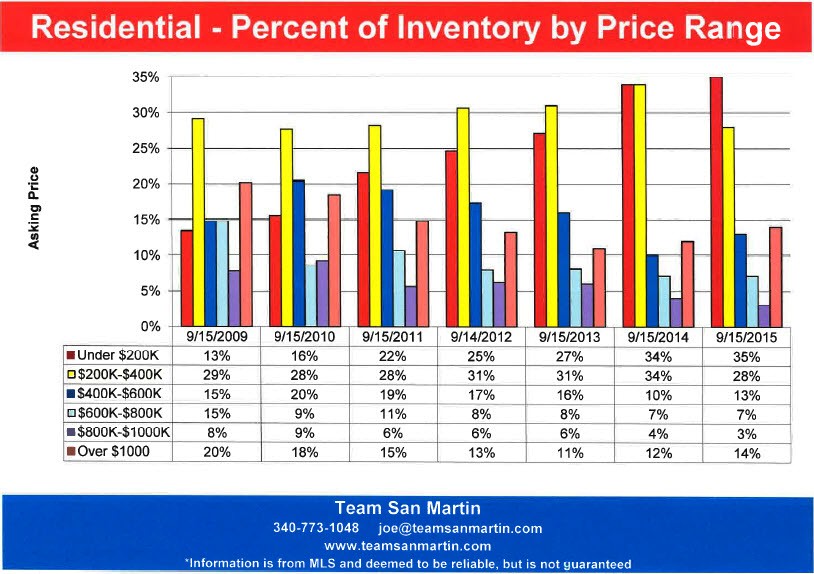
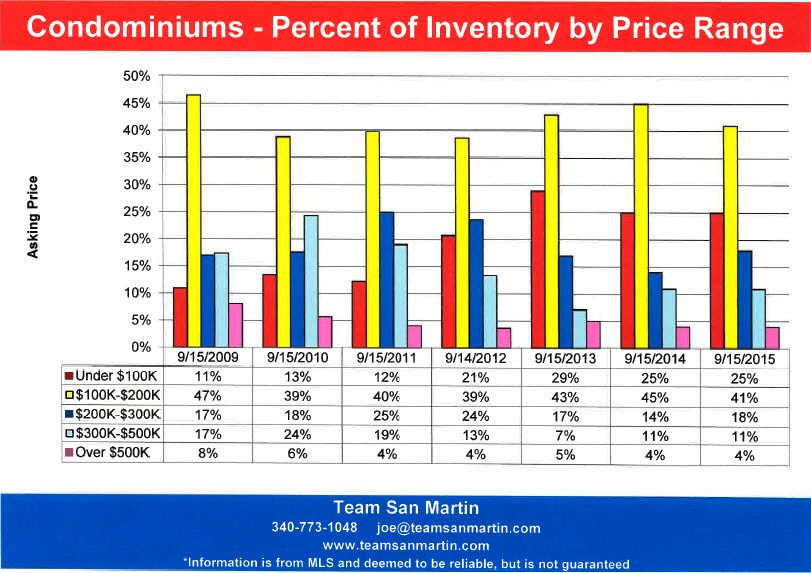
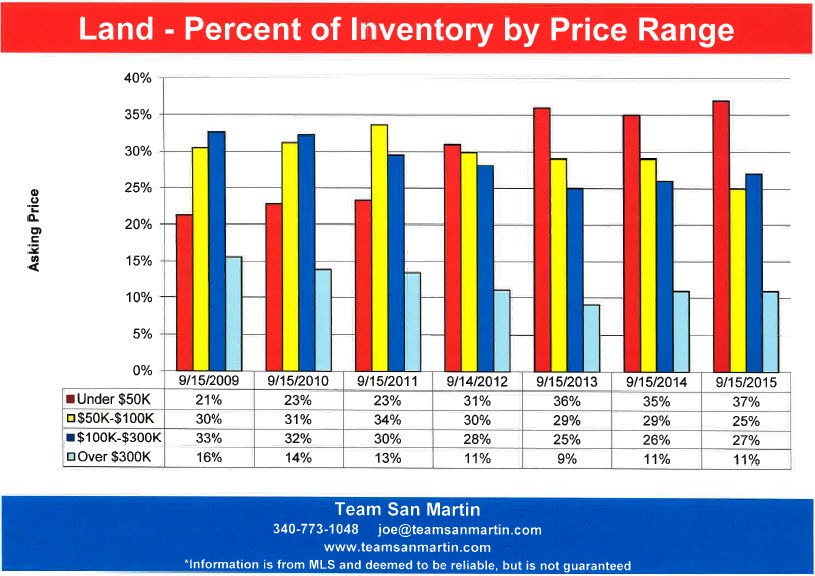
September 2015
September 2015
A Tale of Two Islands
St Croix and St Thomas Real Estate Sales
Three Year Comparison Year to Date
Number of Sales
Residential
Both islands have seen a significant decrease in number of homes sold, compared to 2014 year to date
|
Number of Homes sold |
St Thomas |
% increase (decrease) |
St Croix |
% increase (decrease) |
|
Jan – Aug 2013 |
46 |
|
82 |
|
|
Jan – Aug 2014 |
67 |
+ 46% |
114 |
+39% |
|
Jan – Aug 2015 |
54 |
(-19%) |
85 |
(-25%) |
Condominium
St Croix continues to lead St Thomas in number of condominium sales. Both islands saw a decrease in number of condominiums sold, compared to 2014 year to date.
|
Number of Condos sold |
St Thomas |
% increase (decrease) |
St Croix |
% increase (decrease) |
|
Jan – Aug 2013 |
52 |
|
54 |
|
|
Jan – Aug 2014 |
70 |
+35% |
82 |
+52% |
|
Jan – Aug 2015 |
66 |
(-5%) |
69 |
(-15%) |
Vacant Land
St Croix barely leads St Thomas in number of land sales, although St Croix’s inventory is typically at least double the St Thomas inventory.
|
Number of Condos sold |
St Thomas |
% increase (decrease) |
St Croix |
% increase (decrease) |
|
Jan – Aug 2013 |
21 |
|
41 |
|
|
Jan – Aug 2014 |
30 |
+43% |
30 |
(-26%) |
|
Jan – Aug 2015 |
38 |
+27% |
47 |
+57% |
Average Sales Price
Residential
For both 2013 and 2014 year to date, the average price of a St Thomas home was 230% of a home on St Croix. For 2015 year to date, this ratio has narrowed to 162%, a change of nearly 70%.
|
Average Home Sales Price |
St Thomas |
% increase (decrease) |
St Croix |
% increase (decrease) |
|
Jan – Aug 2013 |
$665,130 |
|
$287,762 |
|
|
Jan – Aug 2014 |
$772,334 |
+17% |
$332,572 |
+16% |
|
Jan – Aug 2015 |
$689,658 |
(-10%) |
$426,719 |
+29& |
St Thomas Home Sales Prices
|
|
Lowest |
Highest |
|
Jan – Aug 2013 |
$100,000 |
$3,300,000 |
|
Jan – Aug 2014 |
$ 34,000 |
$4,400,000 |
|
Jan – Aug 2015 |
$ 85,000 |
$6,000,000 |
St Croix Home Sales Prices
|
|
Lowest |
Highest |
|
Jan – Aug 2013 |
$ 35,000 |
$ 800,000 |
|
Jan – Aug 2014 |
$ 35,000 |
$1,680,000 |
|
Jan – Aug 2015 |
$ 31,000 |
$6,250,000 |
Several high sales prices have skewed the St Croix data. This is more evident when looking at the median (midpoint sales price, half of all sales were for more than the median, half were for less)
Median Sales Price
|
Median Home Sales Price |
St Thomas |
% increase (decrease) |
St Croix |
% increase (decrease) |
|
Jan – Aug 2014 |
$490,000 |
|
$299,000 |
|
|
Jan – Aug 2015 |
$492,000 |
No change |
$255,000 |
(-14%) |
Condominium
The average price of a condominium year to date has remained constant on St Thomas for the past three years at about $223,000. St Croix saw a significant increase ($47,000) in the average condominium sales price over last year.
|
Average Condo Sales Price |
St Thomas |
% increase (decrease) |
St Croix |
% increase (decrease) |
|
Jan – Aug 2013 |
$223,604 |
|
$169,563 |
|
|
Jan – Aug 2014 |
$219,512 |
(-1%) |
$155,356 |
(-8%) |
|
Jan – Aug 2015 |
$227,064 |
+4% |
$202,402 |
+31% |
St Thomas Condominium Sales Prices
|
|
Lowest |
Highest |
|
Jan – Aug 2013 |
$ 38,000 |
$ 550,000 |
|
Jan – Aug 2014 |
$ 39,000 |
$ 770,000 |
|
Jan – Aug 2015 |
$ 55,000 |
$ 940,000 |
St Croix Condominium Sales Prices
|
|
Lowest |
Highest |
|
Jan – Aug 2013 |
$ 40,000 |
$ 545,000 |
|
Jan – Aug 2014 |
$ 30,000 |
$ 775,000 |
|
Jan – Aug 2015 |
$ 22,500 |
$1,150,000 |
The median St Croix condominium sales price increased 26%, compared to this date in 2014, but still lags behind St Thomas by $30,000.
Median Sales Price
|
Median Home Condo Price |
St Thomas |
% increase (decrease) |
St Croix |
% increase (decrease) |
|
Jan – Aug 2014 |
$165,000 |
|
$119,125 |
|
|
Jan – Aug 2015 |
$180,000 |
+9% |
$150,000 |
+26% |
Vacant Land
Three years ago, the average sales price of a lot on St Thomas was 250% that of the St Croix average year to date. Last year the average sales price of a lot on St Thomas was 150% of the StCroix average year to date. This year, the average sales price of a lot on St Thomas was only 118% of the St Croix average year to date.
|
Average Lot Sales Price |
St Thomas |
% increase (decrease) |
St Croix |
% increase (decrease) |
|
Jan – Aug 2013 |
$ 108,357 |
|
$ 43,425 |
|
|
Jan – Aug 2014 |
$ 126,172 |
+17% |
$ 80,162 |
+85% |
|
Jan – Aug 2015 |
$ 91,737 |
(-26%) |
$ 78,055 |
(-2%) |
St Thomas Land Sales Prices
|
|
Lowest |
Highest |
|
Jan – Aug 2013 |
$ 35,000 |
$ 250,000 |
|
Jan – Aug 2014 |
$ 15,000 |
$ 900,000 |
|
Jan – Aug 2015 |
$ 20,000 |
$ 370,000 |
St Croix Land Sales Prices
|
|
Lowest |
Highest |
|
Jan – Aug 2013 |
$ 10,000 |
$ 120,000 |
|
Jan – Aug 2014 |
$ 8,000 |
$ 970,000 |
|
Jan – Aug 2015 |
$ 13,000 |
$ 348,000 |
Total Market (Millions)
Residential
|
Total Market (Millions) |
St Thomas |
% increase (decrease) |
St Croix |
% increase (decrease) |
|
Jan – Aug 2013 |
$ 30.6 |
|
$ 23.6 |
|
|
Jan – Aug 2014 |
$ 51.7 |
+69% |
$ 37.9 |
+61% |
|
Jan – Aug 2015 |
$ 37.2 |
(-28%) |
$ 36.3 |
(-4%) |
Condominium
|
Total Market (Millions) |
St Thomas |
% increase (decrease) |
St Croix |
% increase (decrease) |
|
Jan – Aug 2013 |
$ 11.6 |
|
$ 9.2 |
|
|
Jan – Aug 2014 |
$ 15.4 |
+33% |
$ 12.7 |
+38% |
|
Jan – Aug 2015 |
$ 15.0 |
No change |
$ 14.0 |
+11% |
Vacant Land
|
Total Market (Millions) |
St Thomas |
% increase (decrease) |
St Croix |
% increase (decrease) |
|
Jan – Aug 2013 |
$ 2.3 |
|
$ 1.8 |
|
|
Jan – Aug 2014 |
$ 3.8 |
+66% |
$ 2.4 |
+34% |
|
Jan – Aug 2015 |
$ 3.5 |
(-7%) |
$ 3.7 |
+55% |
Information is from MLS and deemed to be reliable, but is not guaranteed.
Prepared by:
Julie San Martin
Team Manager
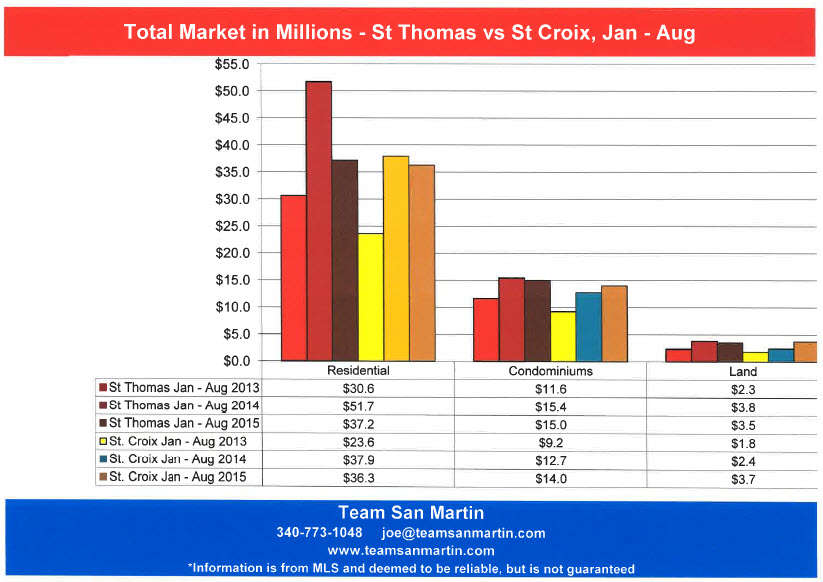
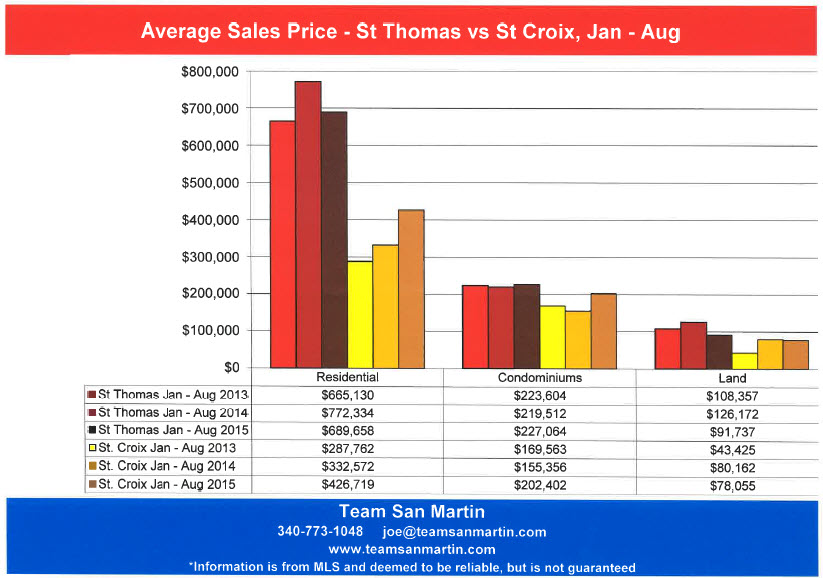
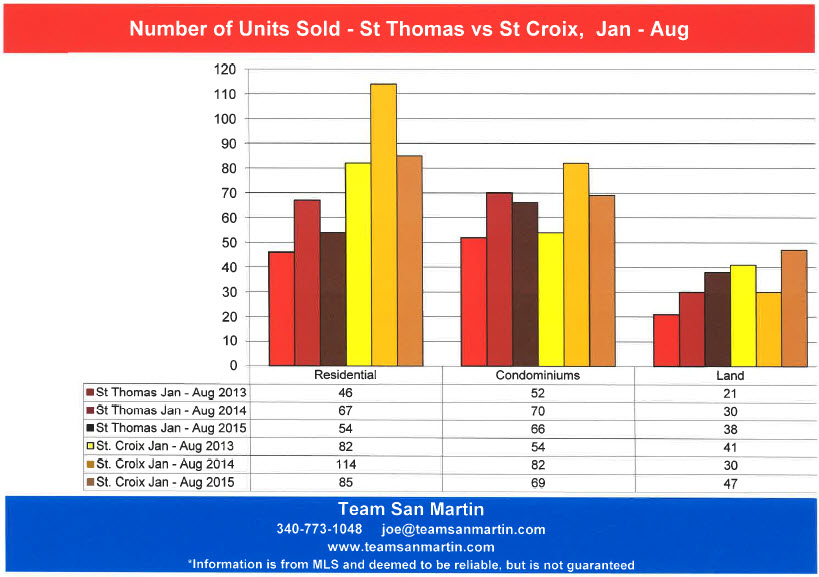
August 2015
Sales Price and Marketing Time on St Croix
“Annual Supply” represents the number of years it will take at the current annual rate of sales to sell all the properties for sale in a specific area.
East End B
Far East End
Inventory
Three years ago (July 2012), there was a 4.7 year supply of homes on the market and a 4.3 year supply of condominiums.
The inventory decreased by 3 years for both homes and condominiums over the three year period, to 1.7 years for homes and 1.1 years for condominiums.
Average Sales Price
The average home sales price increased by $52,000 since July 2012; the average condominium sales price decreased by $112,687.
East End A
Christiansted East to Coakley Bay
Inventory
Three years ago (July 2012), there was a 4.2 year supply of homes on the market and 4.8 year supply of condominiums.
The inventory decreased by 1.7 years for homes and 4 years for condominiums over the three year period, to 2.5 years for homes and 0.8 years (about 10 months) for condominiums.
Average Sales Price
The average home sales price increased by $102,000 since July 2012; the average condominium sales price increased by $38,420.
Company
Christiansted West to east side of Judiths Fancy
Inventory
Three years ago (July 2012), there was a 3.7 year supply of homes on the market and 5.9 year supply of condominiums.
The inventory decreased by 1 year for homes and 4.5 years for condominiums since then, to 2.7 years for homes and 1.5 years for condominiums.
Average Sales Price
The average home sales price increased by $171,700, nearly doubling, since July 2012; the average condominium sales price increased by $15,000.
Queen
Constitution Hill west to La Reine, includes southwest Judiths Fancy
Inventory
Three years ago (July 2012), there was a 3.1 year supply of homes on the market and an 8.3 year supply of condominiums.
The inventory increased by 6 months (0.5 years) for homes and decreased 1.6 years for condominiums since then, to 3.6 years for homes and 6.7 years for condominiums.
Average Sales Price
The average home sales price decreased by $13,000 since July 2012; the average condominium sales price increased by $48,000.
Northside A & B
North Shore from north Judiths Fancy to Hamms Bluff
Inventory
Three years ago (July 2012), there was a 4.6 year supply of homes on the market and 6.5 year supply of condominiums.
The residential inventory decreased by 1.8 years and 4 years for condominiums over the three year period, to 2.8 years for homes and 2.5 years for condominiums.
Average Sales Price
The average home sales price increased by $89,000 since July 2012; the average condominium sales price decreased by $111,000.
King
South Shore from La Reine west to UVI
Inventory
Three years ago (July 2012), there was a 3.8 year supply of homes on the market; there are no condominiums in King Quarter.
The residential inventory decreased by 1.5 years over the three year period, to 2.3 years.
Average Sales Price
The average home sales price decreased by $64,000 since July 2012.
Prince
South Shore from UVI west to Williams Delight
Inventory
Three years ago (July 2012), there was a 5.8 year supply of homes on the market and an 11 year supply of condominiums.
The inventory decreased by 4.2 years for homes and 8.7 years for condominiums since then, to 1.6 years for homes and 2.3 years for condominiums.
Average Sales Price
The average sales price decreased by $46,000 for homes and $227,000 for condominiums since July 2012.
West End
South from Mahogany Road, East to Williams Delight
Inventory
Three years ago (July 2012), there was a 4.6 year supply of homes on the market and 7 year supply of condominiums.
The inventory decreased by 2.2 years for homes and 6.2 years for condominiums since then, to 2.4 years for homes and 10 months (0.8 years) for condominiums.
Average Sales Price
The average home sales price increased by $53,000 since July 2012; the average condominium sales price increased by $32,000.
Conclusion
Over the 3 year period, average home sales prices increased in all Quarters except those adjacent to the closed oil refinery:
· Queen
· King
· Prince
Over the 3 year period, average condominium sales prices increased in all Quarters except:
· East End B
· Northside A & B
· Prince (Carambola)
Over the 3 year period, residential inventory decreased in all quarters, except Queen Quarter.
Over the 3 year period, condominium inventory decreased island wide.
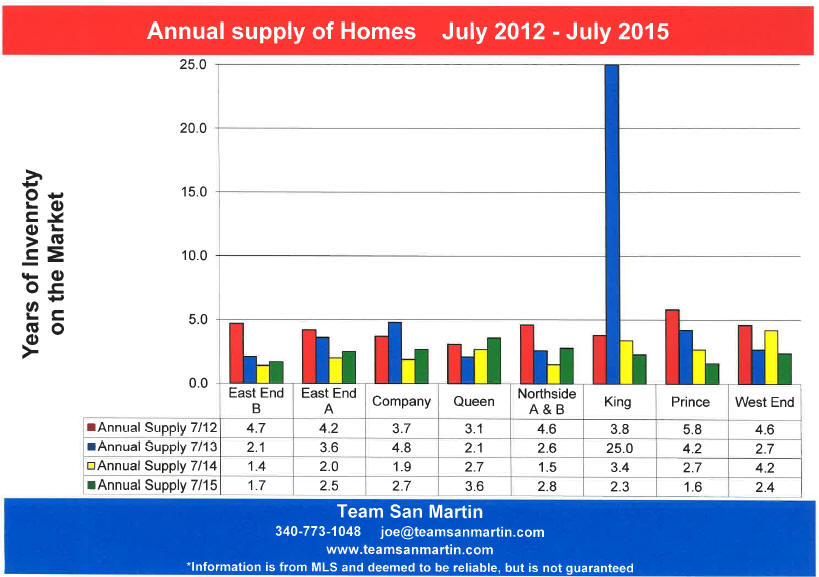
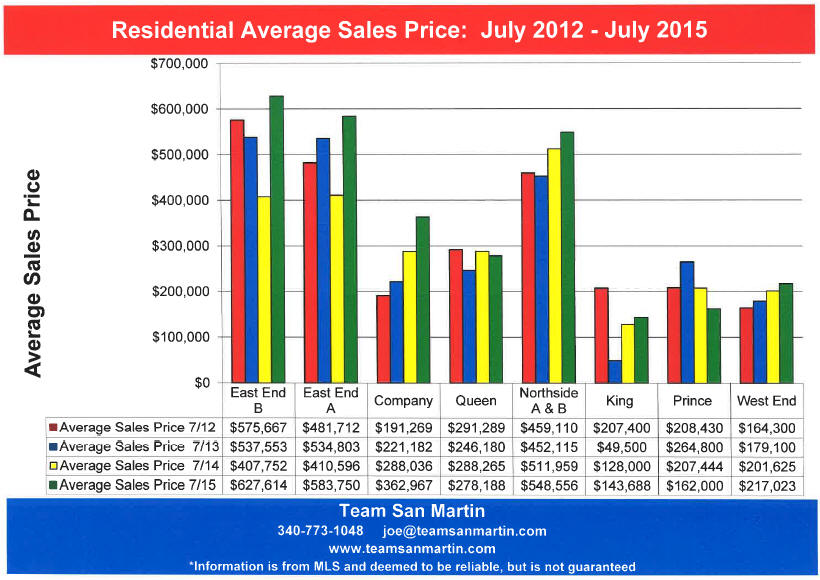
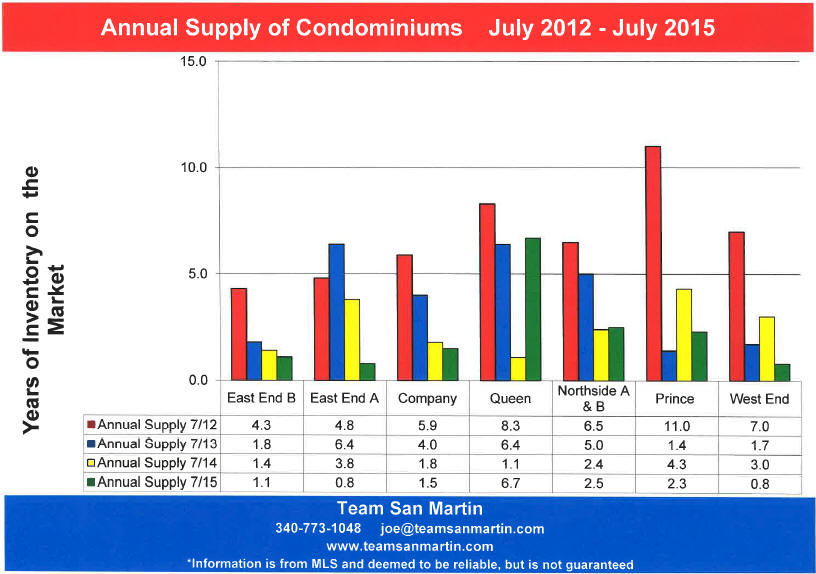
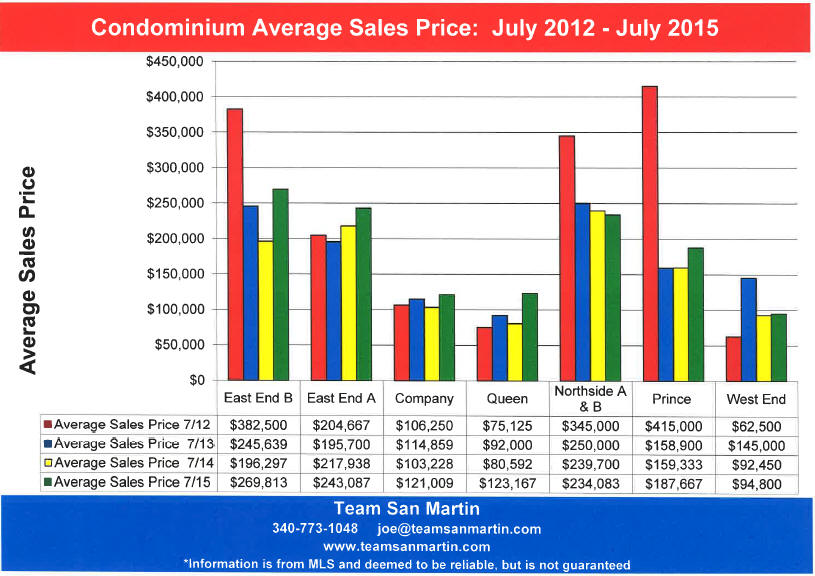
Information is from MLS and deemed to be reliable, but is not guaranteed.
Prepared by:
Julie San Martin
Team Manager
July 2015
10 year look at the St Croix Real Estate Market for the 12 month period
ending 30 June
The last real estate boom on St Croix was 10 years ago –
The 2006 / 2007 period
Total number of properties sold
· Residential – Total number of homes sold decreased by 1/3 over the 10 year period. The lowest point was July 2011 through June 2012, with a 55% decrease in the number of homes sold
(90 homes vs 201 homes).
· Condominiums – Total number of condominiums sold has decreased 45% over the 10 year period. The low point was again July 2011 through June 2012, with an 81% decline in condominiums sold (42 condos vs 220 condos).
· Land – Total number of lots sold has declined 84% over the 10 year period. The low point was more recent, July 2012 through June 2013; a 86% decrease in the number of lots sold
(60 lots vs 442 lots).
Average sales price
· Residential – The average sales price of a home on St Croix has decreased 26% over the 10 year period. For the past 4 years, since July 2011, the average sales price of a home on St Croix has been consistent, in the $350,000 range.
· Condominiums – The average sales price of a condominium on St Croix has declined only 3% over the 10 year period. In fact, the high point of this market was July 2007 through June 2008, when the average sales price of a condominium ($238,350) was 31% higher than during the July 2005 through June 2006 period ($182,380).
· Land – The average sales price of a lot on St Croix has declined 35% over the 10 year period, from $103,220 to $67,058. The average sales price of a lot has been unchanged over the past three years, since July 2012.
Total Market
Number of properties sold x Average sales price
· Residential – Total market has decreased 51% ($48 million dollars), compared to 10 years ago. The lowest point was July 2011 through June 2012, a 65% decrease ($61 Million Dollars).
· Condominiums – Total market has decreased 47% ($19 million dollars), compared to 10 years ago. The lowest point was, again, July 2011 through June 2012, with a 78% decrease ($31 million dollars).
· Land – Total market has decreased 87% ($40 million dollars), compared to 10 years ago. The low point was more recent, July 2012 through June 2013, a 91% decrease ($40 million dollars).
Conclusion
Compared to 10 years ago, total real estate sales on St Croix have decreased 51% ($76.5 million dollars)
Information is from MLS and deemed to be reliable, but is not guaranteed.
Prepared by:
Julie San Martin
Team Manager
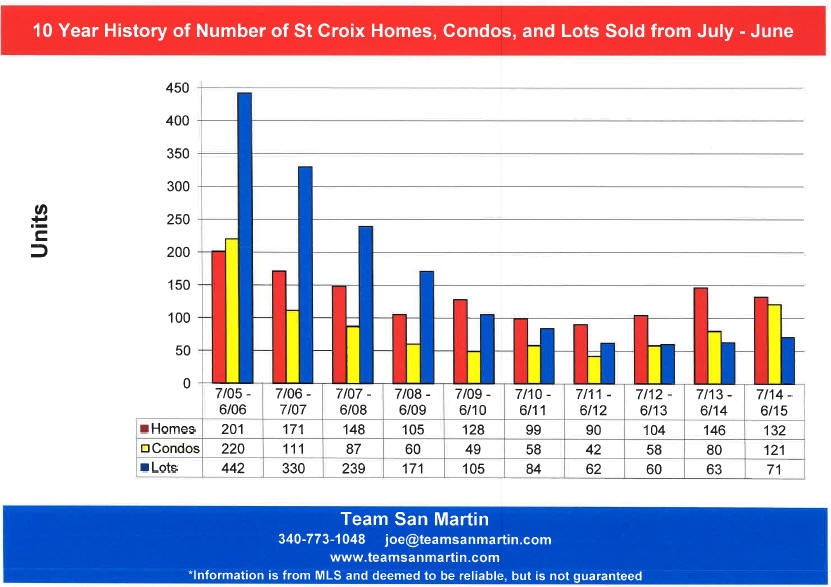
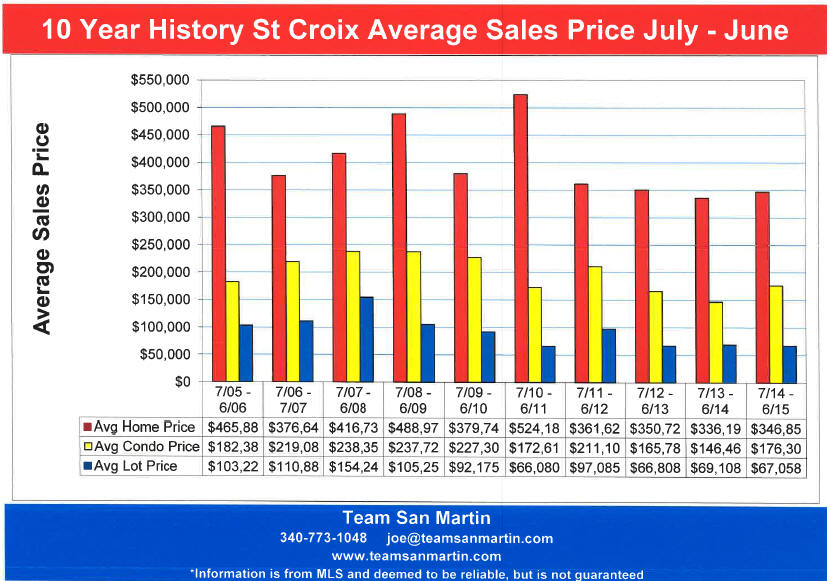
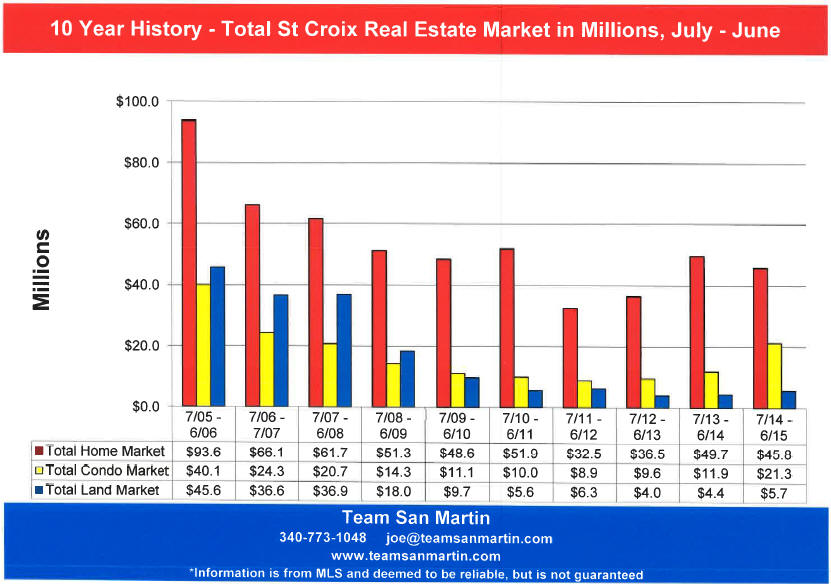
June 2015
Changes in the St Croix Real Estate Market
Inventory levels by price range reflect sellers’ expectations. The Attached graphs compare changes in asking prices over the past 5 years, using inventory levels on 15 May
Residential
· The lowest price range (under $200,000) has increased each year. In 2010, this price range represented only 14% of residential inventory. Five years later, this price range has more than doubled and now represents 1/3 (32%) of the homes for sale on St Croix
· The second tier ($200,000 to $400,000) has remained consistent over the 5 years at about 30% of total residential inventory.
· Homes listed for more than $400,000 have decreased by 17% over the five year period. In May 2010, 56% of the inventory was listed for more than $400,000. In May 2015, only 39% of residential inventory was listed for more than $400,000.
Condominium
· The lowest price range (under $100,000) has nearly tripled in 5 years. In May 2010, this price range represented just 9% of the inventory, by May 2015, it represents 1/4 (25%) of condo inventory, down from a high of 30% in May 2014
· The second tier ($100,000 to $200,000) has decreased by 11% over the 5 year period, from 50% of all condos for sale in May 2010 to 39% in May 2015.
· The over $200,000 price range has decreased by 5% over the 5 year period, with the largest decrease in inventory occurring in the over $300,000 price range, down 6% from 5 years ago.
Land
· The lowest price range (under $50,000) has increased each year. In 2010, this price range represented only 20% of land inventory. Five years later, this price range has nearly doubled and now represents more than 1/3 (38%) of the lots for sale on St Croix
· The second tier ($50,000 to $100,000) has declined over the 5 year period from 35% in May 2010 to 27% of total land inventory, a decrease of 8%.
· Lots listed for more than $100,000 have decreased 10% over the five year period, from 45% of total inventory in May 2010 to 35% of total land inventory in May 2015.
Information is from MLS and deemed to be reliable, but is not guaranteed.
Prepared by:
Julie San Martin
Team Manager
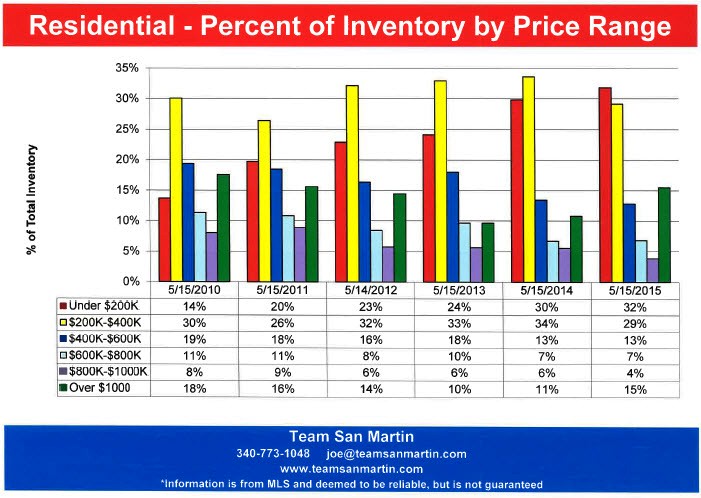
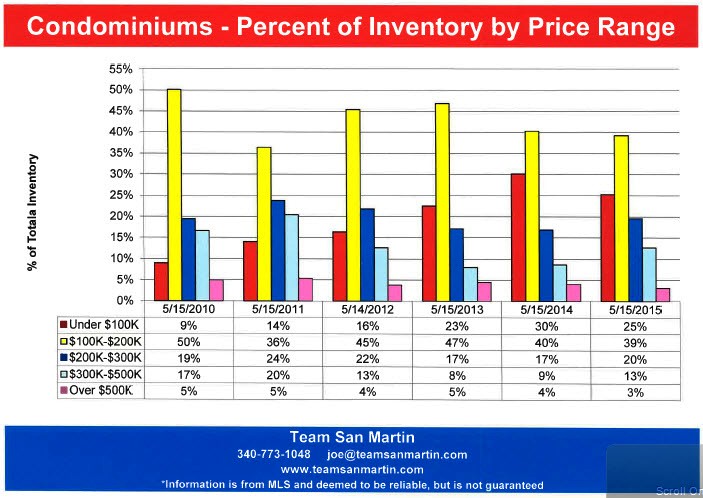
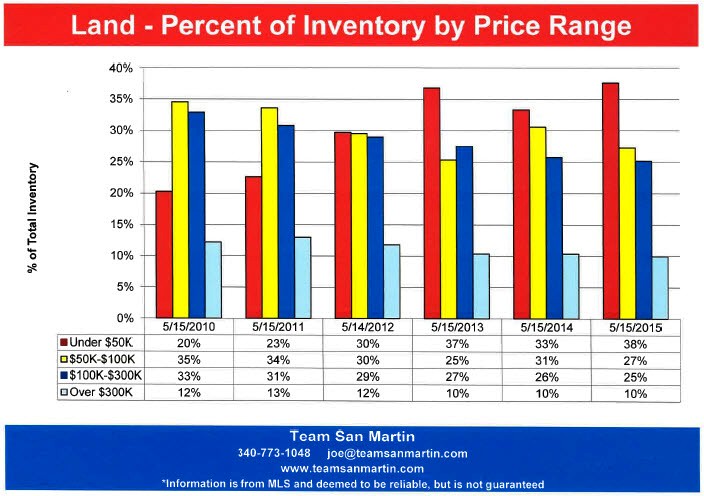
May 2015
Inventory Levels and Sales Projections
May Inventory Levels
5 Year Review
Residential
Inventory is slightly higher (7 homes) than 4 years ago, but lower than the intervening 3 years (50 less than 2012, 42
less than 2013, 12 less than last year)
Condominium
The lowest inventory level in five years! In 2011, there were 60 more condos on the market in May, last year there were
37 more condos for sale in May.
Land
Inventory is lower than 5 years ago, by 66 lots, but higher than last May, by 16 lots.
May Pending Sale Levels
5 Year Review
Residential
There were more pending residential sales in May than in any of the previous 4 years.
Condominium
The number of pending sales in May is similar to the previous two years, but results differed. In 2013, only 68
condominiums were sold, in 2014 a total of 121 condominiums sold.
Land
Pending sales continue to decline; in May 2011 there were 35 pending land sales, in 2012 and 2013 the numbers were
28 and 27, in 2014 pending sales were reduced to 20, and this month there are 23 pending land sales.
2015 Sales Predictions
Using the assumption that the first 4 months of 2015 is a valid predictor for the entire year,
the predictions based on only first quarter sales appear optimistic.
Residential
Using another month of data, the total predicted number of home sales is downgraded by 4% to 135 homes; the
prediction based on 1st quarter sales was 140 homes.
Condominium
Using the first 4 months of the year, predications for 2015 are 114 condominium sales; this would mean that 85% of all
condominiums now for sale will have sold by the end of the year…..probably not, but an interesting prediction. This
number was off in May 2014 also – a total of 87 condominium sales was predicted – the actual number was 121
condominium sales in 2014!
Land
Using another month of data, the total predicted number of lot sales is downgraded by 11% to 63 lots; prediction based
on 1st quarter sales was 80 lots.
Information is from MLS and deemed to be reliable, but is not guaranteed.
Prepared by:
Julie San Martin
Team Manager
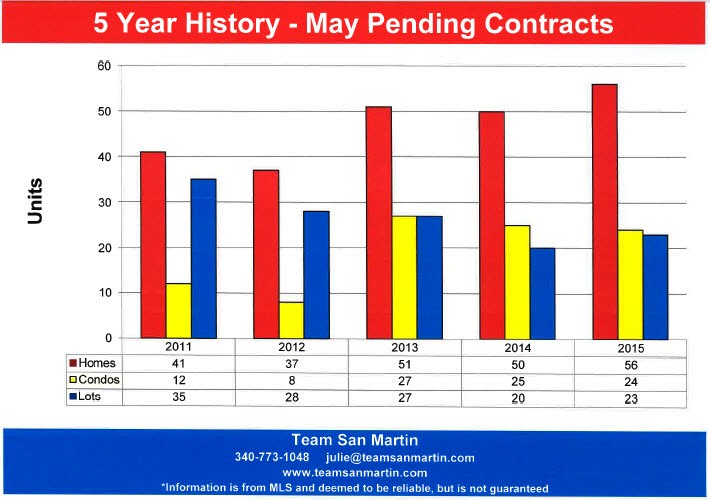
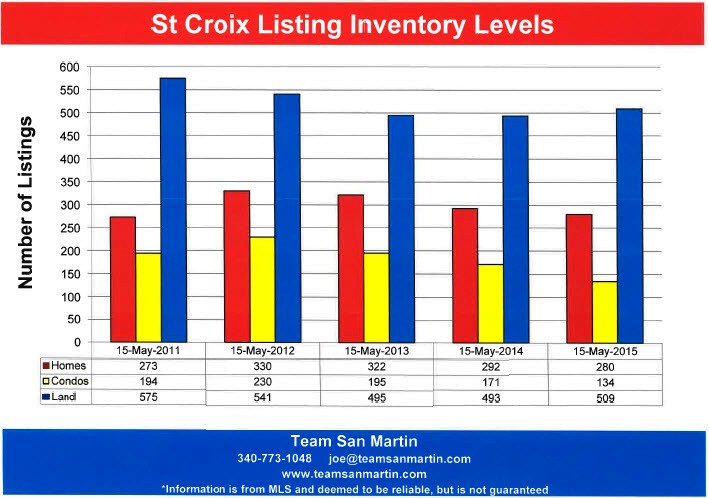
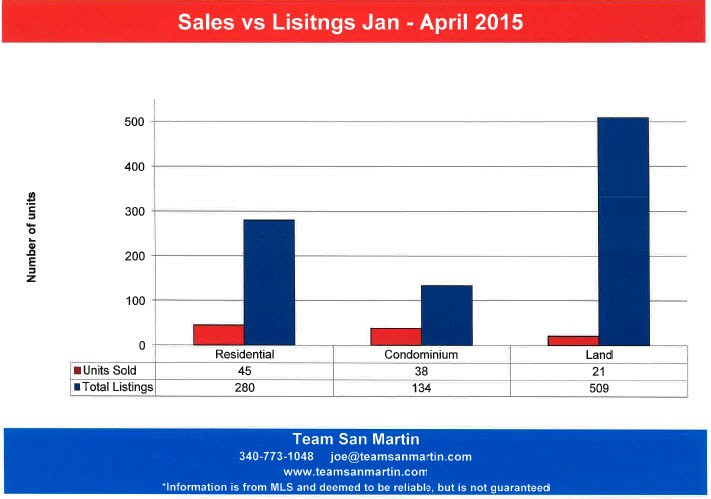
April 2015
1st Quarter Sales as Predictor for the full year
2015 is the 7th year of the St Croix real estate market “recovery” from the real estate boom years of 2006 through 2008.
An obvious questions is – what do the 1st quarter statistics predict about market prospects for the balance of the year?
First, a look at inventory trends over the 7 year period:
· Residential inventory peaked in 2012, at 340 homes for sale, and was at its lowest in 2009, at the beginning of the recovery, with 266 homes for sale
· Condominium inventory peaked in 2010, at 265 condos for sale, and is at its lowest level in seven years, with only 129 condos listed for sale in February 2015.
· Land inventory also peaked in 2010, with 610 land listings, and has remained constant for the past three years, in the 480 to 490 range.
Residential Sales & 2015 Predictions
The number of units sold and the average sales price are consistent, but opposite – units sold under predicts the rest of the year, average sales over predicts, in most cases.
Here is the prediction for 2015 overall:
Total home sales will be in the 140 range, about 10% fewer than in 2014
Average sale price will be in the $340,000 range, about 1% higher than 2014
Condominium Sales & 2015 Predictions
This market will behave differently from the residential and land market.
The majority of available units were constructed from the 1960s through the 1980s; very few units have been built since then.
Inventory was 193 units in February 2014; a total of 121 condos were sold during 2014; this is 63% of the 1st quarter inventory.
2014 also represented the largest number of condominium sales during the six year period by very large margins – two to three times as many units sold during 2014 than during any of the previous 5 years.
With 26 condominium sales in the first quarter of 2015, it is most likely that condominium sales will, again, stall. Also, the average sale price for 1st quarter 2015 was $226,000; this is significantly higher than any year since 2009, and $75,000 above the 2014 average condominium sales price.
Here is the prediction for 2015 overall:
Total condominiums sold will be in the 60 unit range, about 50% fewer than in 2014
Average sale price will be in the $165,000 range, about 10% higher than 2014
Land Sales & 2015 Predictions
The number of lots sold during the 1st quarter has consistently under estimated the total sales for the year over the six year period. If this trend holds, we are seeing the beginning of a recovery in the land market!
Since 2011, the 1st quarter average sales price under estimated the average sales price for the year. But 2015 does not look typical; the 1st quarter average sale price is nearly twice that of the average 1st quarter sale price for 2014.
Here is the prediction for 2015 overall:
Total land sales will be in the 80 lot range, about 30% more than in 2014
Average sale price will be in the $100,000 range, about 30% higher than 2014
Information is from MLS and deemed to be reliable, but is not guaranteed.
Prepared by:
Julie San Martin
Team Manager
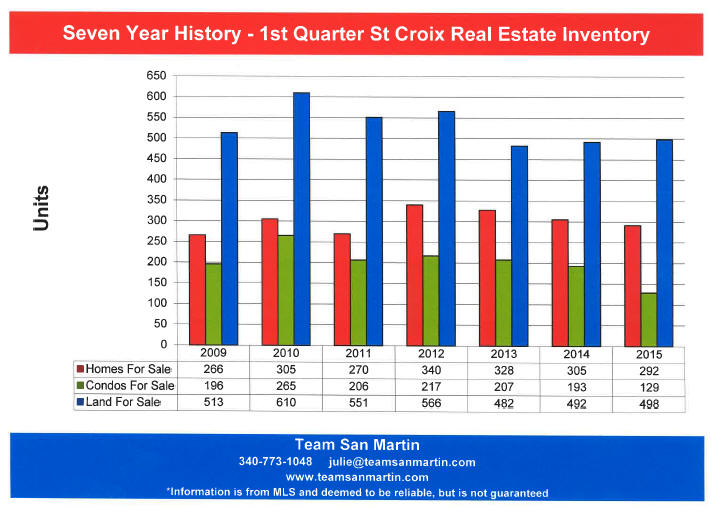
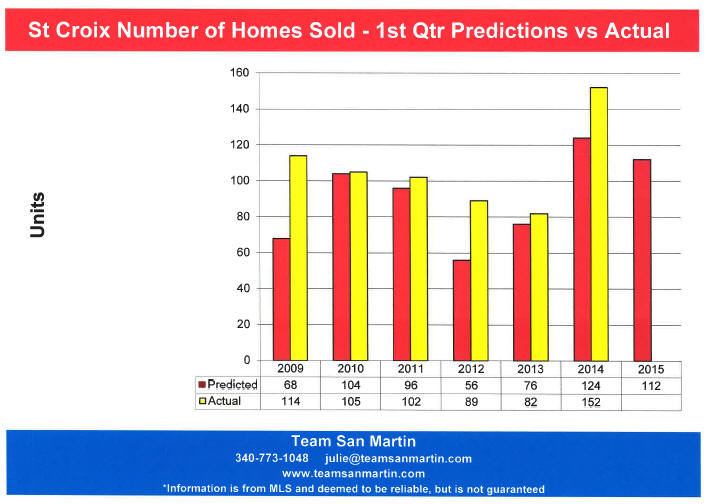
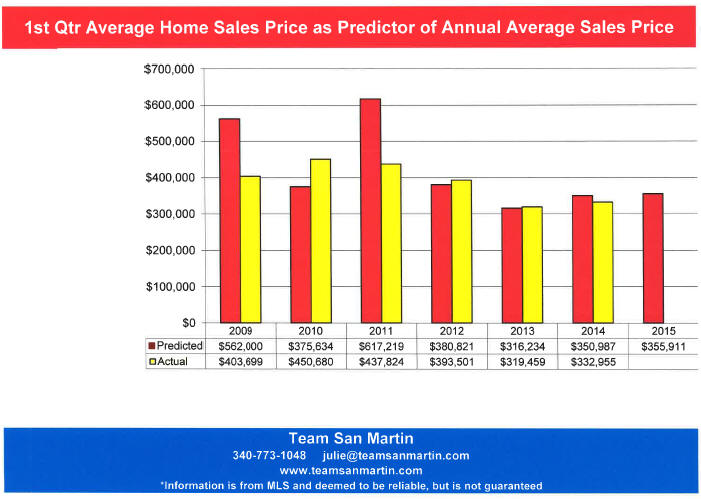
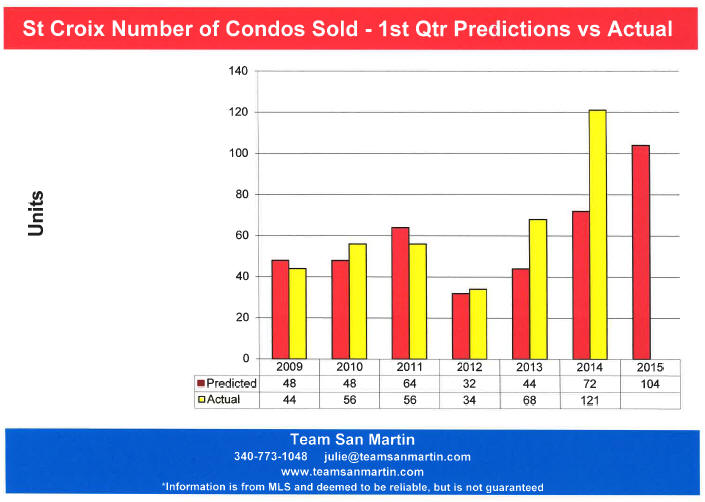
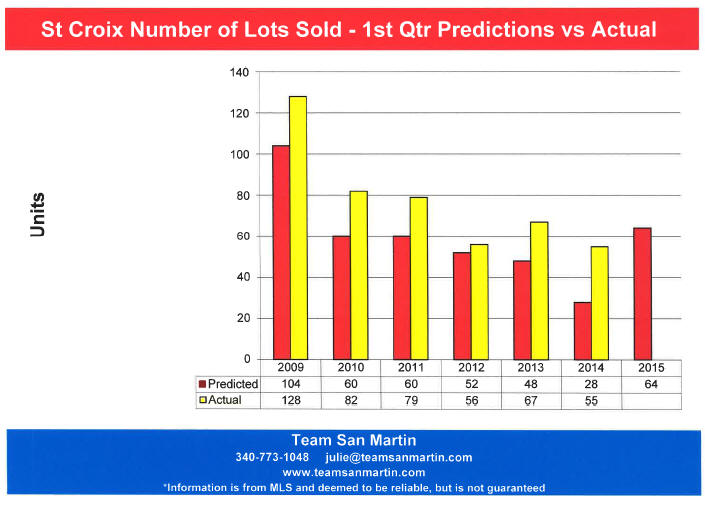
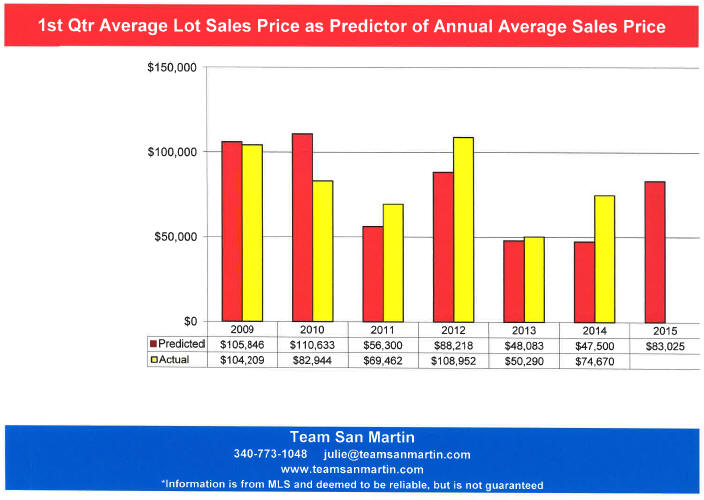
March 2015
Home Sales
St Thomas vs St Croix
A 12 Year Look
Total Number of Properties Sold
· Over the 12 year period, more homes were sold every year on
St Croix than on St Thomas.
· On St Thomas, the most homes were sold during 2004 (118) and the fewest during 2009 (46).
· On St Croix, the most homes were sold during 2006 (188) and the fewest during 2012 (88).
Market recovery is similar:
· 2014 St Thomas sales were 83% of 2003 total home sales.
· 2014 St Croix sales were 88% of total 2003 home sales.
Average Sales Price
· Over the 12 year period, the average St Thomas home sale price always exceed the St Croix average home sale price.
· 2003 was the year with the most similar average sales price; $416,000 on St Thomas and $415,000 on St Croix
· 2014 was the year with the largest discrepancy in home sale prices; the average home sales price on St Thomas ($902,209) was nearly 3 times that of the average sales price of a home on St Croix ($332,955)
· For 2014, the average sales price of a home on St Thomas was more than twice the 2003 average St Thomas home sale price of $416,000
· For 2014, the average sales price of a home on St Croix was only 80% of the average 2003 St Croix home sale price
What accounts for this large discrepancy in home sale prices?
· On St Thomas, 23 homes (24% of all 2014 home sales) sold for $1,000,000 or more
· On St Croix, only 3 homes (2% of all 2014 home sales) sold for $1,000,000 or more
Total Market in Millions of Dollars
· This measurement is a combination of total properties sold and sales price, so it gives the best overview of market performance
· For 8 years (2003 – 2007 and 2009 - 2011) the total St Croix residential market exceeded the total St thomas residential market; the largest discrepancies were in 2003 and 2009, when the total ST Croix market exceed St Thomas by approximately 30%
· For 4 years (2008 and 2012 -2014), the total St Thomas market has exceed the total St Croix market, with the largest difference in 2014, when St Thomas exceeded St Croix by 70%
Information is from MLS and deemed to be reliable, but is not guaranteed.
Prepared by:
Julie San Martin
Team Manager

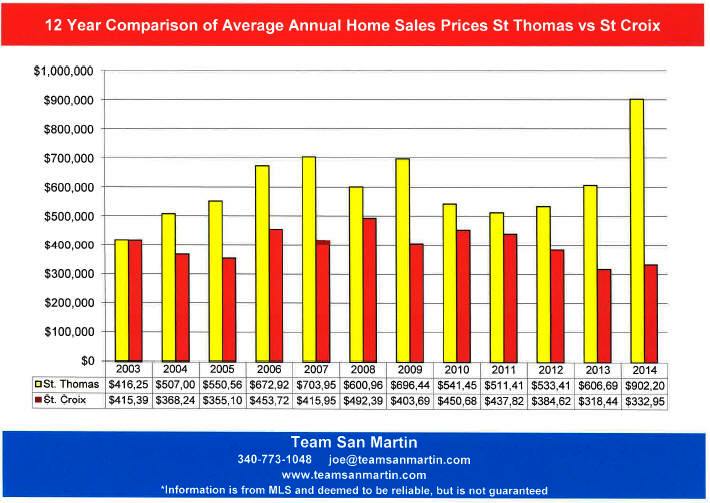
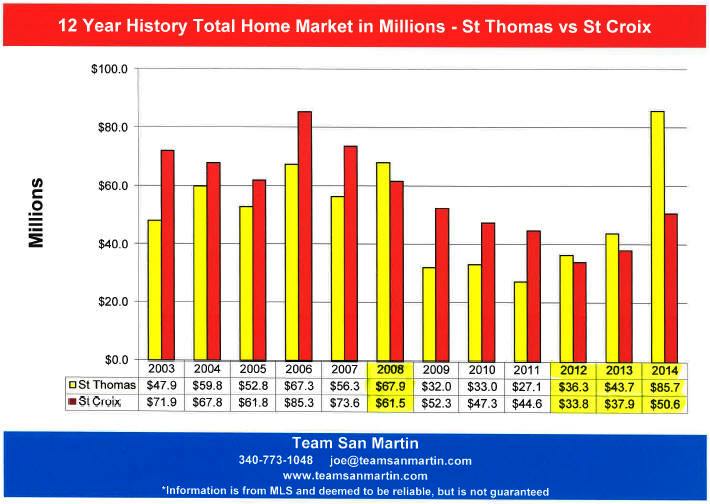
February 2015
The St Croix Real Estate Cycle
A 12 Year Look
Total Number of Properties Sold
· Homes and condominiums are showing a strong recovery in the total number of properties sold.
· Home sales have rebounded to pre-2008 levels; more homes were sold on St Croix during 2014 (152) than in any year since 2007 – seven years ago!
· Condominiums performed even better – more condos were sold during 2014 (121) than in any year since 2006 – eight years ago!
· Land sales have not yet recovered; fewer lots were sold during 2014 (55) than during any of the previous 11 years.
Average Sales Price
· This is where the effect of the market downturn shows
· The average sales price of a home during 2014 was $332,950; better than 2013 but worse than 2003 through 2013 and $160,000 lower than at the height of the market in 2008 ($492,390).
· The 2014 average condominium sales price was $149,730. This is higher than the average condominium sales price during 2003 and 2004, but lower than the average price of a condominium on St Croix from 2005 through 2013.
· The one area that the land market has performed well in is the average sale price, which was $74,670 for 2014. This exceeds 2011 and 2013, but lags behind 2003 through 2010 and 2012.
Total Market in Millions of Dollars
· This measurement is a combination of total properties sold and sales price, so it gives the best overview of market performance
· This graph shows the clear market recovery in home and condominium sales, starting in 2012 and continuing through 2014.
· This measurement also clearly shows that there has not yet been a recovery in land sales.
Information is from MLS and deemed to be reliable, but is not guaranteed.
Prepared by:
Julie San Martin
Team Manager
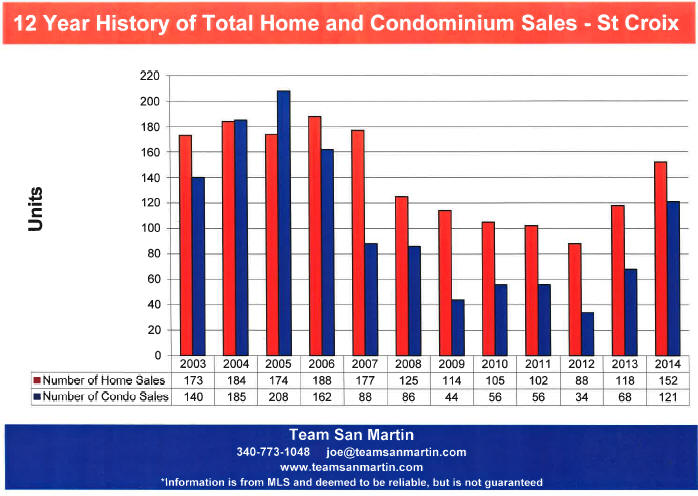
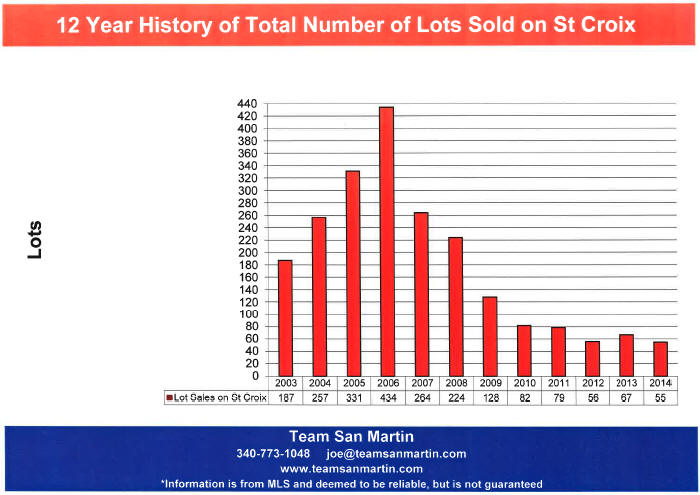
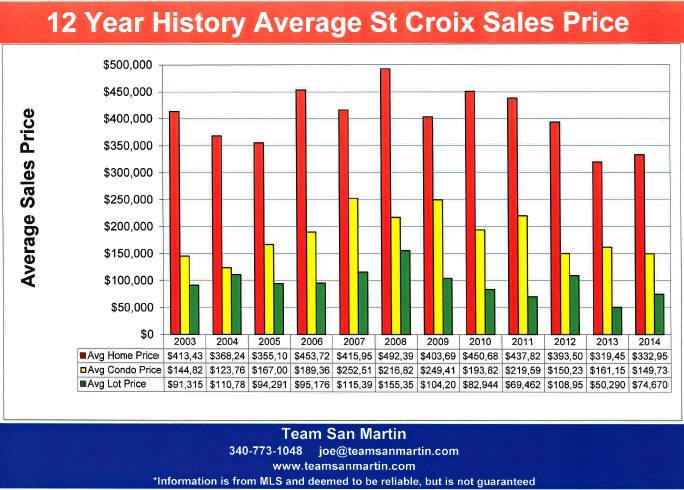
January 2015
3 Year Home Sales Price Trends
Over all, the average sale price of a home on St Croix has decreased by nearly $60,000 (15%) since 2012.
At the same time, the number of homes sold annual has increased by 40% (62 homes)
All areas of the island did not perform the same
East End B
Far East End
Over the 3 year period (2012 through 2014), the average home sale price decreased by $269,000 (40%) and the number of homes sold increased 56%; 12 homes sold in 2012, 27 homes sold in 2014
East End A
Christiansted East to Coakley Bay
Over the 3 year period (2012 through 2014), the average home sale price decreased by $454,839 (53%) and the number of homes sold increased 64%; 10 homes sold in 2012, 28 homes sold in 2014
.
Company
Christiansted West to the East Side of Judiths Fancy
Over the 3 year period (2012 through 2014), the average home sale price increased by $74,000 (27%) and the number of homes sold increased 38%; 15 homes sold in 2012, 24 homes sold in 2014
King
South Shore from La Reine West to UVI
Over the 3 year period (2012 through 2014), the average home sale price increased by $41,000 (30%) and the number of homes sold increased 67%; 2 homes sold in 2012, 6 homes sold in 2014
.
Northside A & B
North Shore from North Judiths Fancy to Hams Bluff
Over the 3 year period (2012 through 2014), the average home sale price increased by $88,000 (16%) and the number of homes sold increased 24%; 13 homes sold in 2012, 17 homes sold in 2014
Prince
South Shore from UVI West to Williams Delight
Over the 3 year period (2012 through 2014), the average home sale price decreased by $117,000 (46%) and the number of homes sold increased 64%; 5 homes sold in 2012, 14 homes sold in 2014
Queen
Constitution Hill West to La Reine, includes South West Judiths Fancy
Over the 3 year period (2012 through 2014), the average home sale price increased by $51,000 (18%) and the number of homes sold decreased 14%; 22 homes sold in 2012, only 19 homes sold in 2014
West End
South Shore, south from Mahogany Road, East to Williams Delight
Over the 3 year period (2012 through 2014), the average home sale price increased by $47,000 (19%) and the number of homes sold increased 33%; 10 homes sold in 2012, 15 homes sold in 2014
Observations
Home sale prices in three areas of the island consistently exceed the average home sales price:
· East End B
· East End A
· Northside A & B
Number of homes sold, comparing 2012 to 2014, increased island wide except for Queen Quarter, where the number of homes sold decreased by 14% over the three year period, corresponding to an increase in average home sales price.
Average home sale price increased in all areas of the island where the average home sale price lags behind the island wide average – and Northside A & B (there was a $1.68 million home sale during 2014)
Information is from MLS and deemed to be reliable, but is not guaranteed.
Prepared by:
Julie San Martin
Team Manager
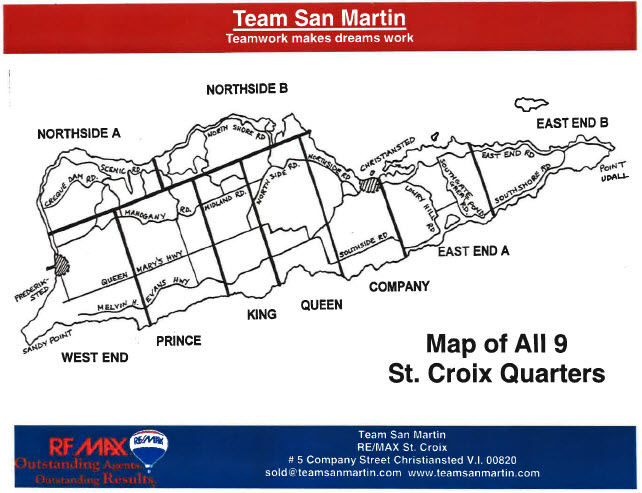
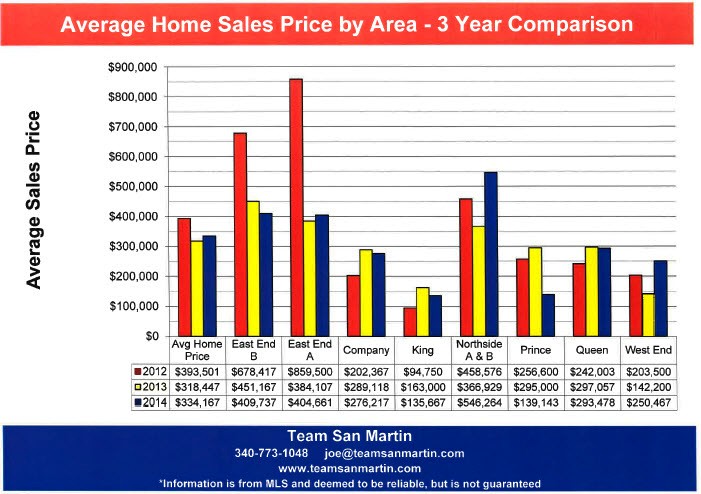

December 2014
Inventory Level Trends
Current Annual Supply represents the number of years it will take at the current rate of sales to sell all the properties listed in a specific area (Quarter) of St Croix
[Active Listings + Pending Listings] /
Number of Listings Sold During the Previous 12 Months
For example, in November 2014, there were 27
active and 4 pending home sales in East End B, with 25 home sales in the
previous 12 months, for a 1.2 year supply of homes for sale
[27 + 4] / 25 = 1.2 Years
East End B
Far East End
Residential inventory increased by one year between November 2011 and 2012. November 2013 inventory was 50% of the November 2012 inventory level. November 2014 residential inventory decreased by 7 months from November 2013 and was, once again, the fastest selling residential inventory on the island.
Condominium inventory doubled between November 2011 and 2012, then decreased three years by November 2013, followed by a 1 year decrease for the twelve months ending November 2014, to less than one year, becoming the fastest selling condominium inventory on the island.
Land is selling almost 10 months slower than three years ago, from 8.2 years in November 2011 to 9 years in November 2014. The intervening two years were slightly better, at a 6 year inventory level.
East End A
Christiansted East to Coakley Bay
Residential inventory doubled between November 2011 and 2012, then decreased 3 years by November 2013 with a further 6 month decrease by November 2014, for slightly under a 2 year supply of residential inventory in November 2014
Condominium inventory increased slightly between November 2011 and 2012, then increased more than 6 years by November 2013, and has decreased by 8 years in the past 12 months, for a 1.4 year supply of condominiums for sale.
Land inventory was 5 years in November 2011, swelled to 24 years by November 2012, dropped back to 5 years by November 2013 and then increased 3 years by November 2014, for an 8.6 year supply of lots for sale.
Company
Christiansted West to the East Side of Judiths Fancy
Residential inventory was 7 years for the twelve months ending November 2011. By November 2012, inventory had decreased by more than 50%, to 3 years, where it remained through November 2013. By November 2014, residential inventory had decreased by an additional year, to 1.8 years.
Condominium inventory more than tripled between November 2011 and 2012, decreased by two thirds to 3.5 years by November 2013, with a further decrease of 2 years to a 1.2 year inventory level in November 2014.
Land inventory nearly doubled between November 2011 and 2012. No land sales closed during the twelve months ending November 2013 and only 1 land sale closed in the following 12 months, for a 43 year inventory level of land for sale in November 2014
Queen
Constitution Hill West to La Reine, includes South West Judiths Fancy
Residential inventory has changed little over the four year period, averaging 2.7 years of inventory. Lowest residential inventory was in the 12 months ending November 2013 (2.2 years), highest was the 12 months ending November 2012 (3.3 years)
Condominium inventory doubled between November 2011 and 2012. By November 2013, inventory had fallen more than 8 years, to a 3 year supply. The twelve months ending November 2014 saw a further reduction of 2 years; current inventory is a 1.2 year supply of condominiums.
Land inventory was 16 years for the twelve months ending November 2011. By November 2012, inventory had decreased by more than 50%, to 7.2 years. November 2012 showed a 2 year increase, the following twelve months showed a 2.5 year decrease for a current inventory level of 6.6 years.
Northside A & B
North Shore from North Judiths Fancy to Hams Bluff
Residential inventory decreased slightly between November 2011 and 2012, then more than tripled to 7.8 for the twelve months ending November 2013. During the past twelve months, inventory has fallen by 6.5 years to a near market low of 1.3 years.
Condominium inventory was 5 years for the twelve months ending November 2011, then more than doubled to 11 years by November 2012. For the past two years, inventory levels have fallen by almost ten years to a respectable 1.5 year condominium inventory level.
Land inventory is exactly the same as four years ago (14 years), after decreasing slightly between November 2011 and 2012, to 11 years, then increasing substantially to 19 years for the twelve months ending 2013.
King
South Shore from La Reine West to UVI
Residential inventory is nearly the same as four years ago (3.4 years), after increasing to four times the current value (12 years) for the twelve months ending November 2013.
There are no condominium complexes in King Quarter.
No land sales were reported for the twelve months ending November 2011 and 2014. Two lots sold during the twelve months ending November 2012 and 5 lots sold during the twelve months ending November 2013.
Prince
South Shore from UVI West to Williams Delight
Residential inventory doubled between November 2011 and 2012, from 2.6 years to 6.8 years. In the twelve months ending November 2012, inventory levels fell by three years and by another 8 months during the following twelve months, to a 2 years inventory level for the period ending November 2014.
Condominium inventory levels are exactly the same as four years ago – 3.7 years. No condominiums were sold during the twelve months ending November 2012; five condominiums were sold during the following twelve months.
Land inventory in Prince Quarter has remained unchanged over the past four years, averaging 9.6 years of inventory.
West End
South Shore, south from Mahogany Road, East to Williams Delight
Residential inventory was 3 years for the twelve month periods ending November 2011 and 2013. The twelve months ending November 2012 saw a two year increase in inventory and the twelve months ending November 2014 saw an eight month increase in residential inventory to a 3.7 year supply of homes on the market.
Condominium inventory was slightly over 2 years for the twelve months ending November 2011 and slightly under two years for the twelve months ending November 2014. No condominiums were sold in West End Quarter for the twelve months ending November 2012; three condominiums were sold during the twelve months ending November 2013.
Land inventory levels for the twelve months ending November 2011 and 2012 was 10 years, then dropped by half to 5.6 years for the twelve months ending November 2012. The past twelve months have not been good for land sales in West End; current inventory level is 24 years (there are 95 active and pending lots, with 4 land sales closed in the previous twelve months).
Information is from MLS and deemed to be reliable, but is not guaranteed.
Prepared by:
Julie San Martin
Team Manager
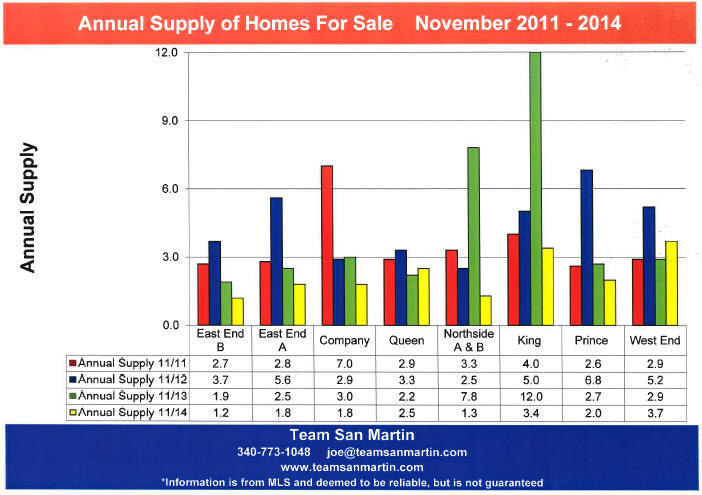
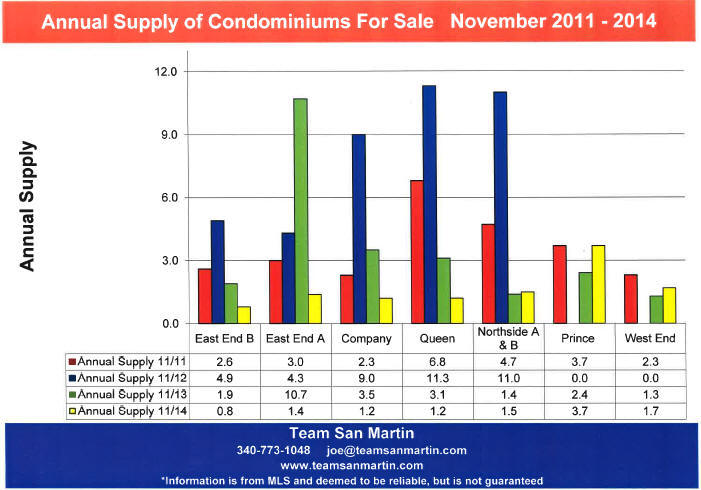
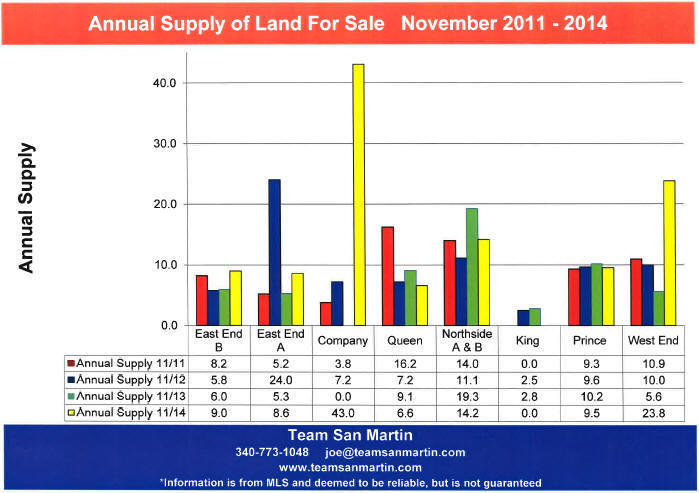
November 2014
Which St Croix Price Ranges are Selling?
First 10 months of 2014
Residential
134 home sales closed in the first 10 months of 2013
There are 308 homes for sale
Approximately 2.3 sellers for every buyer
Condominium
101 condominium sales closed in the first 10 months of 2013
There are 154 condominiums for sale
Approximately 1.5 sellers for every buyer
Vacant Land
37 land sales closed in the first 10 months of 2013
There are 522 lots for sale
Approximately 14.1 sellers for every buyer
INVENTORY BY PRICE RANGE
Residential
31% (42 homes) of all closed sales were under $200,000
37% of the inventory (115 homes) is listed for under $200,000
There are 2.7 sellers for every buyer in this price range
The average discount was 16% from asking price
36% (48 homes) of all closed sales were between $200,001 and $400,000
30% of the inventory (93 homes) is listed between $200,001 and $400,000
There are 1.9 sellers for every buyer in this price range
The average discount was 9% from asking price
18% (24 homes) of all closed sales were between $400,001 and $600,000
9% of the inventory (27 homes) is listed between $400,001 and $600,000
There are 1.1 sellers for every buyer in this price range
The average discount was 9% from asking price
10% (14 homes) of all closed sales were between $600,001 and $800,000
8% of the inventory (24 homes) is listed between $600,001 and $800,000
There are 1.7 sellers for every buyer in this price range
The average discount was 9% from asking price
3% (4 homes) of all closed sales were between $800,001 and $1 Million
4% of the inventory (12 homes) is listed between $800,001 and $1 Million
There are 3 sellers for every buyer in this price range
The average discount was 15% from asking price
1% (2 homes) of all closed sales were for more than $1 Million
12% of the inventory (37 homes) is listed for more than $1 Million
There are 18.5 sellers for every buyer in this price range
The average discount was 3% from asking price
Condominium
38% (38 condos) of all closed sales were under $100,000
25% of the inventory (38 condos) is listed for under $100,000
There is 1 seller for every buyer in this price range
The average discount was 12% from asking price
43% (43 condos) of all closed sales were between $100,001 and $200,000
45% of the inventory (69 condos) is listed between $100,001 and $200,000
There are 1.6 sellers for every buyer in this price range
The average discount was 11% from asking price
13% (13 condos) of all closed sales were between $200,001 and $300,000
15% of the inventory (23 condos) is listed between $200,001 and $300,000
There are 1.8 sellers for every buyer in this price range
The average discount was 7% from asking price
6% (6 condos) of all closed sales were between $300,001 and $500,000
12% of the inventory (18 condos) is listed between $300,001 and $500,000
There are 3 sellers for every buyer in this price range
The average discount was 7% from asking price
1% (1 condo) of all closed sales were for more than $500,000
4% of the inventory (6 condos) is listed for more than $500,000
There are 6 sellers for every buyer in this price range
The average discount was 13% from asking price
Vacant Land
68% (25 lots) of all closed sales were under $50,000
35% of the inventory (182 lots) is listed for under $50,000
There are 7.3 sellers for every buyer in this price range
The average discount was 16% from asking price
22% (8 lots) of all closed sales were between $50,001 and $100,000
28% of the inventory (148 lots) is listed between $50,001 and $100,000
There are 18.5 sellers for every buyer in this price range
The average discount was 21% from asking price
8% (3 lots) of all closed sales were between $100,001 and $300,000
27% of the inventory (139 lots) is listed between $100,001 and $300,000
There are 46.3 sellers for every buyer in this price range
The average discount was 8% from asking price
3% (1 lot) of all closed sales were for more than $300,000
10% of the inventory (53 lots) is listed for more than $300,000
There are 53 sellers for every buyer in this price range
The average discount was 49% from asking price
Information is from MLS and deemed to be reliable, but is not guaranteed.
Prepared by:
Julie San Martin
Team Manager
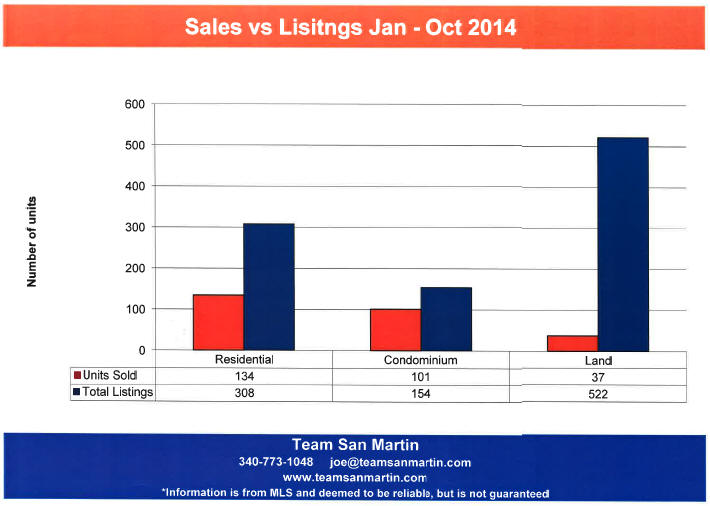
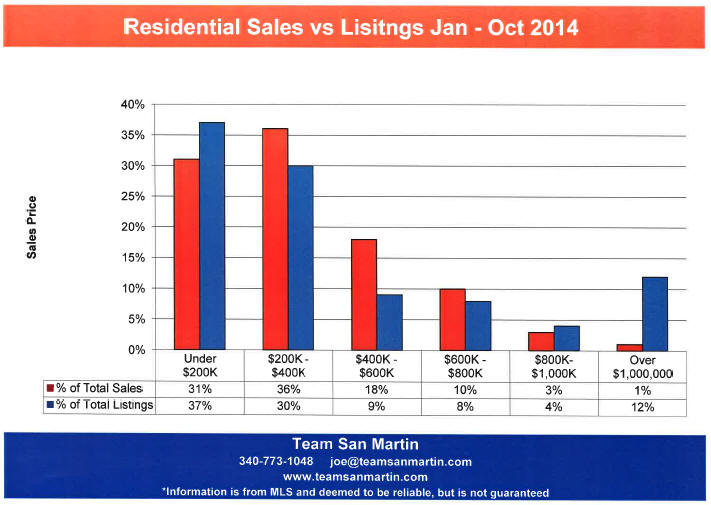
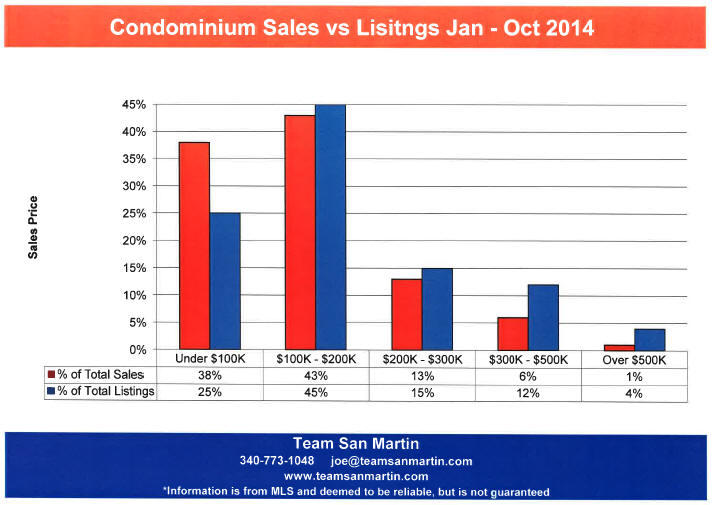
October 2014
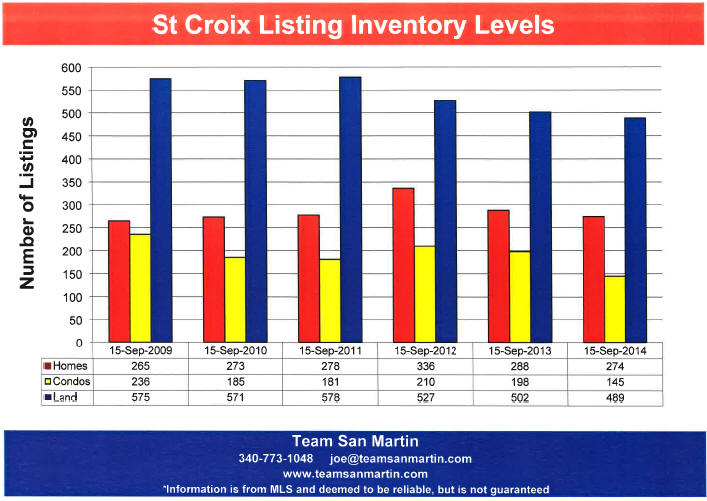
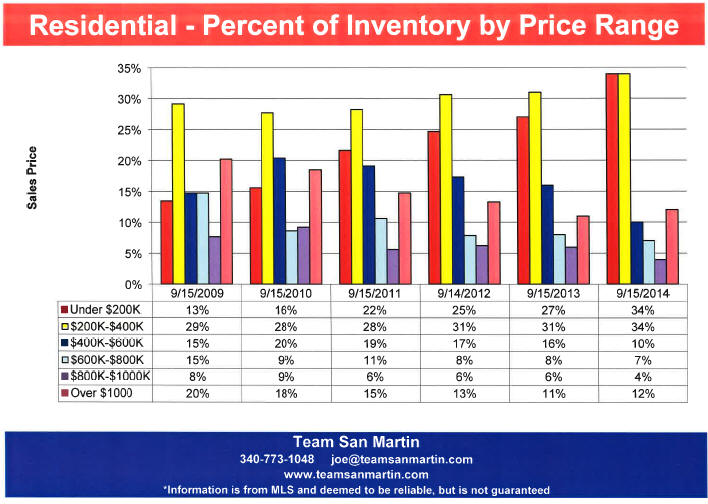

September 2014
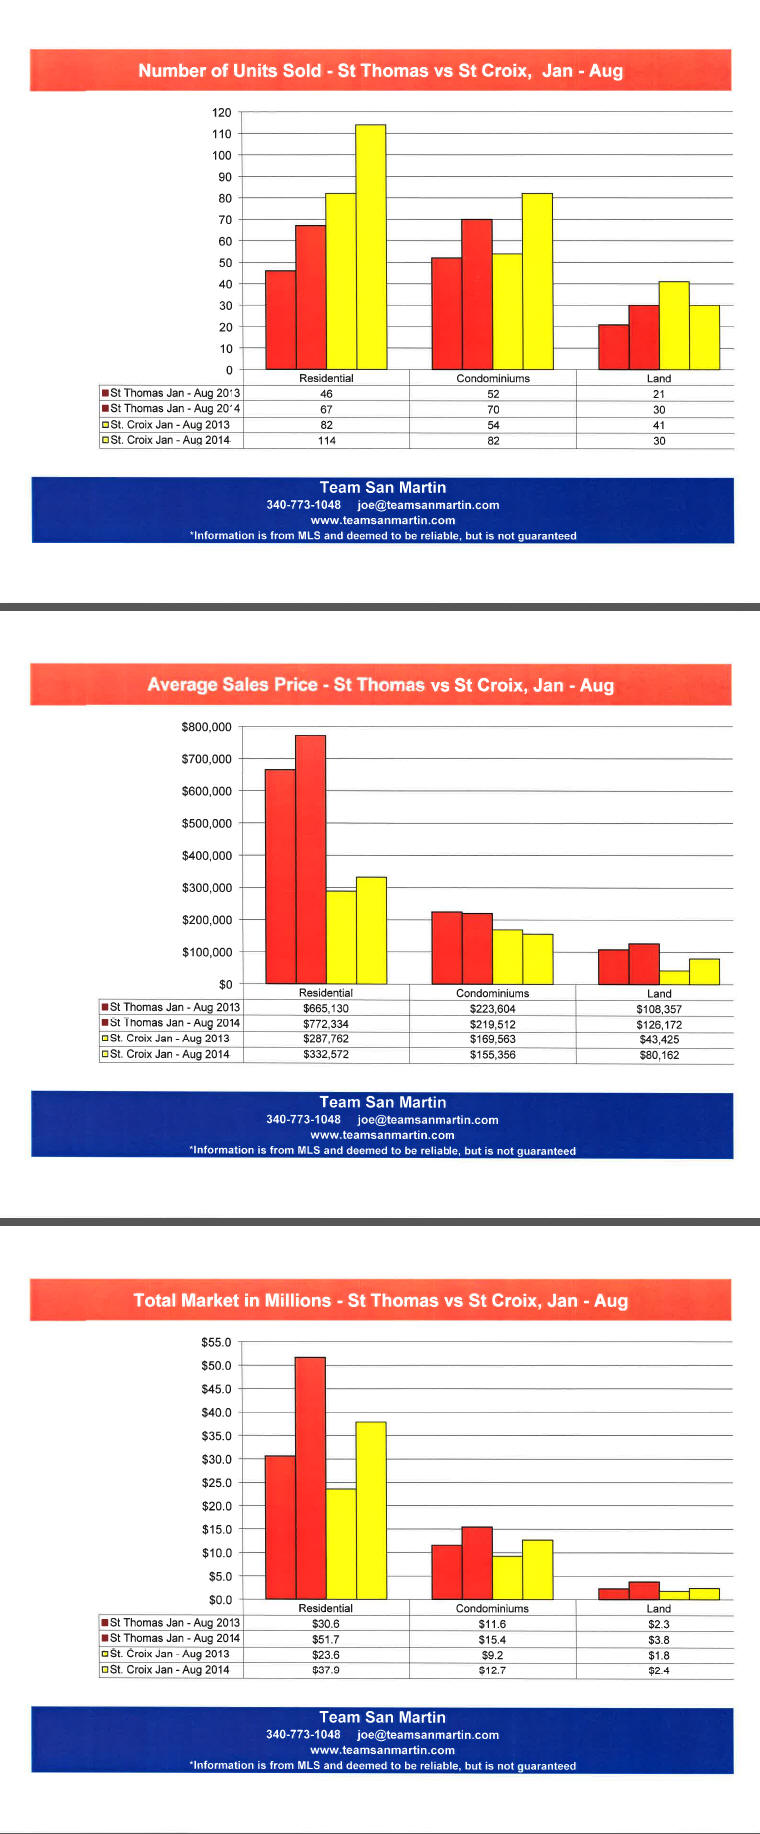
August 2014
The relationship between sales price and marketing time on St Croix
Annual supply represents the number of years it will take at the current annual rate of sales to sell all the properties for sale in a specific area.
East End B
Far East End
Three years ago, there was a 4.7 year supply of homes and a
4.3 year supply of condominiums for sale.
At the end of July 2014, there was a 1.4 year supply of homes (a decrease of 3 years marketing time) and also a 1.4 year supply of condominiums (again, a decrease of nearly 3 years marketing time).
What happened to average sales price over the three year period?
The average price of a home in East End B decreased by $168,000,
from $576,000 for the period of 6/11 through 7/12
to $408,000 for the period of 7/13 – 7/14.
The decrease in average sales price of a condominium was $186,000,
from $382,000 for the period of 6/11 through 7/12
to $196,000 for the period of 6/13 – 7/14.
East End A
Christiansted east to Coakley Bay
Three years ago, there was a 4.2 year supply of homes and a 4.8 year supply of condominiums for sale.
At the end of July 2014, there was a 2 year supply of homes (a decrease of 2 years marketing time) and a 3.8 year supply of condominiums (a decrease of only 1 year marketing time)
What happened to average sales price over the three year period?
The average price of a home in East End A decreased by only $71,000,
from $482,000 for the period of 6/11 through 7/12
to $411,000 for the period of 6/13 – 7/14.
The average sales price of a condominium increased by $13,000,
from $205,000 for the period of 6/11 through 7/12
to $218,000 for the period of 6/13 – 7/14.
Company
Christiansted west to east side of Judiths Fancy
Three years ago, there was a 3.7 year supply of homes and a 5.9 year supply of condominiums for sale.
At the end of July 2014, there was a 1.9 year supply of homes (a decrease of nearly 2 years marketing time) and a 1.8 year supply of condominiums (a decrease of more than 4 years marketing time)
What happened to average sales price over the three year period?
The average price of a home in Company Quarter increased by $97,000, from $191,000 for the period of 6/11 through 7/12
to $288,000 for the period of 6/13 – 7/14.
The average sales price of a condominium decreased by $3,000,
from $106,000 for the period of 6/11 through 7/12
to $103,000 for the period of 6/13 – 7/14.
Queen
Constitution Hill west to La Reine, includes southwest Judiths Fancy
Three years ago, there was a 3.1 year supply of homes and an 8.3 year supply of condominiums for sale.
At the end of July 2014, there was a 2.7 year supply of homes (negligible change) and a 1.1 year supply of condominiums (a decrease of more than 7 years marketing time)
What happened to average sales price over the three year period?
The average price of a home in Queens Quarter decreased by only $3,000, from $291,000 for the period of 6/11 through 7/12
to $288,000 for the period of 6/13 – 7/14.
The average sales price of a condominium increased by $5,000,
from $75,000 for the period of 6/11 through 7/12
to $80,000 for the period of 6/13 – 7/14.
Northside A & B
North Shore from north Judiths Fancy to Hamms Bluff
Three years ago, there was a 4.6 year supply of homes and a 6.5 year supply of condominiums for sale.
At the end of July 2014, there was a 1.5 year supply of homes (a decrease of 3 years) and a 2.4 year supply of condominiums
(a decrease of 4 years marketing time)
What happened to average sales price over the three year period?
The average price of a home in Northside A & B Quarters increased by $53,000, from $459,000 for the period of 6/11 through 7/12
to $512,000 for the period of 6/13 – 7/14;
(a $1,650,000 recent sale has skewed the data).
The average sales price of a condominium decreased by $105,000,
from $345,000 for the period of 6/11 through 7/12
to $240,000 for the period of 6/13 – 7/14.
King
South Shore from La Reine west to UVI
Three years ago, there was a 3.8 year supply of homes on the market;
at the end of July 2014,
there was 3.4 year supply (no change in marketing time).
There are no condominium complexes in King Quarter.
What happened to average sales price over the three year period?
The average price of a home in King Quarter decreased by $79,000,
from $207,000 for the period of 6/11 through 7/12
to $128,000 for the period of 6/13 – 7/14.
Prince
South Shore from UVI west to Williams Delight
Three years ago, there was a 5.8 year supply of homes and
an 11 year supply of condominiums for sale
At the end of July 2014, there was a 2.7 year supply of homes (a decrease of 3 years) and a 4.3 year supply of condominiums
(a decrease of nearly 7 years marketing time)
What happened to average sales price over the three year period?
The average price of a home in Prince Quarter decreased by $1,000,
from $208,000 for the period of 6/11 through 7/12
to $207,000 for the period of 6/13 – 7/14.
The average sales price of a condominium decreased by $256,000,
from $415,000 for the period of 6/11 through 7/12
to $159,000 for the period of 6/13 – 7/14.
West End
South from Mahogany Road, east to Williams Delight
Three years ago, there was a 4.6 year supply of homes and
a 7 year supply of condominiums for sale
At the end of July 2014, there was a 4.2 year supply of homes (no change in time in the market) and a 3 year supply of condominiums
(a decrease of 4 years marketing time)
What happened to average sales price over the three year period?
The average price of a home in West End Quarter increased by $38,000, from $164,000 for the period of 6/11 through 7/12
to $202,000 for the period of 6/13 – 7/14.
The average sales price of a condominium increased by $30,000 over the three year period, from $62,000 for the period of 6/11 through 7/12
to $92,000 for the period of 6/13 – 7/14.
Conclusions
While the overall market activity has increased,
buyers are price conscious and well informed on local market conditions.
Information is from MLS and deemed to be reliable, but is not guaranteed.
Prepared by:
Julie San Martin
Team Manager
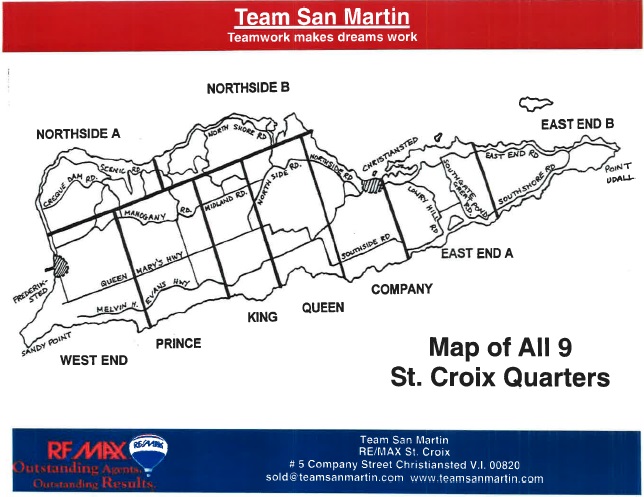
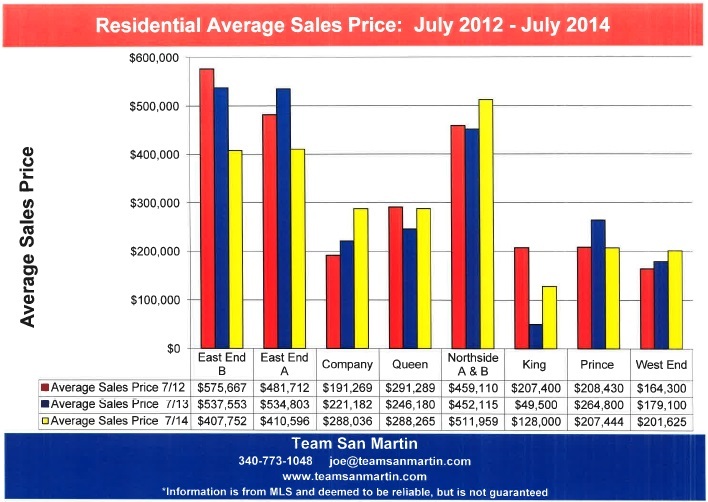
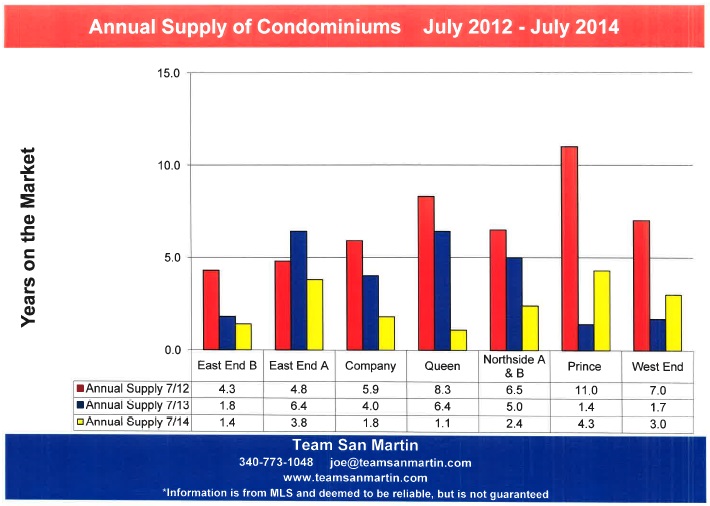
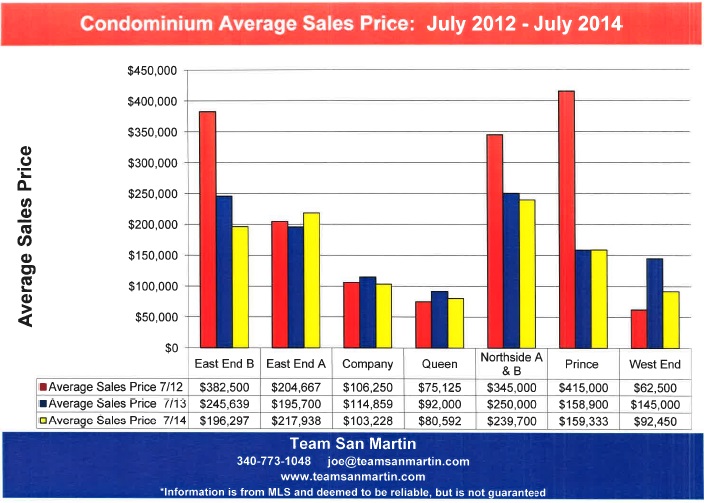
July 2014
10 Year History
St Croix Real Estate Market
July - June
Comparing this 12 month period (July 2013 – June 2014) to
10 years ago (July 2004 – June 2005)
TOTAL UNITS SOLD
· Total number of homes sold declined 22%, from 187 to 147
· Total number of condominiums sold declined 54%, from 175 to 80
· Total number of lots sold declined 76%, from 268 to 63
AVERAGE SALES PRICE
· Average home sale price is $1,000 more than 10 years ago, from $335,000 to $336,000.
· Average condominium sale price increased 12%, from $131,000 to $146,000
· Average lot sale price declined 29%, from $98,000 to $69,000
TOTAL MARKET
· Total home sales market declined 22%, from $62.7 million to $49.1 million
· Total condominium sales market declined 49%, from $23 million to $11.7 million
· Total land sales market declined 83%, from $26.2 million to $4.4 million
SOME COMPARISONS
Residential
10 years ago, the highest sales price was $2,050,000 and
the lowest $10,000
For the past 12 months, the highest home sale price was $1,680,000 and the lowest $35,000
Condominium
10 years ago, the highest sales price was $665,225 and
the lowest $10,000
For the past 12 months, the highest condominium sale price was $775,000 and the lowest $30,000
Land
10 years ago, the highest sales price was $3,750,000 and
the lowest $8,000
For the past 12 months, the highest land sale price was $970,000 and the lowest $8,000
The highest grossing 12 month period during the past 10 years was:
July 2005 through June 2006
· Residential sales of $93.6 million
· Condominium sale of $40.1 million
· Land sales of $45.6 million
The 12 month period with the lowest level of sales over the past 10 years was:
· July 2011 through June 2012 for residential and condominium sales
· July 2012 through June 203 for land sales
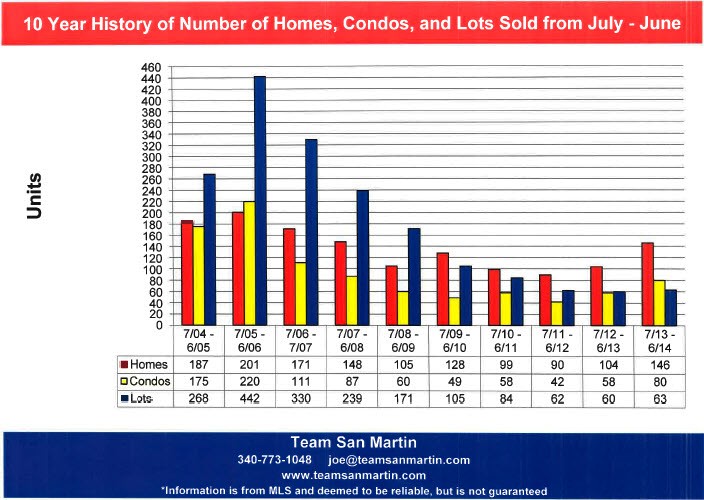
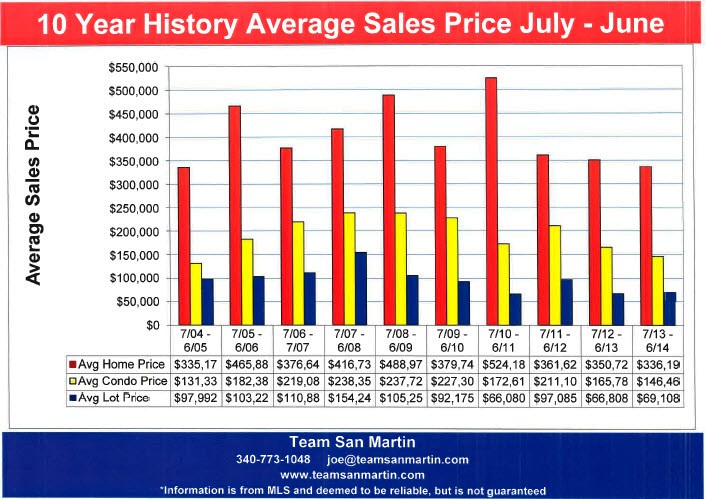
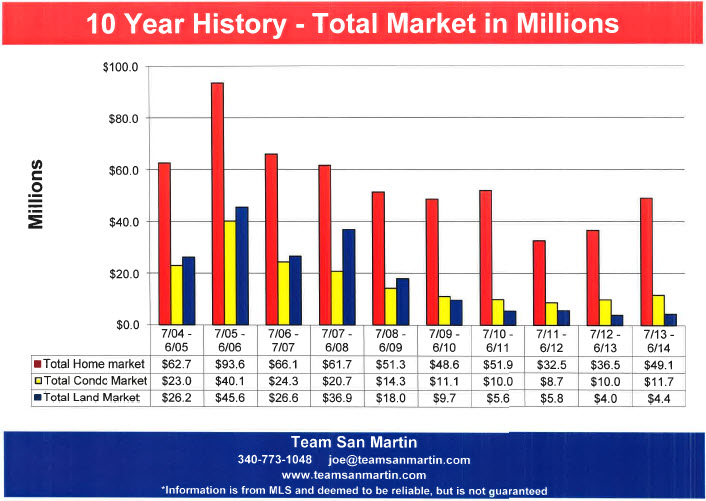
June 2014
Changes in the St Croix Real Estate Market
Inventory levels by price range reflect sellers’ expectations. The attached graphs compare changes in asking prices over the past 4 years, using inventory levels on 15 May.
RESIDENTIAL
CONDOMINIUM
LAND
Information is from MLS and deemed to be reliable, but is not guaranteed.
Prepared by:
Julie San Martin
Team Manager
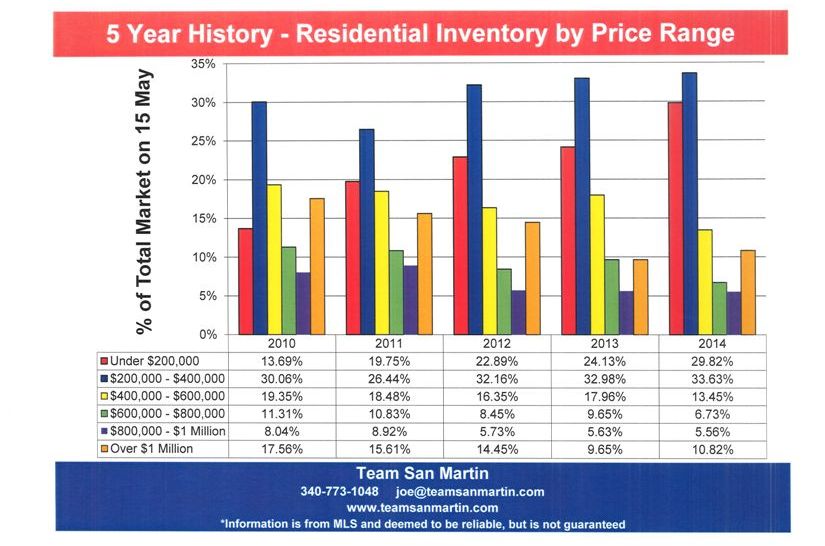
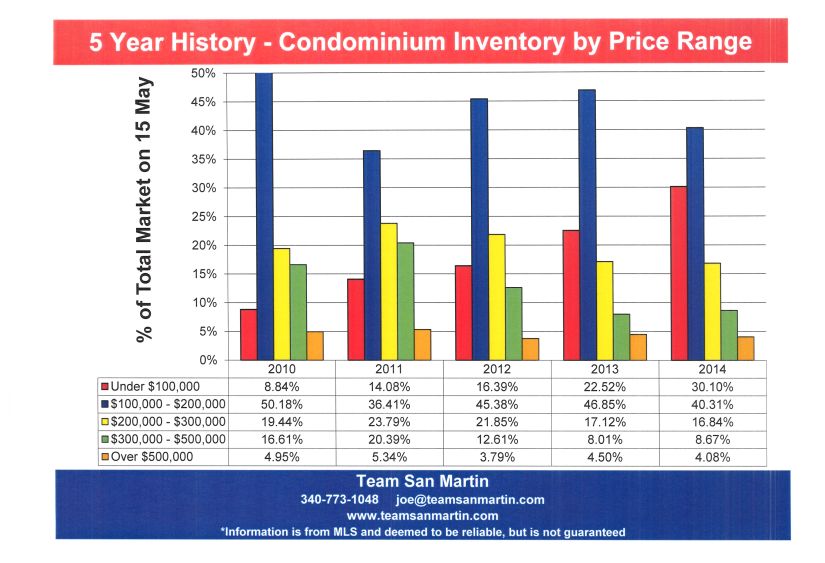
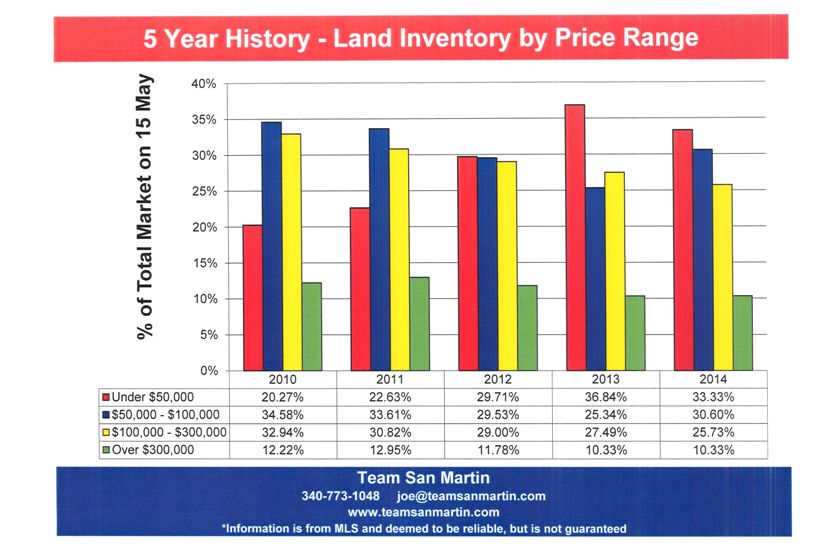
May 2014
Inventory Levels and Sales Projections
May Inventory Levels
4 Year Review
RESIDENTIAL
Inventory levels are slightly higher (19 homes) than four years ago and about 10% lower than May of 2012 and 2013
CONDOMINIUM
Inventory levels are the lowest they have been in May for the past four years; in May 2012, there were 59 more condominiums for sale than in May 2014.
LAND
Land inventory is approximately the same as May 2013 and 17% lower (82 lots) than in May 2011
May Pending Sales Levels
4 Year Review
RESIDENTIAL
The number of pending home sales is approximately the same as May 2013 and about 30% higher than in May of 2011 and 2012.
CONDOMINIUM
Big improvement in pending condominium sales over May of 2011 and 2012! Pending condominium sales are approximately the same as May 2013.
LAND
Disappointing pending contract numbers. May 2014 is the lowest number of pending land contracts when compared to the same date for the previous three years.
2014 Sales Projections
Using the assumption that the first 4 months of 2014 is a valid predictor for the entire year
yields some interesting projections
RESIDENTIAL
51 homes sold in the first 4 months of 2014. Extended, this would be 153 home sales during 2014, or 52% of the current inventory.
CONDOMINIUM
29 condominiums sold during the first 4 months of 2014. Extended, this would be 87 condominium sales during 2014, or 51% of the current inventory.
LAND
Only 9 lots sold during the first 4 months of 2014. Extended, this would be 27 lot sales during 2014, or 5% of the current inventory. What will change this low level of sales? As the residential and condominium inventory sells off, sales prices for improved properties will increase to replacement level or greater, making land a more attractive investment.
Information is from MLS and deemed to be reliable, but is not guaranteed.
Prepared by:
Julie San Martin
Team Manager
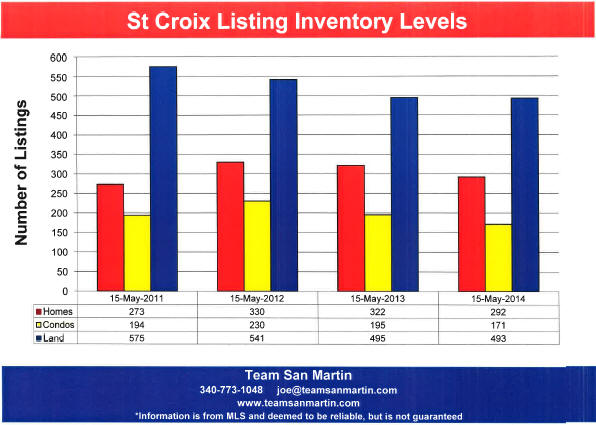
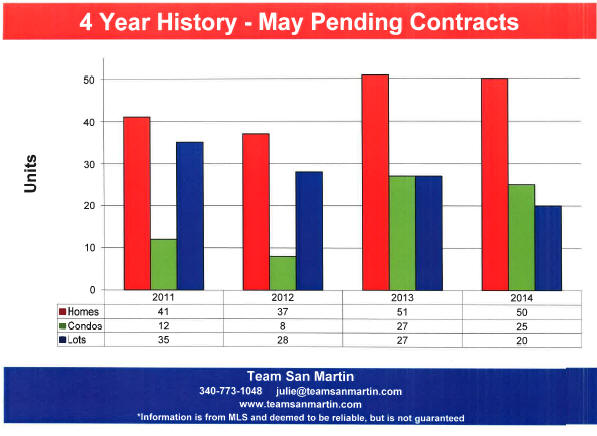
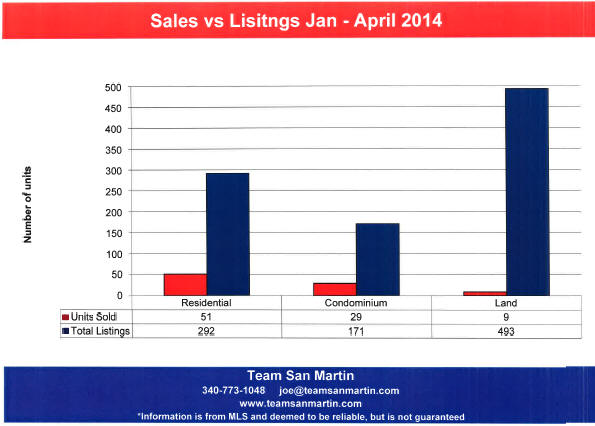
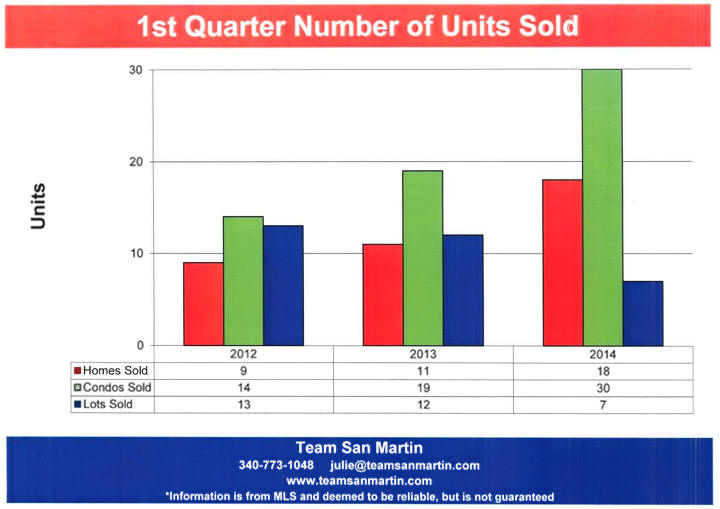
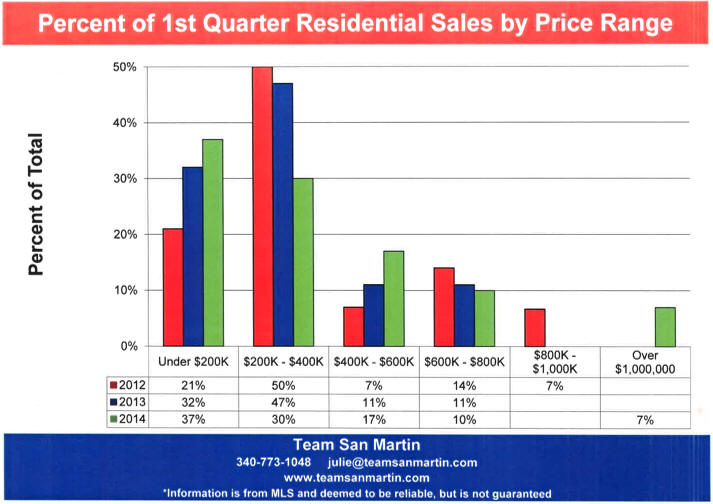
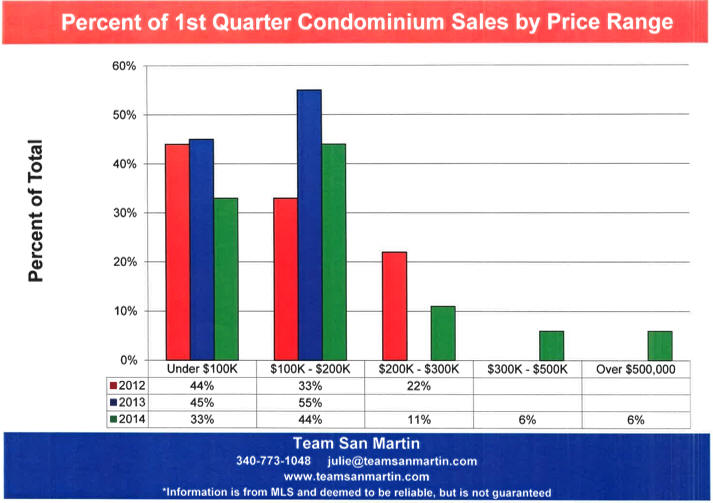
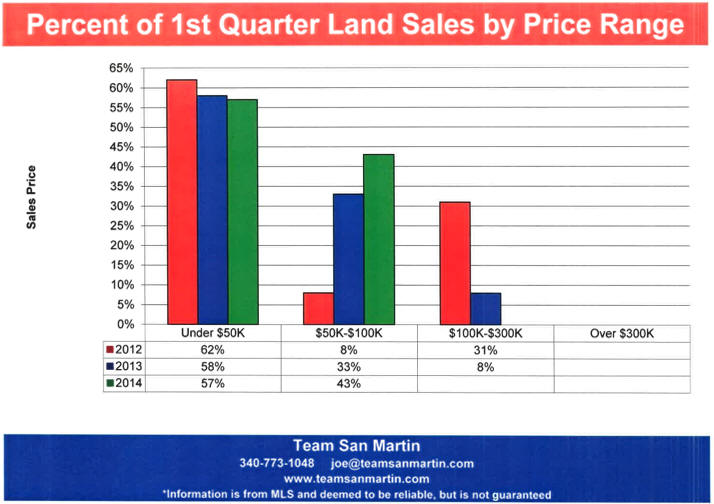
March 2014
Home Sales
St. Thomas vs St. Croix
In 2003, 11 years ago, the average home sales price on St Thomas ($416,250) and St Croix ($415,396) were nearly identical.
In 2013, the average home sales price on St Thomas ($606, 694) was double the average home sales price on St Croix ($318,447).
Since 2010, the average sales price of a St Croix home has decreased every year, with a total decrease of 30% over the 4 year period.
Since 2011, the average sales price of a St Thomas home has increased every year, with a total increase of 20% over the 3 year period.
The St Thomas total home market has very nearly regained the 2003 level of $47.9 Million; 2013 St Thomas home sales totaled $43.7 Million.
2013 total home sales on St Croix were on 53% ($37.9 Million) of total 2003 St Croix home sales ($71.9 Million).
On St Thomas, the total number of home sales has declined 37% between 2003 (115 home sales) and 2013 (72 home sales). The lowest number of home sales on St Thomas during this period was in 2009, when only 46 home sales closed on St Thomas.
On St Croix, the total number of home sales declined 31% between 2003 (173 home sales) and 2013 (119 home sales). The lowest number of home sales on St Croix during this period was in 2012, when only 88 home sales closed on St Croix.
Every year, more homes are sold on St Croix than on St Thomas; the ratio is consistent - for every 2 homes sold on St Thomas, 3 homes are sold on St. Croix.
Information is from MLS and deemed to be reliable, but is not guaranteed.
Prepared by:
Julie San Martin
Team Manager
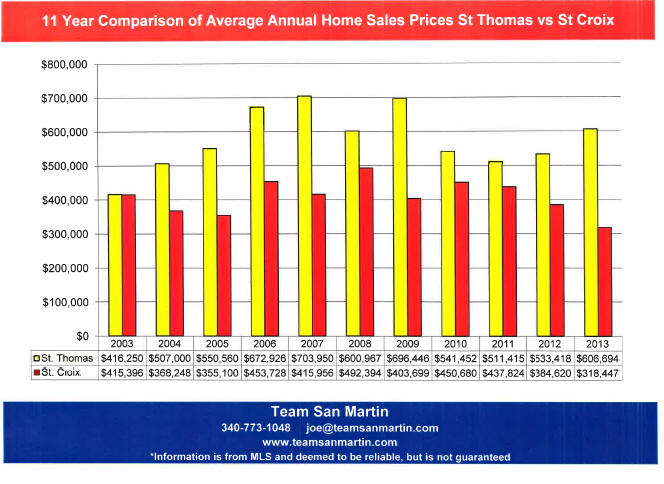
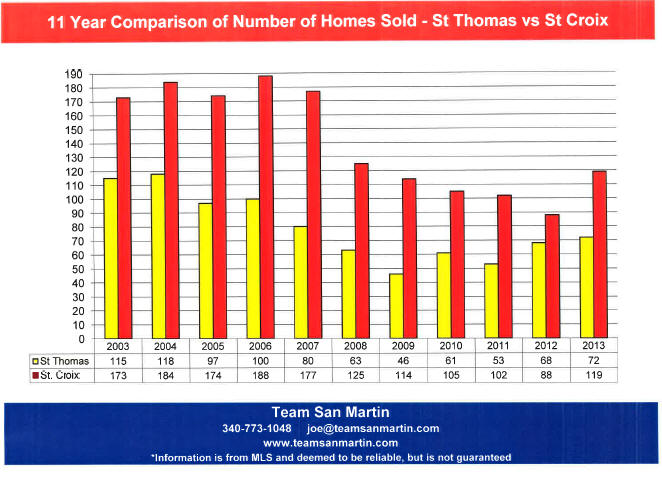
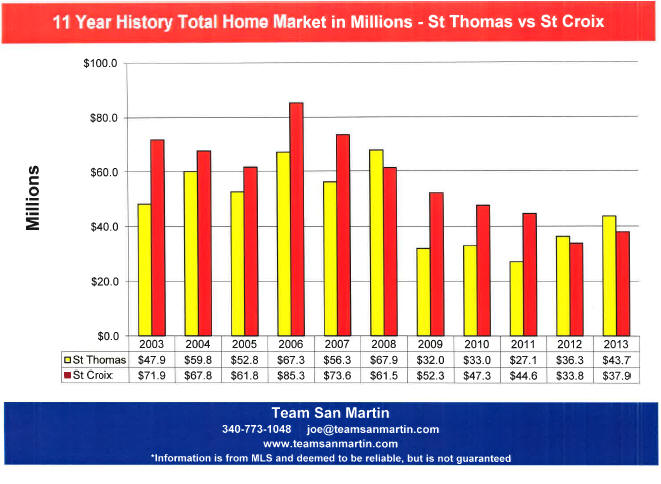
February 2014
68 Condominiums Sold on St Croix During 2013
Complexes with 8 units sold during 2013
· Mill Harbour – average sales price: $69,688
· Villa Madeleine – average sales price : $244,312
Complexes with 6 units sold during 2013
· The Reef – average sales price: $152,333
· Carambola (Saman, Sweet Lime I & II) – average sales price : $152,583
Complexes with 4 units sold during 2013
· Bay Garden, Long & Little Reef – average sales price: $44,000
· St C – average sales price : $87,750
· Questa Verde – average sales price: $93,750
· Colony Cove – average sales price : $143,100
Complexes with 3 units sold during 2013
· Pelican Cove – average sales price: $184,333
· Gentle winds – average sales price : $235,000
· Carden Beach – average sales price: $490,000
Complexes with 2 units sold during 2013
· Sunset Beach – average sales price: $135,000
· Coakley Bay – average sales price : $155,000
Complexes with 1 unit sold during 2013
· Vista Mar – sales price: $59,000
· Queens Ridge – sales price : $73,000
· Coral & Cruzan Princess – sales price : $75,000
· Peters Farm – sales price: $77,000
· Club St Croix – sales price : $107,500
· Ft Augusta – sales price : $125,000
· Plantation – sales price : $159,000
· Harbour Beach – sales price : $165,000
· Maison De Poincy – sales price : $184,000
· Sugar Beach – sales price : $350,000 (4 bedroon unit)
· Candle Reef I & II – sales price : $460,000

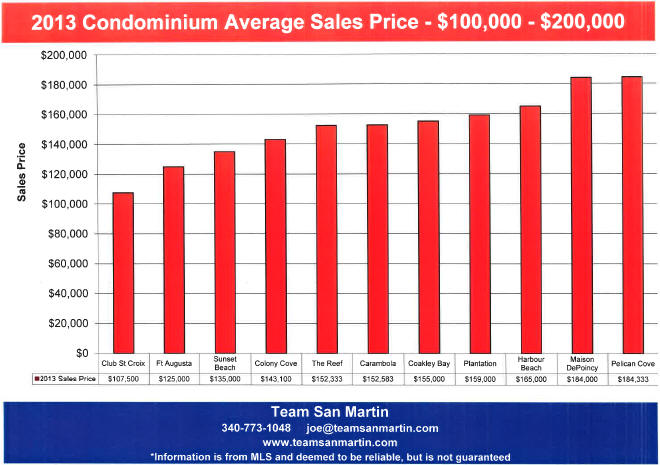
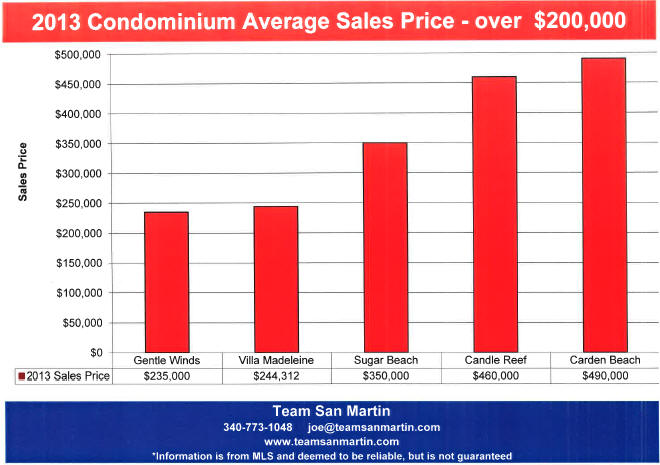
Information is from MLS and deemed to be reliable, but is not guaranteed.
Prepared by:
Julie San Martin
Team Manager
January 2014